
Datafam will agree that smart work matters more than hard work for efficient teams. And starting from scratch every time you get a marketing dashboard request just isn't it, especially when pre-built templates for the exact use case are at your fingertips.
This blog covers 8 of the most requested Tableau marketing dashboard examples, showing how marketers visualize campaign spend, ROAS, attribution, and funnel performance in a single Tableau workbook. Additionally, 48+ free and paid Tableau marketing dashboard templates from Mokkup.ai await you at the end, which you can open, customize with AI, and export to Tableau with a single click.
Table of Contents
- 8 Tableau Marketing Dashboard Examples
- Tableau Marketing Dashboards- Quick Comparison
- What Is a Tableau Marketing Dashboard?
- Key KPIs Every Tableau Marketing Dashboard Should Track
- Types of Tableau Marketing Dashboards
- How to Design a Tableau Marketing Dashboard
- 3 Mistakes That Kill Tableau Marketing Dashboards Before They're Built
- Explore All 48+ Free Tableau Marketing Dashboard Templates
8 Tableau Marketing Dashboard Examples
Let’s go through eight most popular Tableau marketing dashboard examples, each built for a different audience, user-persona, and marketing question.
1. Digital Marketing Overview Dashboard
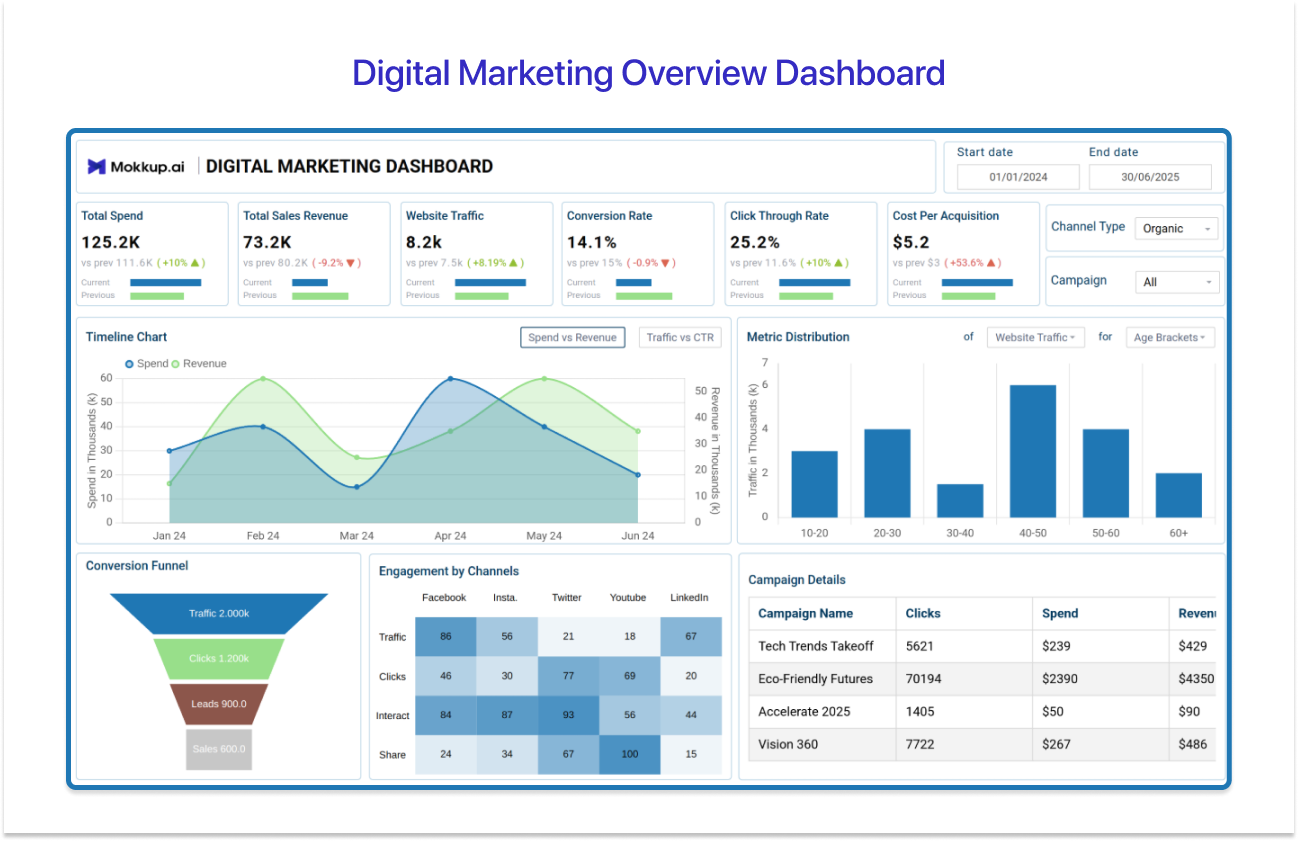
The Digital Marketing Overview Dashboard, also called the Digital Marketing Dashboard Template on Mokkup, is the executive level design. Most marketing teams need such a view before they build something specific because it consolidates total spend, ROAS, CTR, CPC, impressions, conversions, and cost per conversion across all active channels into a single view.
Best for: CMOs, marketing directors, and team leads to get a picture of overall campaign performance without switching between platform dashboards.
Top KPIs it cover: Conversion rate, Website Traffic, Total spend, CPA, CTR, Total Sales Revenue
→ Get the Digital Marketing Dashboard Template on Mokkup
2. Multi-Touch Campaign Attribution Dashboard
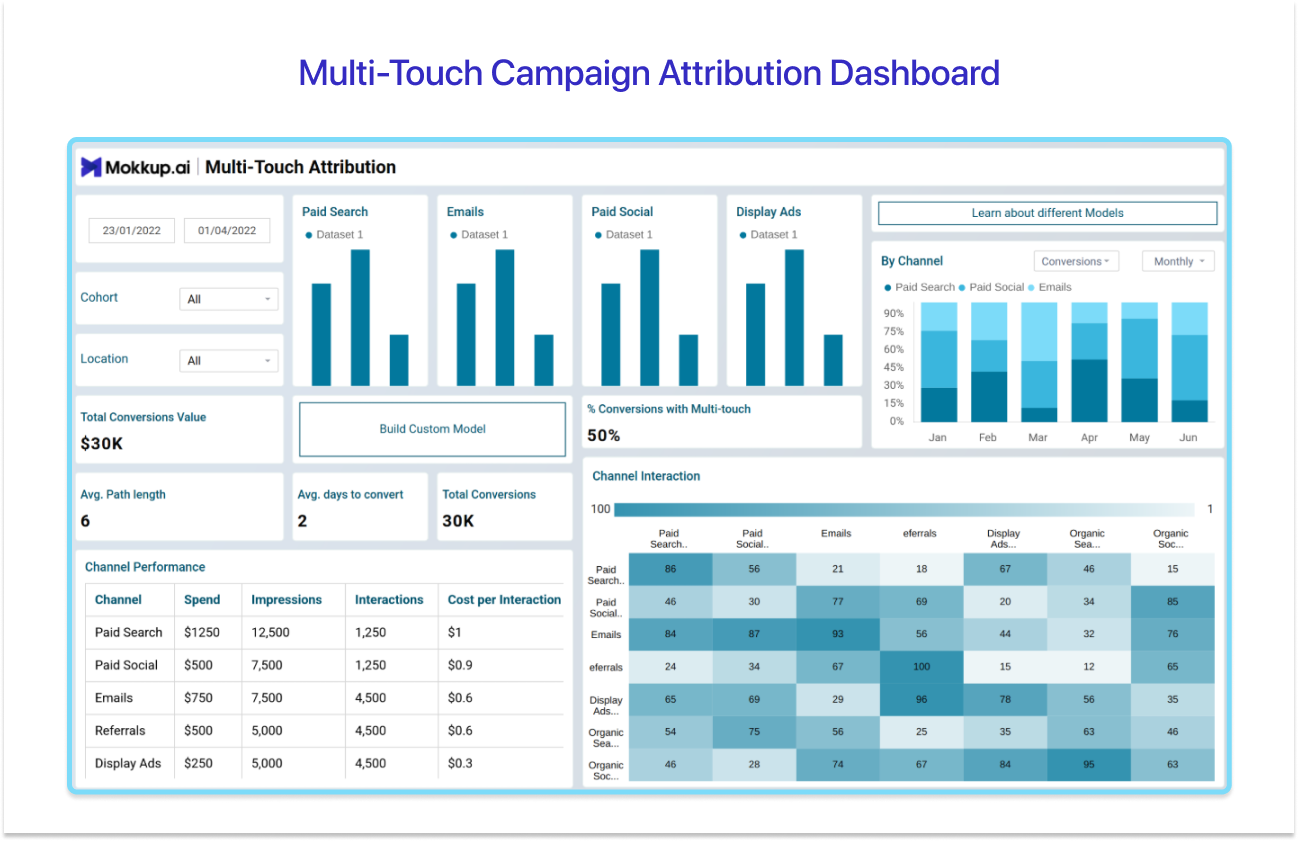
Attribution is a serious issue in the marketing space. Nearly 51% of CTOs and chief data officers don't find their marketing platform data trustworthy, indicating a broken attribution system. A Multi-touch attribution is a crucial strategy that addresses this issue by taking into account all customer touchpoints and giving their proportionate credit, depending on their impact on final sale. Mokkup’s Multi-Touch Campaign Attribution dashboard is built to cater exactly this objective.
Best for: Marketing managers and revenue teams who like to track how customers discover and evaluate their product across multiple touchpoints to allocate marketing budgets accordingly.
Top KPIs it cover: Paid Search, Paid Social, By Channel Conversion, Channel Performance, Top Conversion Value,Channel with Highest Attribute, and more
→ Get the Multi-Touch Campaign Attribution Template on Mokkup
3. Email Marketing Performance Dashboard
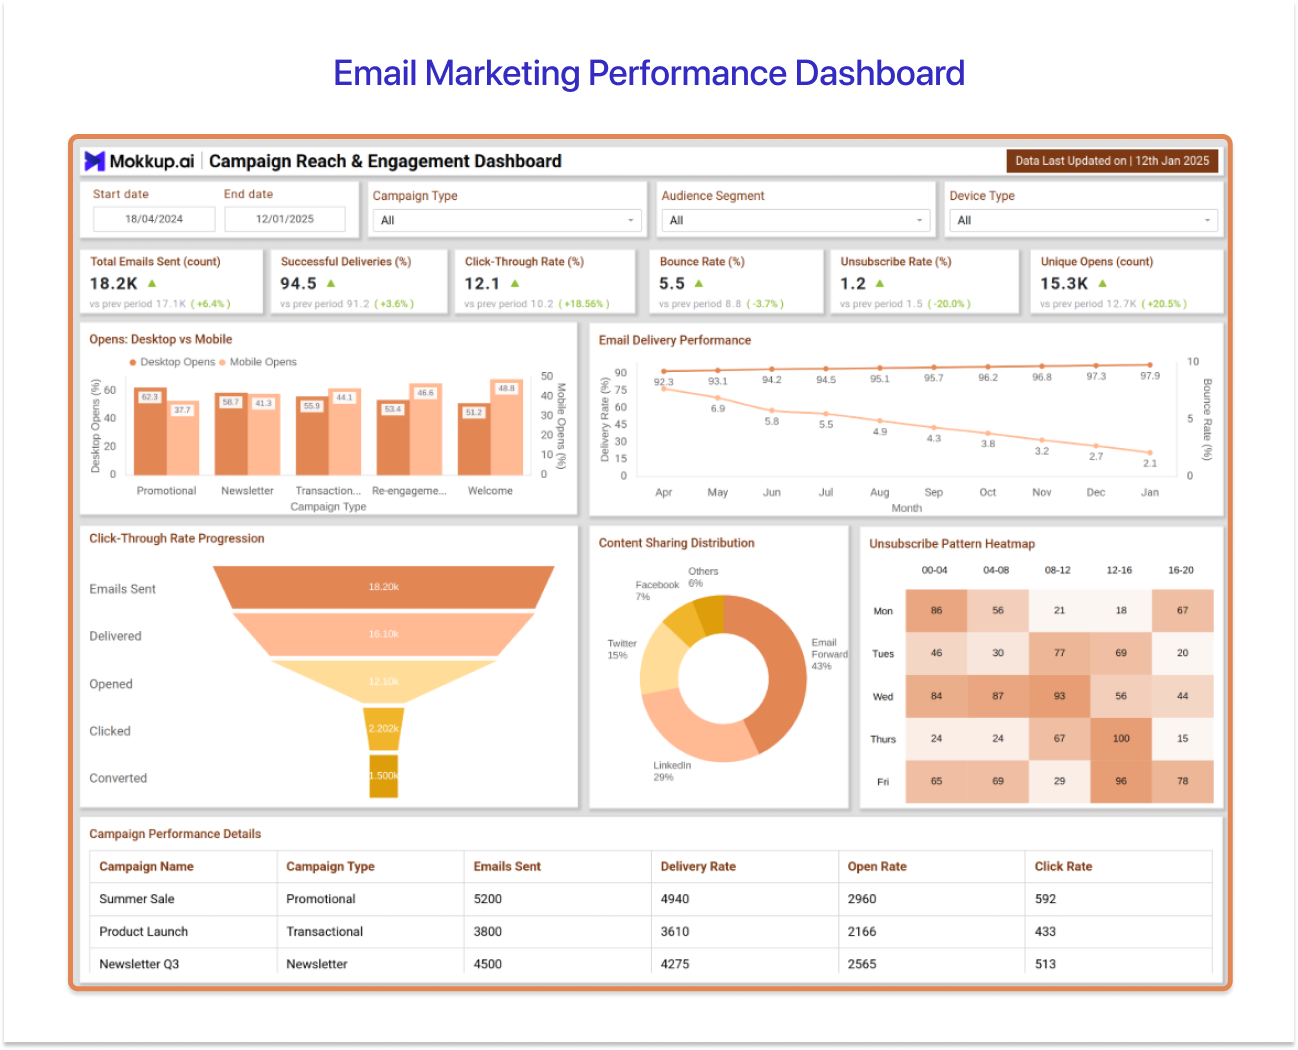
Next up in Tableau marketing dashboard examples is the Email Marketing Performance dashboard. As per certain sources, email marketing returns $36 for every dollar spent, making it one of the most hughes ROAS delivering channels in marketing. Thus, the Email Campaign Performance Dashboard Template on Mokkup, exists specifically to help marketers track performance of their email campaigns.
Best for: Email marketers, CRM managers, and marketing analysts who want a revenue view of their marketing email performance.
Top KPIs it cover: Total Emails sent, Successful Deliveries (%), Unique Opens (%), CTR %, Revenue Per Email (RPE), List Growth Rate (%)
→Get the Email Campaign Performance Dashboard Template on Mokkup
4. Social Media Analytics Dashboard
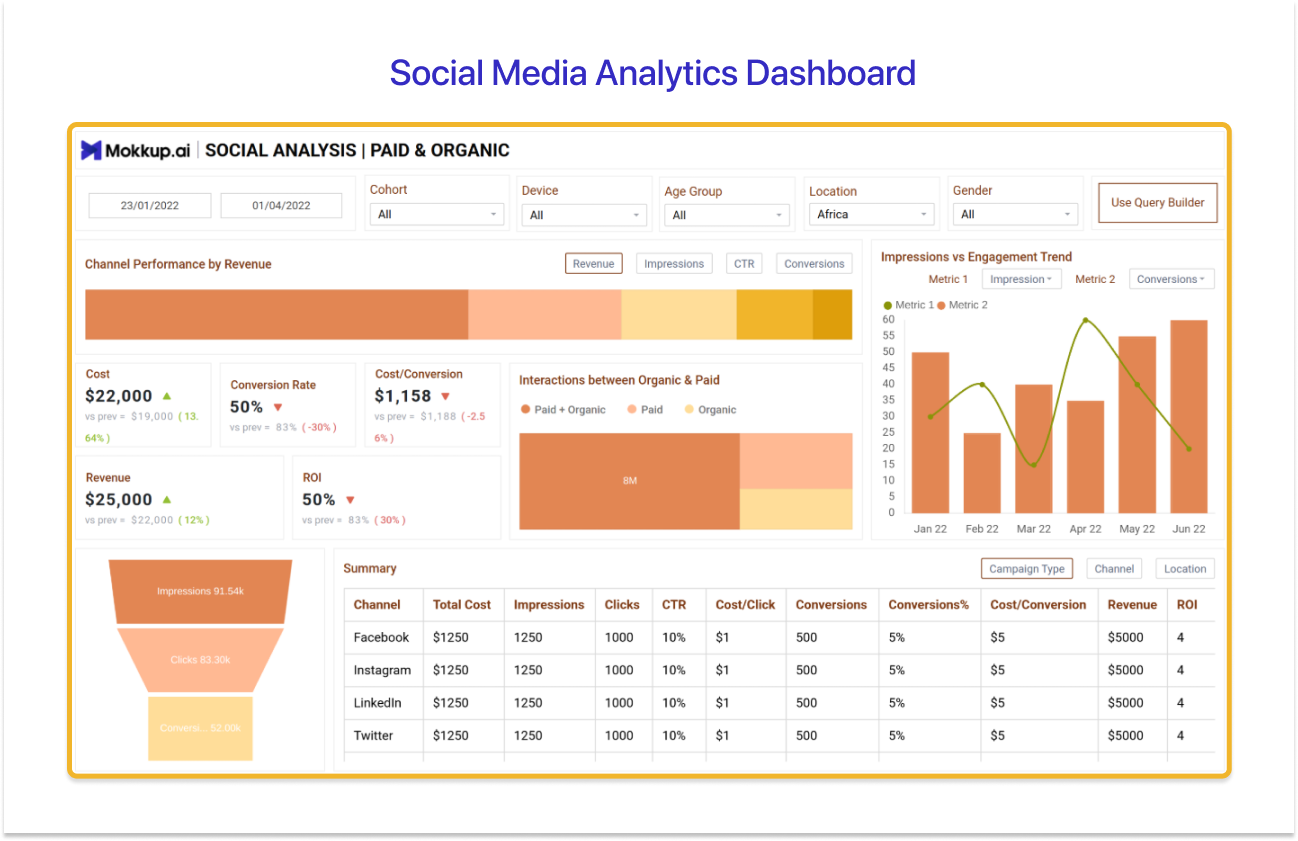
Cross-platform social reporting is a tricky part for any marketer. Partly because Instagram's engagement rate formula differs from LinkedIn's, and neither maps cleanly to Twitter/X metrics. The Social Media Analytics Dashboard on Mokkup, tones down this complexity through a unified channel analytics view. It shows impressions, reach, engagement rate, follower growth, post frequency, clicks, and shares to formulate the performance of social media posts across channels. It goes a step ahead with a platform-by-platform campaign performance breakdown that shows social managers exactly where they're winning across channels.
Best for: Social media managers, brand teams, and digital marketing analysts who need a view across multiple platforms
Top KPIs it covers: Conversion, ROI, Interaction between Organic & Paid, Impression Vs Engagement Trend, Conversion rate, Follower Tren for Campaign Type, Video Engagement, User Query Builder, Campaign Summary and more.
→ Get the Social Media Analysis Template on Mokkup

5. Content Marketing Dashboard
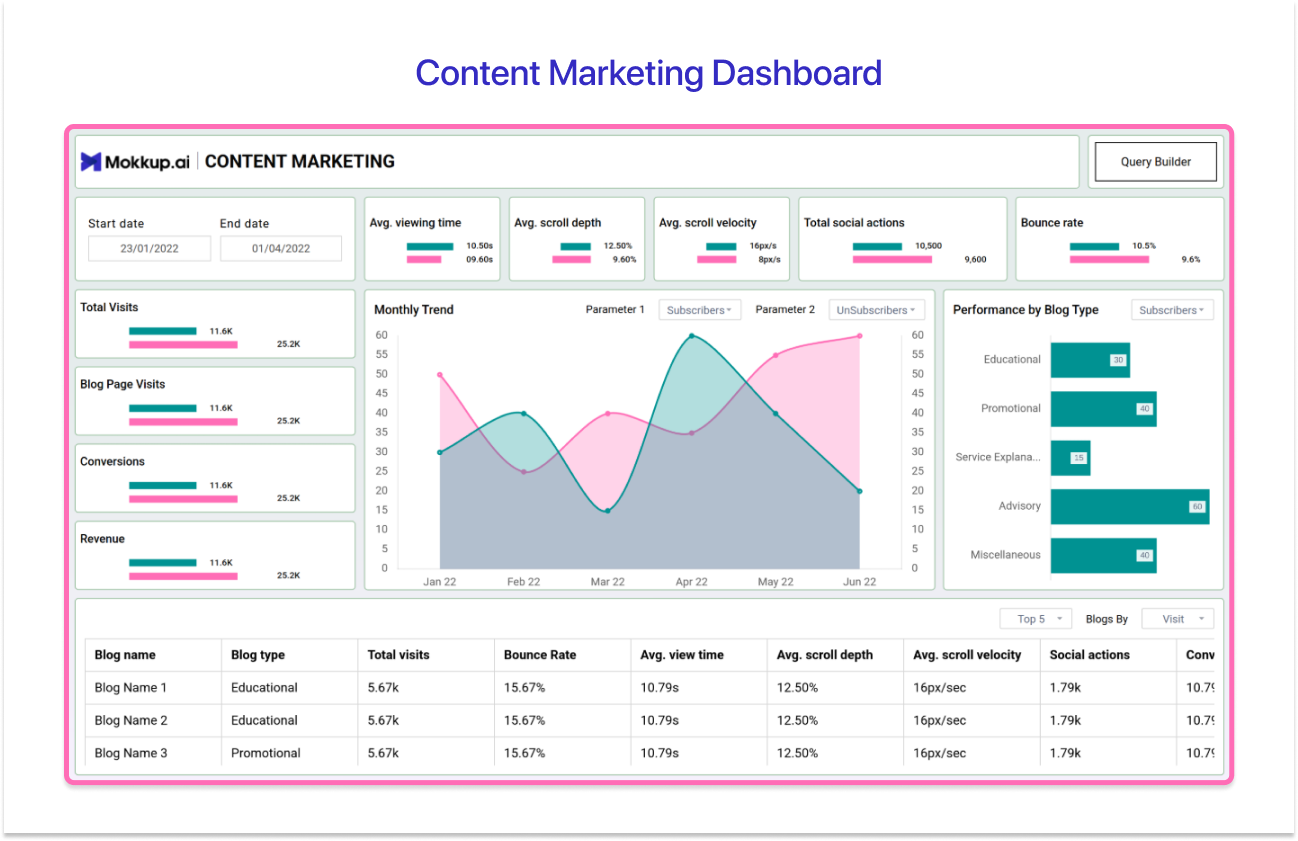
The Content Marketing Dashboard template assists in analyzing if your material is effective performance wise. By tracking a hand-picked set of variables, it helps monitor campaign development and identifies opportunities for marketing strategy enhancements. Such Tableau marketing KPI dashboards are very popular among content-focused marketers as it gives a holistic view of content effectiveness and competitor performance.
Best for: Content strategists, SEO managers, and marketing analysts who need to prove content ROI and work around the marketing funnel (TOFU, MOFU, BOFU).
Top KPIs it covers: Average Scroll depth, Average Scroll velocity, Social actions, Performance by blog Type, Bounce Rate, Channel with Conversion, Sub-Channel with conversion, Backlink Performance, CTR and more
→ Get the Content Marketing Template on Mokkup
6. Marketing Funnel Dashboard
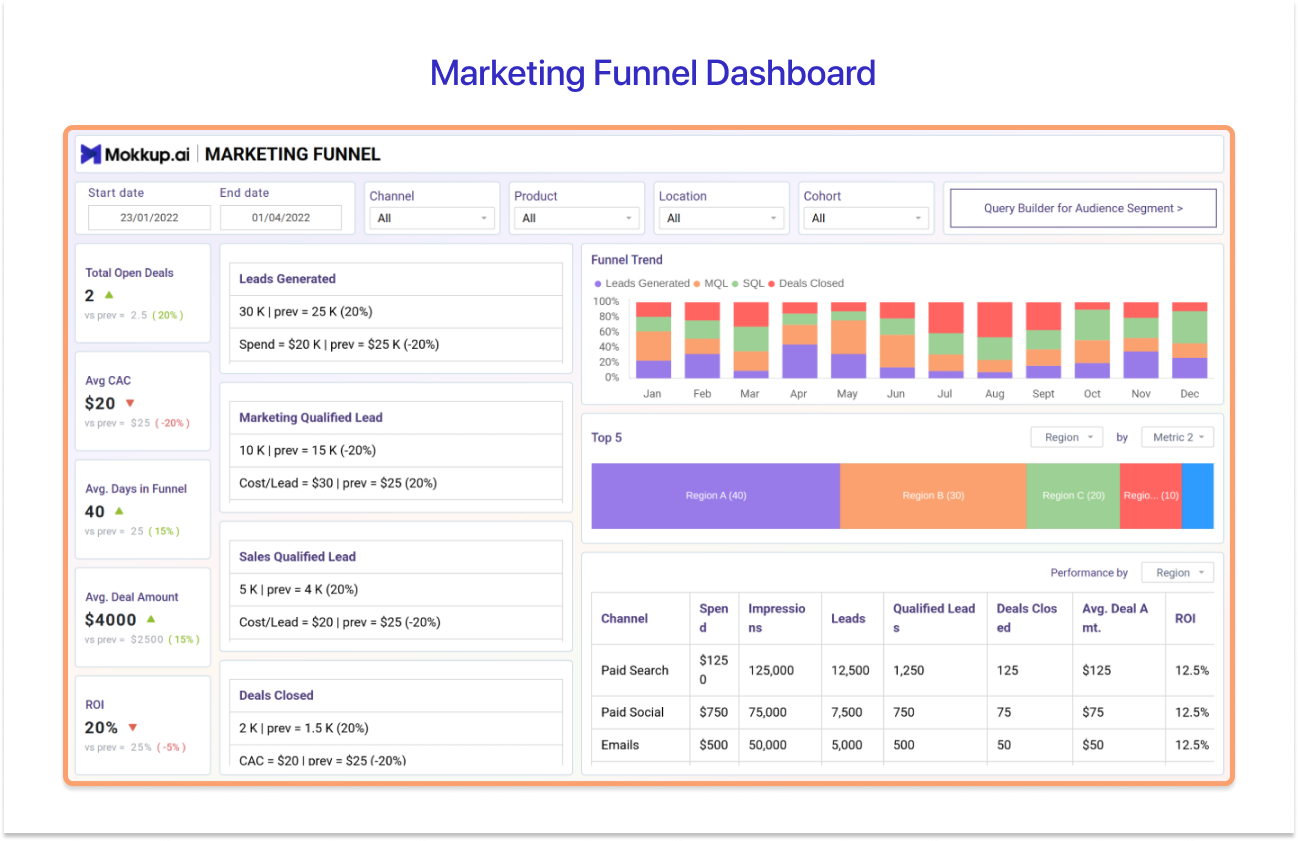
With the marketing funnel being the foundation of most ROI strategies, a Tableau Marketing dashboard focussing exclusively on it is a must-have. Mokkup’s marketing Funnel Dashboard maps out the leads’ path from being brand aware to actually becoming its customers. With key focus on lead generation volume, MQL count, SQL conversions, stage-to-stage conversion rate, funnel drop-off percentage, CAC, and average days across channels, it helps you identify where your marketing pipeline is leaking.
Best for: Demand gen teams, marketing ops managers, and revenue leaders who need to diagnose funnel drop-offs
Top KPIs it covers: Leads generated, Marketing Qualified Lead (MQL), Sales Qualified Lead (SQL), Deals closed, ROI, Average Deal Amount, Average CAC, Funnel Trend, Channel Performance By Spend, Channel Performance By Goals Completed, Avg. CLTV, Retention %, Avg. CTR and more
→ Get the Marketing Funnel Template on Mokkup
7. Marketing Mix Model Dashboard
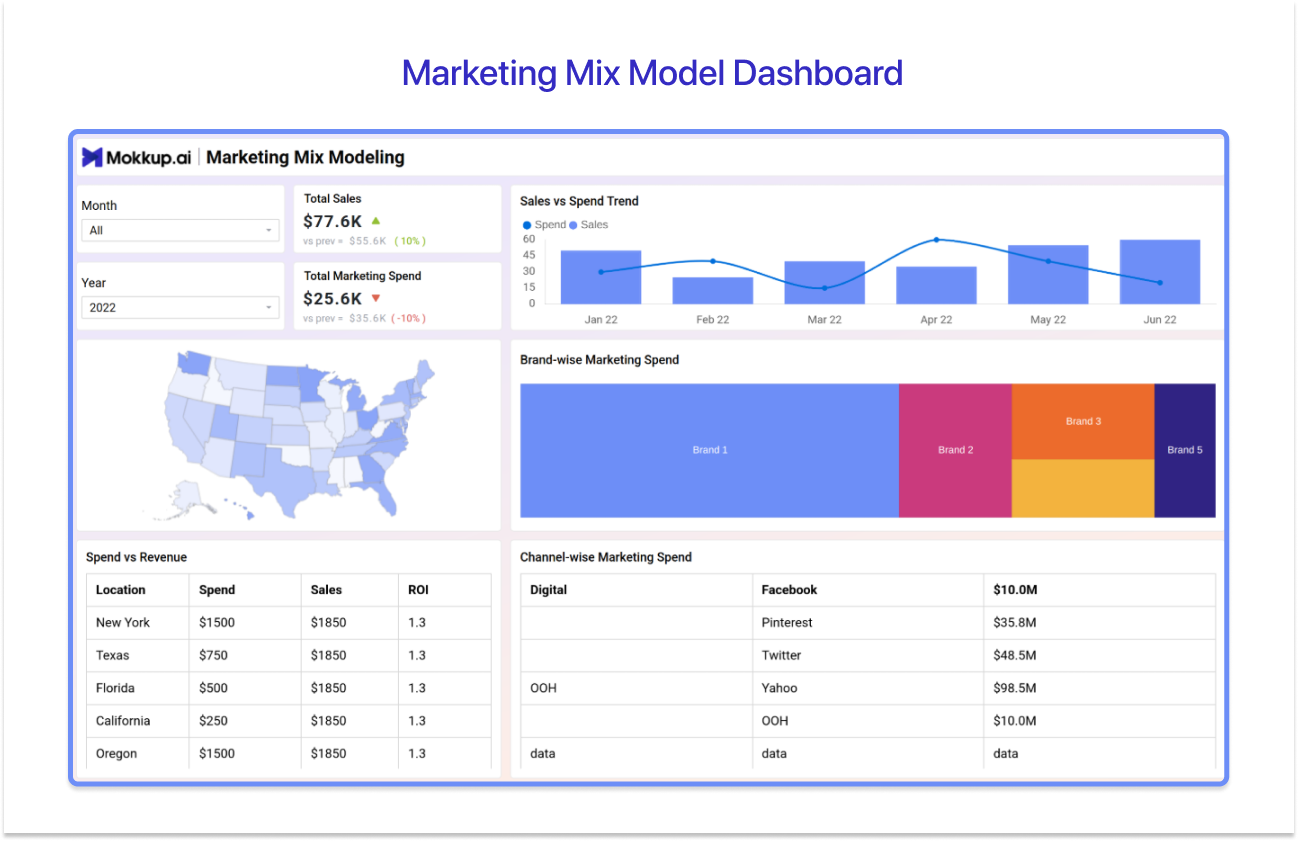
For digital marketers, no single persona fits their needs as they serve a wide array of roles in a team. They need a Tableau digital marketing dashboard that operates on a well-curated Marketing Mix Model (MMM). Serving this purpose, Mokkup’s ready-to-use Marketing Mix Model Dashboard covers revenue contribution by channel, marginal ROAS, spend allocation versus optimal mix and more. It supports effective marketing spending and overall revenue production.
Best for: Digital Marketers, Marketing directors, and CMOs who need to model the true revenue contribution of each channel for budget decisions.
Top KPIs it covers: Total Marketing Spend, Sales Vs Spend Trend, Brand-wise Marketing spend, Spend v/s Revenue, Channel-wise Marketing spend, Initial Vs Optimized Budget Allocation, Average. Adstock Decay Rate, Optimized Spend and more.
→ Get the Marketing Mix Model Template on Mokkup
8. Display Ads Performance Dashboard
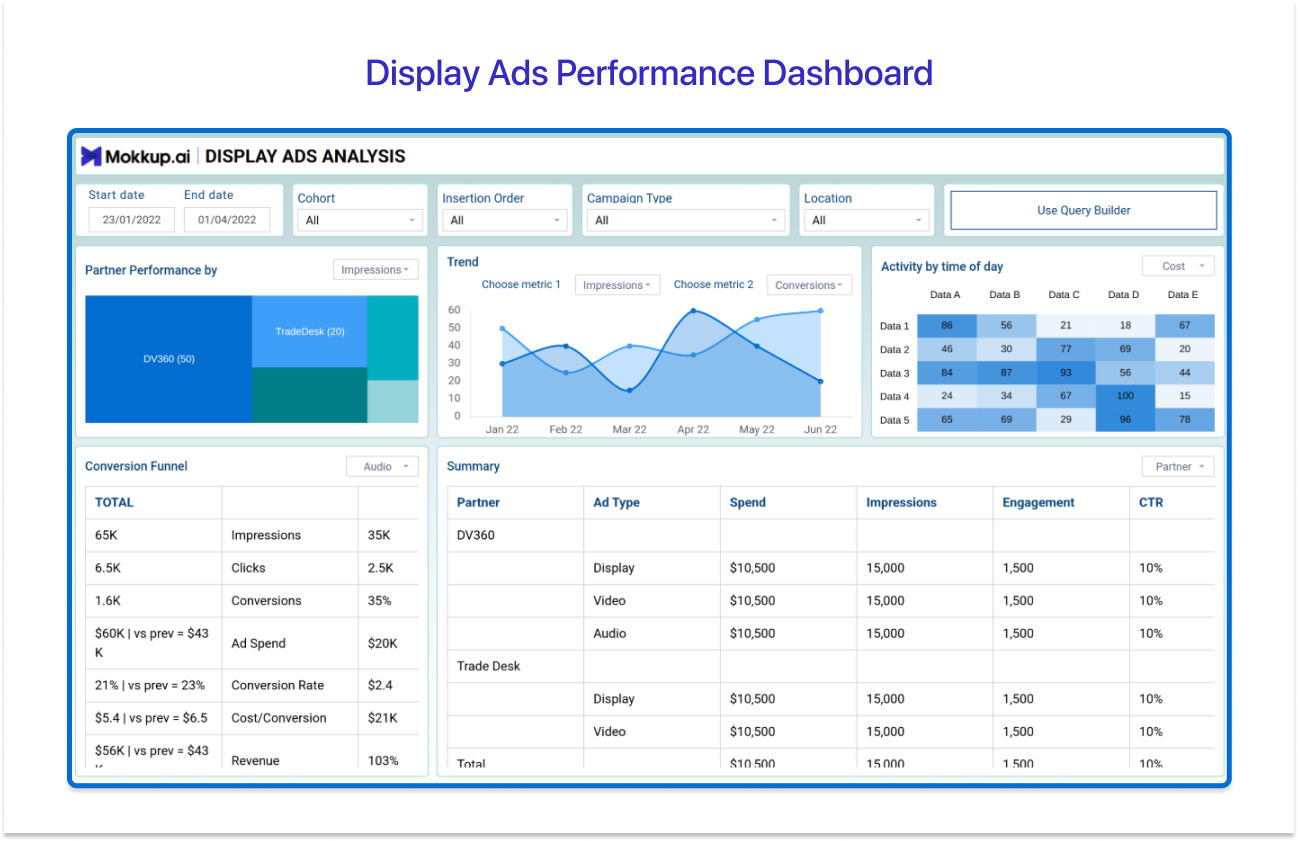
One of the underestimated Tableau Marketing Dashboard examples is the Display advertising Performance Dashboard. Despite display ads generating enormous impression volume, a tracker that helps you make sense of view-through conversions, creative-level campaign performance, and frequency management in one place can be game-changing. The Display Ads Performance Dashboard, also known as the Display Ads Analysis template on Mokkup, holds all of it together.
Best for: Paid media managers and performance marketers who need creative-level visibility across display networks
Top KPIs it covers: Insertion Order, CTR, Conversion Funnel, Partner Performance by Impression, Campaign, Partner Frequency, Impression Trend, Listened, and more
→ Get the Display Ads Analysis Template on Mokkup
Tableau Marketing Dashboards- Quick Comparison
Use this table to quickly pick the dashboard that matches your role and the question you’re trying to answer.
|
Dashboard |
Best For |
Pick This When… |
|
Digital Marketing Overview Dashboard |
CMOs, marketing directors, team leads |
You need a single view of total spend, ROAS, CTR, and conversions across all active channels without switching between platform dashboards. |
|
Multi-Touch Campaign Attribution Dashboard |
Marketing managers, revenue teams |
You're tracking how customers discover and evaluate your product across multiple touchpoints to allocate budget by actual contribution. |
|
Email Marketing Performance Dashboard |
Email marketers, CRM managers, marketing analysts |
You need a revenue-focused view of email campaign performance, like open rate, CTR, RPE, and list growth, in one place. |
|
Social Media Analytics Dashboard |
Social media managers, brand teams, and digital marketing analysts |
You're reporting across multiple platforms and need a unified channel analytics view instead of pulling numbers from each platform separately. |
|
Content Marketing Dashboard |
Content strategists, SEO managers, marketing analysts |
Leadership is asking whether content is driving results. You need to track bounce rate, CTR, backlinks, and conversion by channel. |
|
Marketing Funnel Dashboard |
Demand gen teams, marketing ops managers, revenue leaders |
You need to identify where the funnel is leaking from lead generation through MQL, SQL, and CAC across channels. |
|
Marketing Mix Model Dashboard |
Digital marketers, marketing directors, CMOs |
You're making budget allocation decisions and need to model true revenue contribution and marginal ROAS by channel. |
|
Display Ads Performance Dashboard |
Paid media managers, performance marketers |
You're running display campaigns and need creative-level visibility into impressions, conversion funnel, and partner performance. |
What Is a Tableau Marketing Dashboard?
A Tableau marketing dashboard is a visualization that consolidates large marketing data into a real-time view, compatible with Tableau Desktop or Tableau Online. It serves as a single source of truth, eliminating or reducing the need to juggle multiple marketing spreadsheets to get actionable insights.
The difference between the marketing dashboard Tableau folks prefer and the one they don’t, comes down to three simple questions:
- which KPIs it surfaces at the top level,
- how cleanly it handled multi-source data
- whether the layout was agreed upon by stakeholderd

Key KPIs Every Tableau Marketing Dashboard Should Track
To pick the right marketing analytics dashboard, Tableau-native in nature or sketch on a blank canvas, you need to have clarity on what KPIs it should track and why. Here are some of the most common marketing KPIs a Tableau marketing KPI dashboard usually covers, split by audience:
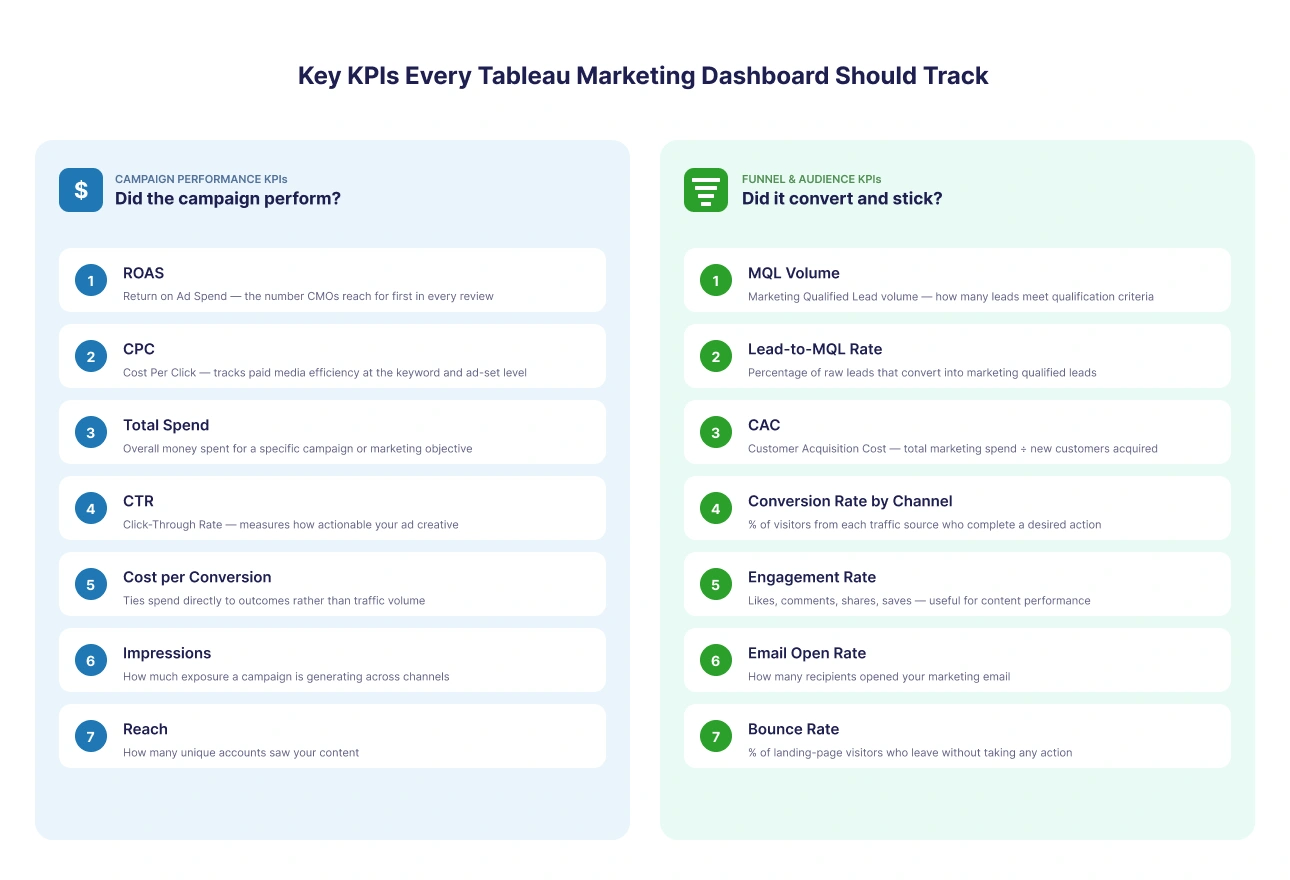
Campaign Performance KPIs
- ROAS (Return on Ad Spend) is the number CMOs reach for first in every review. It tells how many dollars in revenue each dollar spent on ads is bringing in. ROAS is the quickest way to surface an underperforming paid marketing channel.
- CPC (Cost Per Click) tracks paid media efficiency at the keyword and ad set level.
- Total Spend is the overall money spent for a specific campaign or marketing objective.
- CTR (Click-Through Rate) measures how actionable your ad creative is against how often it's being shown to the audience.
- Cost per conversion is the efficiency metric that budget holders actually act on. It ties spend directly to outcomes rather than traffic volume.
- Impressions show how much exposure a campaign is generating. Individually, they mean little, but they make CTR and reach numbers interpretable.
- Reach measures how many unique accounts saw your content.
Funnel and Audience KPIs
- MQL (Marketing Qualified Lead) volume measures the number of leads that meet your qualification criteria of a lead. It helps assess whether a top-of-funnel activity is converting into a high intent buyer.
- Lead-to-MQL rate means the percentage of raw leads that convert into marketing qualified leads. It can help diagnose if a marketing campaign is attracting the wrong audience.
- CAC (Customer Acquisition Cost) is the output when total marketing spend is divided by new customers acquired in a specific period. Marketers use it to evaluate whether they are achieving customer growth at a cost that the business can sustain or not.
- Conversion rate by channel is the percentage of visitors from each traffic source who complete a desired action.
- Engagement rate measures different types of meaningful interactions. Some most common interactions it measures are likes, comments, shares, and saves. Useful when evaluating content performance.
- Email open rate tells how many recipients opened your marketing email.
- Bounce rate is a metric that usually applies to a landing page. It is the percentage of visitors who leave without taking any action.
Types of Tableau Marketing Dashboards
A wide variety of Tableau marketing dashboards exist. And the best way to pick the right one is to understand the audience they are built for. Knowing which type you need before you start building saves a lot of rework.
Channel Performance Dashboards
The majority of marketers need to check specific metrics daily. They prioritize delivery-focused KPIs, like CTR, CPC, open rate, reach, and engagement rate. Channel Performance Dashboards, like the Email Performance, Social Media Analytics, and Display Ads dashboards from the above list, fall into this category. A Tableau marketing KPI dashboard like this is deliberately narrow. One channel, one audience, five to seven KPIs at most. Whether you're starting from a ready-to-use Tableau template or building a Tableau digital marketing dashboard from scratch, breadth is the wrong design goal here.
Executive Marketing Dashboards
Executive marketing dashboards are the CMO and VP of Marketing's view. Total spend, ROAS, revenue contribution, and funnel volume at a glance, built for scanning, not analysis. One or two Tableau sheets, minimal drill-down, and KPI cards that show directional movement before the reader even processes the underlying numbers. The digital marketing overview and marketing mix model dashboards in this list are built for that audience.
Analytical Marketing Dashboards
For marketers looking into the revenue side of things, picking analytical marketing dashboards is their best bet. Such dashboards answer serious questions like which channels drive revenue, where the funnel is leaking between MQL and SQL, or which attribution model is telling how customers discover the product. Some examples of Analytical Marketing dashboards are the Multi-Touch Attribution, Content Marketing, and Marketing Funnel Dashboards.
How to Design a Tableau Marketing Dashboard (The Wireframe-First Approach)
Analyzing the experience of BI developers building marketing dashboards in Tableau, we spotted the same costly mistake: they connect the data source first without cracking the layout first. As a result, when the CMO sees the workbook and asks for a different layout or different KPIs, the entire build restarts.
Wireframe-first is one of the easiest solutions to avoid this. Here’s how it looks in the workflow:
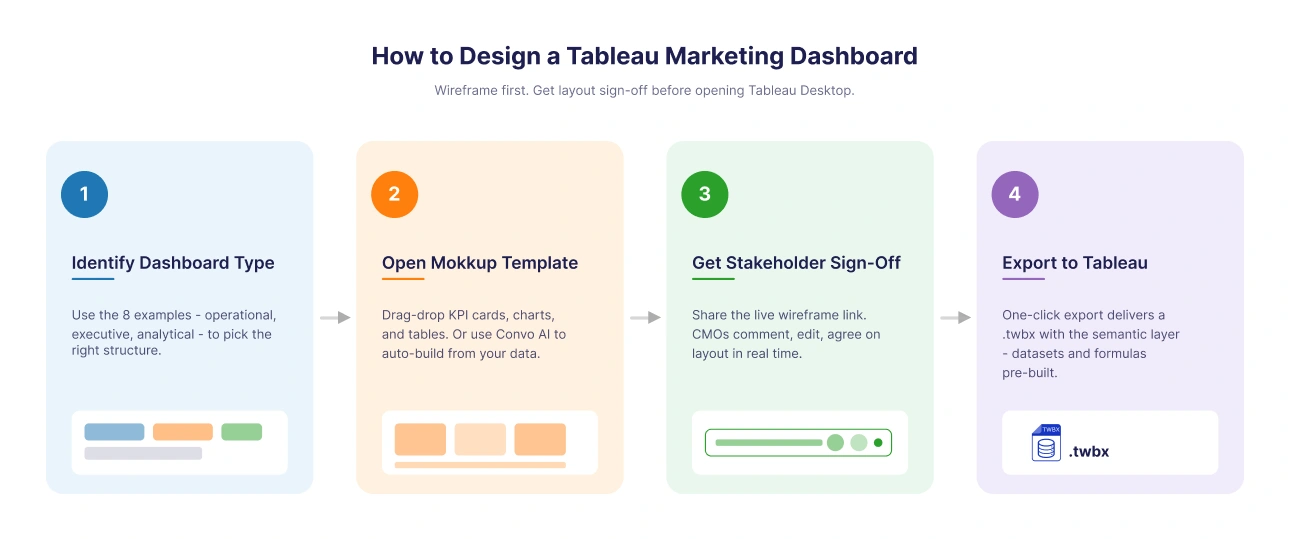
Step 1: Identify your dashboard type. Go through the eight Tableau marketing dashboard examples explained above to figure out which suits your needs the most. This one decision determines how fast you get the final wireframe ready.
Step 2: Open the free Mokkup Tableau template and edit. Unlike other, AI dashboard wireframing tools, Mokkup lets you edit the selected template. You can rearrange KPI cards, chart types, and table structures without writing any code with simple drag-and-drop functionality. If you have a sample data file, upload it to Mokkup's Convo AI. It reads your column headers and data types and builds the wireframe layout around your actual marketing data structure rather than generic placeholder fields. The result is a mockup that already reflects your real data model, which makes stakeholder review conversations significantly more concrete.
Step 3: Get sign-off on the wireframe before touching Tableau. This is the most crucial step that saves weeks of rebuilding if done right. Share the final Mokkup dashboard template link with your CMO or marketing director and other stakeholders to collect feedback at the layout stage. You can collaborate with your team in real-time and agree on a final layout without going back and forth.
Step 4: Export directly from Mokkup to Tableau. This is where the semantic layer matters. Mokkup’s Tableau export is capable of giving a .twbx file that carries the dataset, all calculated fields, measures, and formulas already pre-configured inside the workbook. In practical workflow, this means the developer opens the file, connects the real data source, and moves straight into validation and publishing, skipping the manual rebuild step that typically adds days to a dashboard project. This is a Tableau-exclusive feature (Power BI support is coming soon), and it's the key reason teams choose Mokkup over Figma or PowerPoint for their wireframing workflow.
→ Create a Tableau marketing dashboard on Mokkup
3 Mistakes That Kill Tableau Marketing Dashboards Before They're Built
1. Blending data sources before locking the primary KPI: Tableau's data blending works off a primary source anchor, whichever source holds your "hero" metric. If a stakeholder decides mid-build that ROAS should replace sessions as the lead metric, and ROAS lives in a different source than the one you anchored to, the entire blend logic breaks. This is true whether you're starting from a Tableau marketing dashboard template or building from scratch. Thus, settle on the single most important metric and which source owns it before you touch Tableau.
2. Embedding business logic inside Tableau calculated fields: Marketing definitions change constantly. Thus, what counts as an MQL, how attribution windows are set, and which campaigns qualify as "brand." When that logic lives inside a Tableau calculated field (e.g., IF [Source] = "organic" AND [Score] > 80 THEN "MQL"), every future definition change means hunting down every field that references it and editing manually. Put those definitions in your data source instead to have an easy fix.
3. Designing for the demo, not the filter state: Most Tableau marketing KPI dashboards look sharp in their default view and fall apart the moment a user applies three filters simultaneously. What gets demoed to leadership and what gets used daily are two different dashboards unless you explicitly test every major filter combination during the design phase.
Explore All 48+ Free Tableau Marketing Dashboard Templates
The eight dashboards above are the most commonly requested Tableau marketing dashboard examples, but they represent a fraction of what's available. Mokkup's template library has 48+ marketing-related wireframe templates covering every Tableau marketing use case: digital marketing overviews, multi-touch attribution, email performance, social media analytics, content marketing, funnel analysis, marketing mix modeling, paid media, and more.
Unlike static .twbx downloads you'd find elsewhere online that require a developer to reverse-engineer the layout into Tableau from scratch, Mokkup templates export with the semantic layer included. Teams skip the manual field-replacement step that typically stretches a dashboard project from days into weeks, and go straight from the exported file to connecting the live data source.
That's the difference that matters for teams with deadlines. Just connect the real data, validate the output, and publish.
→ Browse all 48+ Tableau marketing dashboard templates
Conclusion
The trick to going through multiple Tableau marketing dashboard examples and selecting the right one depends on two things: who's reading it and what question it needs to answer. While it doesn’t need to be a 100% match of your requirements, the closer the match, the fewer edits are required. While most Tableau Marketing dashboard templates are not editable, the eight examples in this guide, along with all 48+ templates, are editable before they are ready to export.
Unlike static .twbx files, every Mokkup Tableau export can include the semantic layer with calculated fields and formulas pre-built, so teams go from wireframe to live without the manual rebuild step.

Frequently Asked Questions
Marketers use Tableau to build interactive dashboards that track campaign performance, KPIs, spend, and attribution. A Tableau marketing dashboard pulls data from multiple sources into one clear, actionable view.
A well-structured Tableau marketing dashboard should include five to seven KPIs as per the needs of the team that would be using it. Some of the most common KPIs seen in marketing dashboards are total spend, ROAS, CTR, cost per conversion, and MQL volume.
The fastest path is wireframe-first: map out KPI placement and get layout approved from your stakeholder before opening Tableau Desktop. Mokkup's free Tableau marketing dashboard templates give you a pre-built starting layout you can customize and export directly to Tableau.
The five KPIs that appear in every marketing dashboard are: total spend, ROAS, cost per conversion, MQL volume, and channel contribution to revenue.
You can get a free marketing analytics dashboard Tableau supports on Mokkup.ai. It offers templates that you can open in your browser, customize with AI, and export to Tableau in one click.
Yes. Tableau handles complex, multi-source marketing data well. Pair it with Mokkup to wireframe your dashboard layout before building, to get a smooth flow
You can use Tableau's native Google Ads connector or export to Google Sheets. Mokkup's Convo AI reads your column headers to auto-build the layout first.
A marketing dashboard is interactive and can be filtered by date, channel, and region. A report is a static snapshot you share once.
Yes, but data is publicly visible. Best for showcasing Tableau marketing dashboard examples, not for dashboards with spend, revenue, or client data.
Between 5-7 KPIs per view is considered ideal. More than that, and your Tableau marketing KPI dashboard becomes a data dump, not a decision tool.
Yes. Start with a Mokkup template, wireframe your layout using Convo AI, then export directly to Tableau. It requires no coding or SQL.
Prompt it. Wireframe it with Mokkup.ai.
