What is an Email Campaign Performance Dashboard?
An Email Campaign Performance Dashboard is a centralized tool that gives marketing and communications teams real-time visibility on delivery, open rates, engagement, and clicks. Tracking key KPIs such as total emails sent, open rate, CTR, and bounce rate helps identify issues, measure impact, and optimize targeting. Beyond vanity metrics, it delivers actionable insights to refine subject lines, content, and audience segmentation—ultimately maximizing ROI.
How to Create an Email Campaign Performance Dashboard
If you want to avoid building a reporting solution from scratch, you can use pre-designed templates to launch quickly. Here’s a simple way to set up your campaign performance dashboard for marketers:
Step 1: Create or Log in to Your Mokkup Account
Sign up at Mokkup.ai using your email, or log in if you already have an account.
Step 2: Choose and Customize Your Dashboard Template
Select the Email Campaign Performance Template from the Templates section. Use the drag-and-drop editor to add KPIs, filters, or visuals relevant to your marketing data.
Step 3: Export to BI Tools
Once your design is complete, export it directly to Power BI or Tableau. You can also export as PDF, PNG, or JPEG for presentations or embed the dashboard into internal marketing platforms.
Note: This is a Pro template. You’ll need a Pro subscription on Mokkup to use and customize this dashboard wireframe. Upgrade anytime to unlock full access.
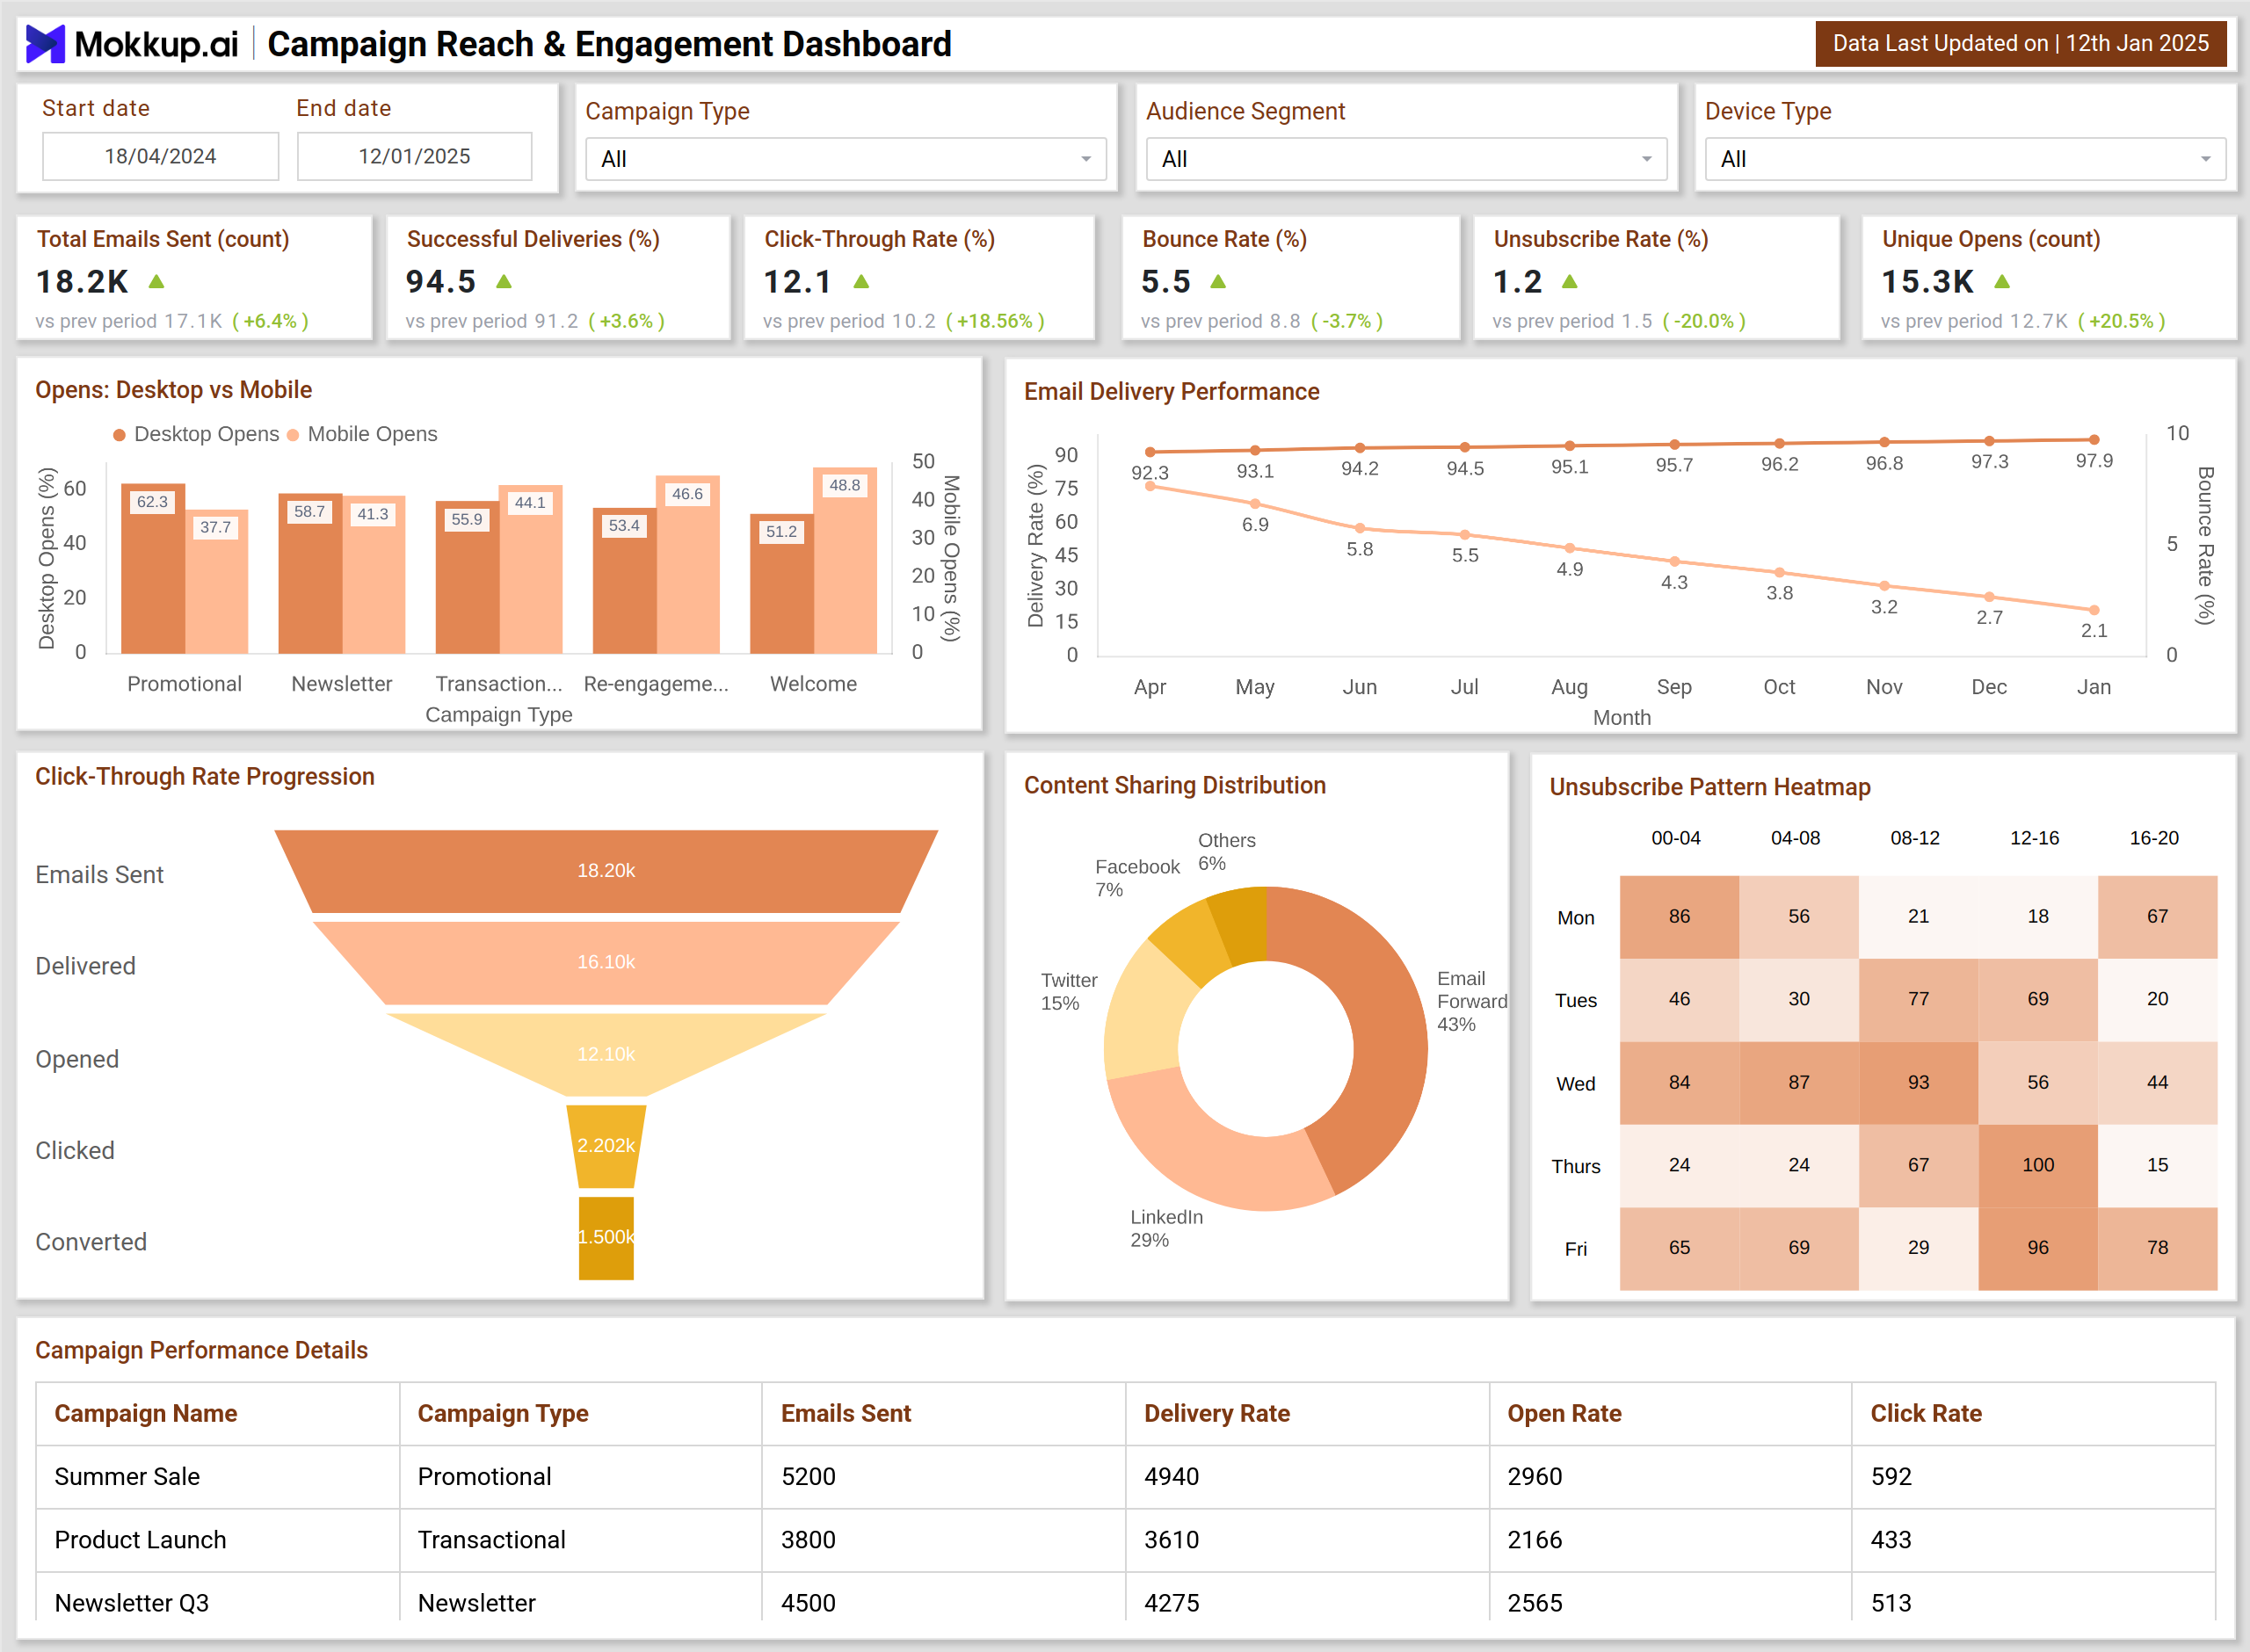
Email Campaign Performance Dashboard Example
Create your personalized email marketing dashboard to monitor all essential campaign metrics in one structured layout. The Email Campaign Performance Dashboard Template includes visualizations such as Open Rate Trends, Click-Through Rate Comparison, Bounce Rate Analysis, Unsubscribe Monitoring, Conversion Funnel, and Campaign Performance by Device or Geography. The dashboard can be adapted to match specific reporting needs with filter options for date, campaign type, and audience segment.
Once populated with campaign data, the dashboard can be exported to BI tools like Power BI or Tableau for deeper insights, making it a practical solution for improving email strategy, audience engagement, and ROI.
How to Analyze Data in Email Campaign Dashboards
An effective email marketing performance and ROI analytics dashboard makes campaign analysis interactive and actionable:
- Track Engagement Trends: Monitor open rate and CTR changes over time.
- Identify Content Effectiveness: Compare which content types (e.g., promotions vs. newsletters) perform best.
- Analyze Audience Segments: Drill down by department, client segment, or region.
- Detect Delivery Issues: Use bounce rate metrics to spot technical or targeting problems.
- Optimize Click Behavior: Evaluate CTOR and CTR to improve calls-to-action.
This enables marketing teams to continuously refine subject lines, send timing, and content strategy.
Benefits of Email Campaign Performance Dashboards
Implementing a dashboard to measure email campaign effectiveness provides multiple advantages:
- Centralized Monitoring: One place to track delivery, engagement, and performance.
- ROI Optimization: Insights to boost CTR and conversions.
- Audience Targeting: Better segmentation through engagement analysis.
- Delivery Health Tracking: Detect high bounce rates early.
- Faster Decisions: Executive-level summaries for quick campaign adjustments.
KPIs to Track in Email Campaign Dashboards
The most important KPIs to measure include:
- Total Emails Sent: Measures overall campaign volume and audience reach.
- Successful Deliveries (%): Shows how many emails actually reached inboxes, helping measure list quality and deliverability.
- Unique Opens (%): Tracks how many recipients opened the email, giving a direct measure of subject line and timing effectiveness.
- Click-Through Rate (CTR %): Indicates how many recipients clicked links, showing real engagement with content.
- Conversion Rate (%): This measure reflects campaign effectiveness by counting the number of recipients who completed a desired action (e.g., purchase, or signup).
- Revenue per Email (RPE): Reveals campaign efficiency by tracking how much revenue each delivered email generated.
- List Growth Rate (%): Evaluates long-term impact by measuring net growth in subscribers over time.
Frequently Asked Questions
1. How do you analyze data in an Email Campaign Dashboard?
In Mokkup, enter your campaign data and review KPIs such as open rates, CTR, bounces, and conversions. Use filters for audience segment, campaign type, or time frame to gain targeted insights. Export the dashboard to BI tools for advanced analytics.
2. Which KPIs are most important in email performance tracking?
The core KPIs include open rate, click-through rate, bounce rate, unsubscribe rate, and conversions, as they show both engagement and ROI impact.