Most marketing dashboards have the same problem: too many metrics, not enough clarity. Marketers either end up tracking 40 numbers because they're not sure which 5 actually matter, or they download a generic template built for a different type of business entirely and wonder why it never quite fits.
The truth is, an e-commerce brand, a SaaS company, and a marketing agency all need dashboards. But they shouldn't look anything alike. Your business model, your goals, your decision cadence, they're different. Your dashboard should be too.
This guide breaks down marketing dashboards by use case. Whether you run an online store, a software product, a client-facing agency, or an early-stage startup, you'll find the right KPIs, the right dashboard structure, and a ready-to-use template for your specific situation. No generic lists. No metrics that don't connect to decisions.
If you are just getting started, check out our guide on building your first marketing dashboard before diving into use case specifics.
Table of Contents
- Why One Marketing Dashboard Doesn't Fit Every Business
- How to Choose the Right Dashboard for Your Business
- Building Your Dashboard: Tools and Next Steps
Why One Marketing Dashboard Doesn't Fit Every Business
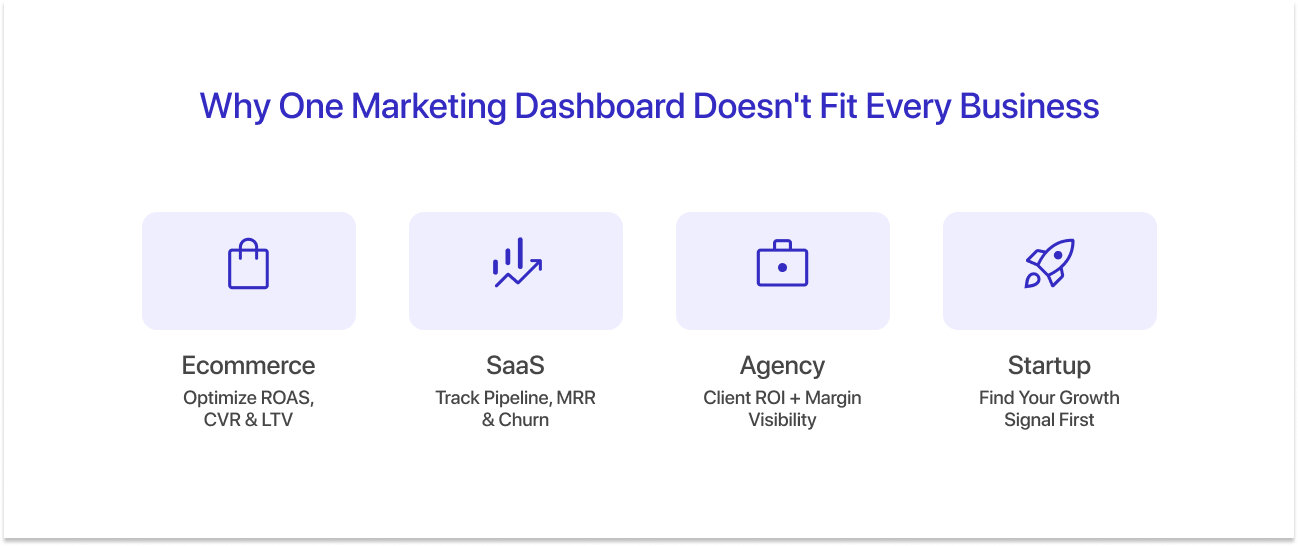
The appeal of a universal marketing dashboard is obvious. One place, all your data, clean and organized. But that appeal collapses quickly when you try to build one that actually drives decisions.
Every business type is optimizing for something different:
- E-commerce Brands: Live and die by revenue per visitor and ROAS. Every day, the question is: which channel is producing the best return, and should I shift budget?
- SaaS Companies: Optimize for pipeline velocity and churn. A good week isn't just traffic. It's MQLs converting to SQLs and expansion revenue trending up.
- Marketing Agencies: Are playing a different game entirely: client retention, margin, and whether the team is profitable on each engagement.
- Startups: At early stage aren't trying to track everything. The goal is to find the three metrics that prove the model works before you run out of runway.
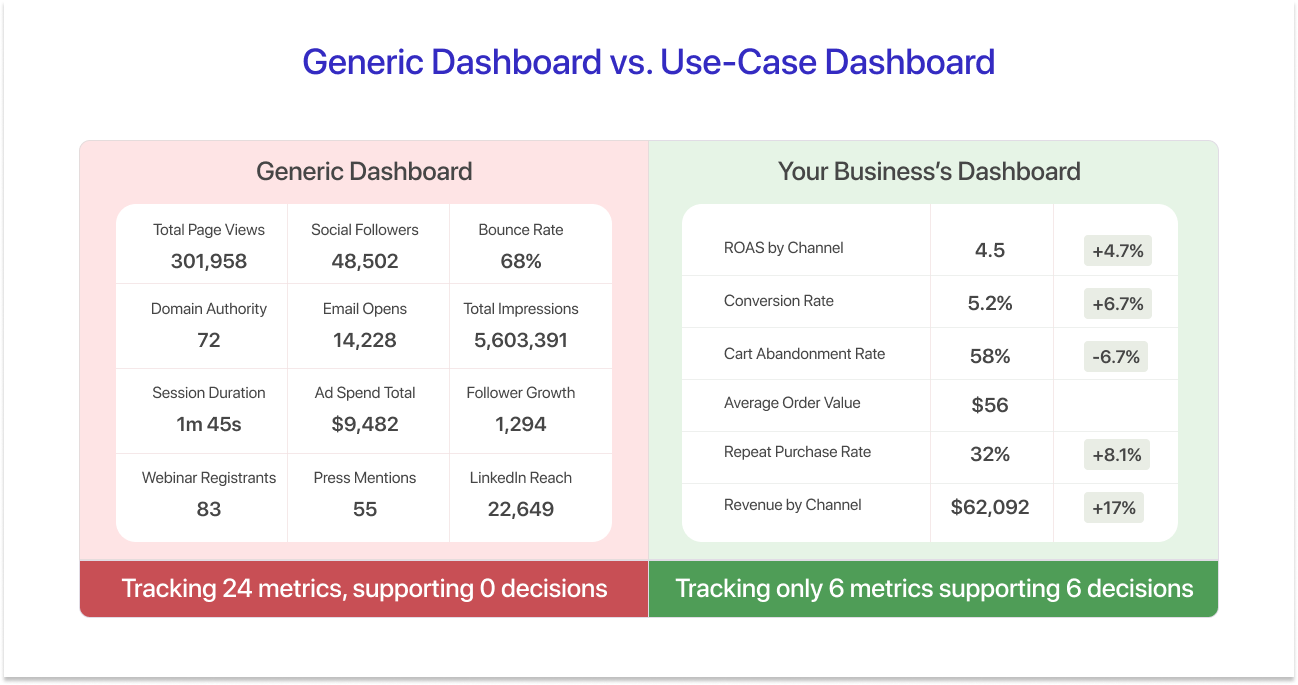
Forcing any of these businesses into a generic marketing dashboard template means tracking metrics that don't connect to your actual decisions and missing the ones that do. The best way to know whether a metric belongs on your dashboard is to ask one question: what decision does this number support? If the answer is unclear, the metric doesn't belong there.
For a deeper look, read our guide on what essential metrics actually belong on a marketing dashboard.

E-commerce Marketing Dashboard:
A marketing dashboard for an online store has one job: show you where revenue is coming from and where it is leaking. Whether you run a DTC brand or a marketplace, the metrics underneath should be the same regardless of whether you call it an ecommerce KPI dashboard or an ecommerce analytics dashboard template.
1. Business Goal for This Dashboard:
Optimize the customer acquisition and revenue engine. Reduce CAC, improve ROAS, and increase repeat purchase rate. Every number on this dashboard should tie back to one of those three levers.
2. KPIs to Track:
Acquisition:
- ROAS by channel (Google, Meta, email, organic)
- CPC and CPM trends
- Traffic by source/medium
Conversion:
- Conversion rate (overall + by channel)
- Cart abandonment rate
- Average order value (AOV)
Retention:
- Repeat purchase rate
- Customer lifetime value (LTV)
- Email revenue contribution
Revenue:
- Revenue by channel
- Revenue by product category
- MoM and YoY growth
3. Decision Insights This Dashboard Should Surface:
- Which channel has the best ROAS this week, and should I shift budget?
- Is my AOV trending down, and is that a product or campaign issue?
- Which customer cohort has the highest LTV, and am I acquiring more of them?
4. What to Exclude:
Vanity metrics: total impressions, social followers, raw traffic without conversion context. These numbers can look impressive in a slide deck and mean nothing for a budget decision on a Monday morning.
5. Dashboard Layout Suggestion:
- Top Row: Revenue, ROAS, CVR — the three "stop the meeting" numbers.
- Second Row: channel breakdown.
- Third Row: product performance and repeat purchase trend.
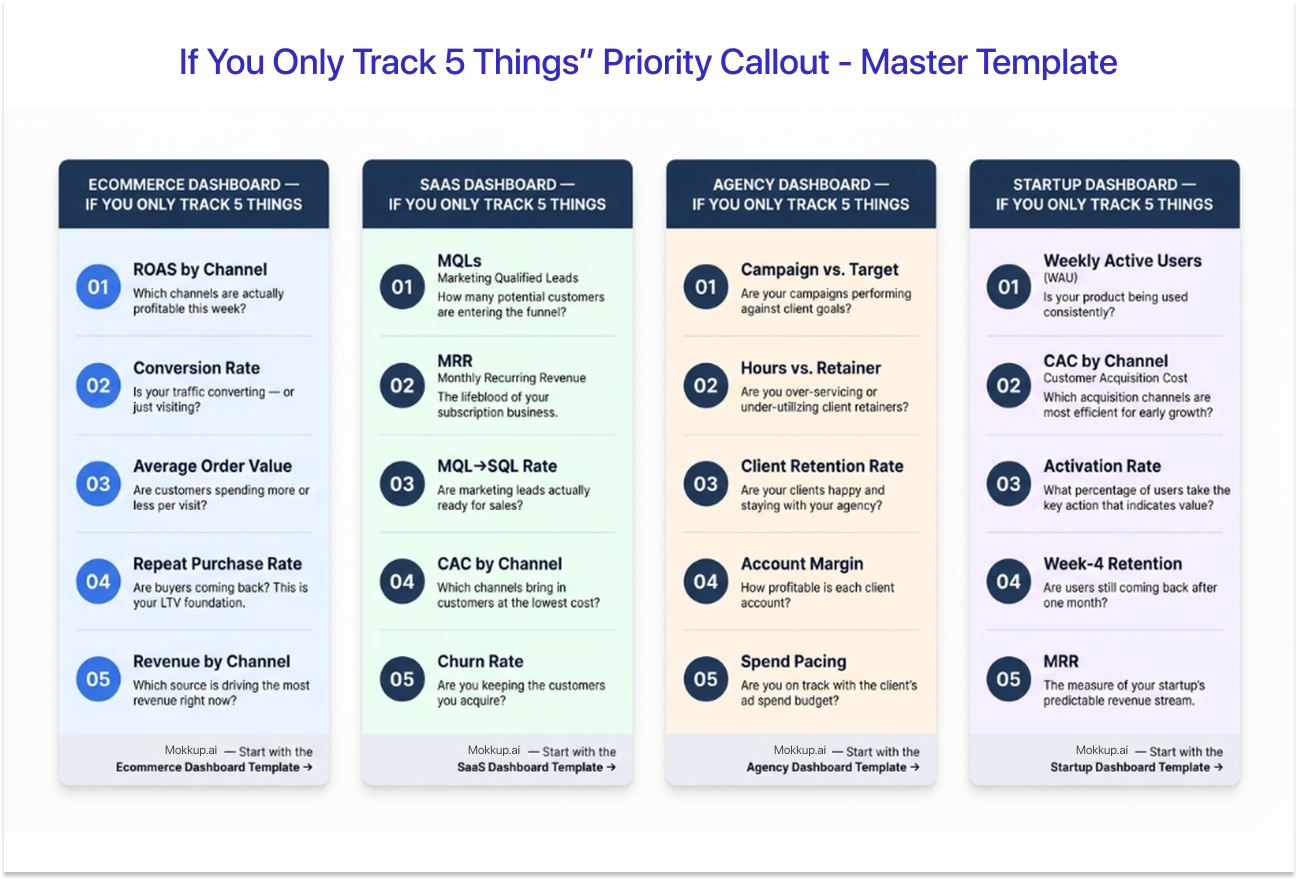
If your dashboard only has room for 5 metrics, make them these:
- ROAS by channel
- Conversion rate
- Average order value (AOV)
- Repeat purchase rate
- Revenue by channel
Use our ready-built E-commerce Marketing Dashboard template.
SaaS Marketing Dashboard:
You market a software product, B2B or B2C SaaS. Your marketing goal is to fill a pipeline, reduce time-to-close, and keep churn low enough that growth compounds.
1. Business Goal for This Dashboard:
Align marketing to the revenue pipeline. The dashboard shouldn't stop at traffic or MQLs; it should connect top-of-funnel spend all the way to closed-won revenue and expansion.
2. KPIs to Track:
Pipeline:
- MQLs generated by channels
- MQL→SQL conversion rate
- Pipeline created by marketing ($)
Acquisition:
- CAC by channel
- Trial/demo sign-up rate
- Organic vs paid traffic split
Retention / Revenue:
- MRR and MRR growth rate
- Churn rate (logo and revenue)
- Expansion revenue (upsell/cross-sell contribution)
Content/SEO (if relevant):
- Organic sessions → trial conversion rate
- Top converting landing pages
3. Decision Insights This Dashboard Should Surface:
- Is my MQL→SQL rate dropping — and is it a lead quality or sales handoff issue?
- Which channel produces the lowest CAC for highest LTV customers?
- Is expansion revenue growing faster than new logo revenue? (A healthy sign.)
4. B2B SaaS Note:
A B2B SaaS marketing KPIs dashboard looks different from a B2C one, and different again from a generic SaaS metrics dashboard template you'd find online. If you're B2B, add sales cycle length and influenced pipeline metrics. A deal that closes in 90 days looks fundamentally different from one that closes in 7; your attribution model needs to reflect that. Don't let a long-cycle enterprise deal get misread as a poor-performing campaign.
If your dashboard only has room for 5 metrics, make them these:
- MQLs by channel
- MQL→SQL conversion rate
- CAC by channel
- MRR growth rate
- Churn rate
Use our SaaS Marketing Dashboard template.
Marketing Agency Dashboard
You manage marketing for multiple clients. Your goal is to demonstrate ROI at the client level, manage your team's capacity, and protect your margins, ideally all in the same week.
1. Business Goal for This Dashboard:
Client performance visibility plus internal operational efficiency. You need to know how each client account is performing and whether your team is actually profitable on each engagement, not just busy.
2. KPIs to Track:
Per-Client Performance:
- Campaign performance vs. target (by client)
- Spend pacing (actual vs. budget)
- Channel-level ROAS or CPL by client
Agency Operations:
- Hours logged per client vs. retainer scope
- Client retention rate
- Revenue per client and MoM change
Reporting:
- Report delivery rate (on-time %)
- Client NPS or feedback score (if tracked)
3. Decision Insights This Dashboard Should Surface:
- Which client accounts are at risk, underperforming vs. targets?
- Which accounts are over-serviced relative to retainer value?
- Is the team's capacity aligned with revenue, or are we busy but not profitable?
4. Two Dashboard Layers for Agencies:
A client reporting dashboard for agencies isn't the same as an internal ops view, and an agency marketing report template built for a freelancer won't serve a 20-person team managing 10 accounts. Agencies typically need two distinct views, and collapsing them into one is a common mistake.
- The first is a client-facing dashboard: Campaign results, spend pacing, and channel performance — what your client sees in their monthly review.
- The second is an internal operations dashboard: Margin, capacity utilisation, and account health — what your leadership team uses to run the business. Mixing them creates a dashboard that serves neither audience well.
If your dashboard only has room for 5 metrics, make them these:
- Campaign performance vs. target (by client)
- Spend pacing (actual vs. budget)
- Hours logged vs. retainer scope
- Client retention rate
- Revenue per client MoM
Startup Marketing Dashboard
You're pre-Series B, resource-constrained, and still validating your growth model. Whether you're building a growth metrics dashboard for a startup or a marketing dashboard for a small business just finding its footing, the principle is the same: your goal isn't to track everything, it's to track the 5 things that tell you whether your acquisition model is working before you double down on any channel.
1. Business Goal for This Dashboard:
Find signal in noise. Identify which growth channels are working before you scale spend on any of them. A startup dashboard isn't about comprehensiveness, it's about conviction.
2. KPIs to Track (Lean Priority Set):
Core 5 for Early Stage:
- Weekly active users or signups (your North Star metric)
- CAC by channel (even rough estimates count)
- Activation rate (new user → first value moment)
- Week 1 / Week 4 retention
- Revenue or MRR (if monetized)
Add when you have the data:
- Organic vs. paid traffic split
- Content-to-signup conversion rate
- Referral/word-of-mouth contribution
3. Decision Insights This Dashboard Should Surface:
- Is any single channel producing CAC low enough to scale?
- Is my activation rate improving, or is the product onboarding leaking?
- Is week-4 retention high enough to support a paid acquisition strategy?
4. What Startups Get Wrong
Tracking brand awareness metrics, impressions, followers, PR mentions before product-market fit is confirmed. These numbers feel productive to report and tell you almost nothing about whether your business is working. A startup dashboard should be ruthlessly focused on acquisition and retention signal. Reach metrics can wait until you've proven the model.
If your dashboard only has room for 5 metrics, make them these:
- Weekly signups or active users
- CAC by channel
- Activation rate
- Week 4 retention
- MRR (or engagement depth if pre-revenue)
If you're not sure where the gaps in your current reporting are, start with understanding where your marketing reporting gaps are.
How to Choose the Right Dashboard for Your Business
If you read through the sections above and landed clearly in one category, you're good to go. Choosing the right marketing dashboard by use case is the most important decision you'll make before building; it determines which metrics you track, how you structure your layout, and which template gives you the fastest start. But plenty of businesses straddle multiple use cases; a SaaS startup that's also running content like a media company, or an ecommerce brand that's added a subscription tier. Here's a simple framework to cut through the ambiguity.
|
If You Are |
Primary Focus |
Start With |
|
DTC / ecommerce brand |
Revenue and ROAS |
E-commerce template |
|
B2B or B2C SaaS |
Pipeline and churn |
SaaS template |
|
Marketing agency |
Client performance + ops |
Agency template |
|
Pre-Series B startup |
Growth signal |
Startup template |
|
Early ecommerce + subscription |
Revenue and retention |
E-commerce + retention overlay |
If your business model has evolved, you started as an agency but now have a SaaS product, or you're a startup with an e-commerce component, you may need a hybrid dashboard. [See Marketing Dashboard Examples + Templates] for hybrid examples.
Building Your Dashboard: Tools and Next Steps
Mokkup.ai gives you a library of use case-specific dashboard templates you can customise and use without starting from scratch. Whether you are building an e-commerce KPI dashboard, a SaaS metrics dashboard, or a client reporting dashboard for your agency, each template is designed around the metrics that actually matter for that business type.
- Pick Your Use-Case Template: Start with the one that matches your business model above — don't start from a blank canvas if you don't have to.
- Customise the KPI Set: Every business has nuances. Swap out any metrics that don't connect to decisions your team actually makes.
- Connect Your Data Sources: Your dashboard is only as useful as the data feeding it. Prioritise the two or three sources that account for most of your marketing activity.
- Set a Review Cadence: Operational metrics (ROAS, CVR, MQLs) belong in a weekly review. Strategic metrics (LTV, churn, pipeline trends) belong in a monthly review. Don't treat them the same.
For a full walkthrough of the setup process, the [step-by-step guide to building your marketing dashboard] covers data source connections, layout best practices, and how to structure your review meetings around dashboard outputs.
Explore all marketing dashboard templates.
Conclusion
The best marketing dashboard isn't the one with the most metrics; it's the one built for your business model. An e-commerce brand, a SaaS company, a marketing agency, and a startup are all measuring marketing performance, but they're asking fundamentally different questions. Your dashboard should reflect that. Start with the use case that fits your business, customise the KPI set to match your specific goals, and treat your dashboard as a living tool; it should evolve as your business does. The metrics that matter at $100K ARR are not the same ones that matter at $10M.
Frequently Asked Questions
A marketing dashboard should include only the metrics that directly support business decisions. That typically means acquisition metrics (traffic, CAC, leads), conversion metrics (CVR, AOV, demo rate), and retention or revenue metrics (LTV, MRR, churn). The exact mix depends on your business model; an e-commerce brand needs different KPIs than a SaaS company or a startup. A good rule of thumb: if a metric doesn't answer a question your team acts on, it doesn't belong on the dashboard.
An e-commerce dashboard is built around the revenue and ROAS loop; it answers questions like "which channel is driving the best return, and is my conversion rate holding?" A SaaS marketing dashboard is built around the pipeline and retention model; it tracks MQLs, MQL→SQL conversion, CAC, MRR, and churn. The core difference is business model: e-commerce optimises for transaction volume and product margin, while SaaS optimises for recurring revenue and low churn. They share some acquisition metrics but diverge sharply on conversion and revenue tracking.
Start with five metrics: signups or weekly active users, CAC by channel, activation rate, week-4 retention, and MRR (or a proxy if you're pre-revenue). Resist the urge to track brand awareness metrics like impressions or social followers before you've confirmed product-market fit. A startup dashboard should surface signals, which channels are working, whether onboarding is converting, and whether retention is strong enough to justify scaling spend. Add complexity only when your data matures and your model is validated.
Agencies need two sets of KPIs. For client-facing reporting: campaign performance vs. target, spend pacing, and channel-level ROAS or CPL by client. For internal operations: hours logged per client vs. retainer scope, client retention rate, revenue per client, and margin. The mistake most agencies make is collapsing these into a single dashboard, which means clients see internal ops data they shouldn't, and leadership loses visibility into profitability. Keep them as two separate views built from the same underlying data.
It depends on the metric. Operational metrics, ROAS, conversion rate, spend pacing, and MQLs should be reviewed weekly, ideally connected to live data sources so they update automatically. Strategic metrics, LTV, churn rate, pipeline trends, and retention curves are better suited to monthly reviews where you have enough data to see meaningful movement. The bigger risk is over-reviewing: checking acquisition numbers daily when your campaign budget doesn't shift that fast creates noise, not insight. Match your review cadence to your decision cadence.
Prompt it. Wireframe it with Mokkup.ai.
