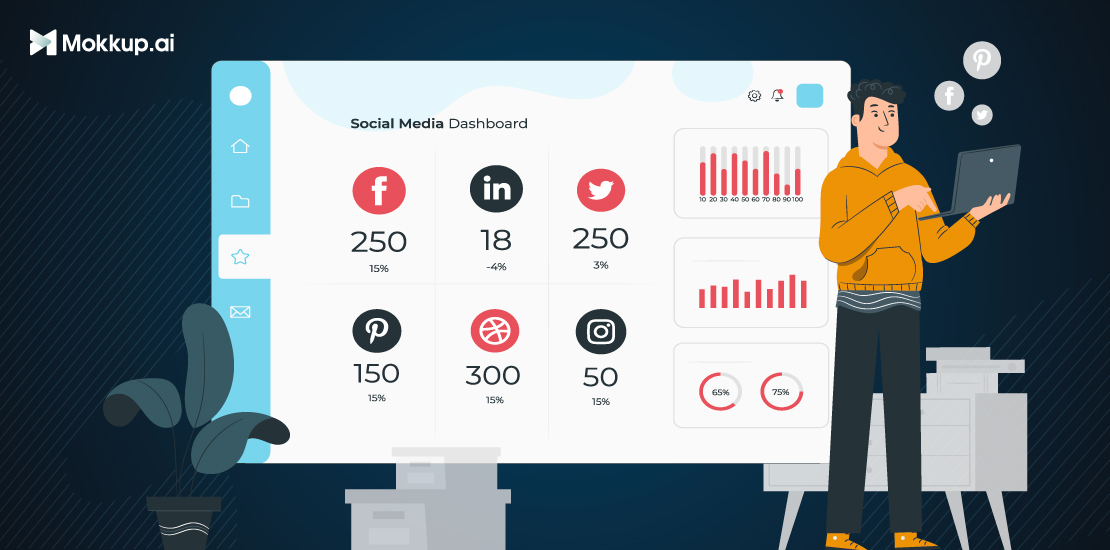
What is a Social Media Dashboard?
A social media dashboard is a tool that combines important metrics from your social media accounts. It helps you track how well your posts, campaigns, customer service interactions, and community engagement are performing. A social media dashboard lets you analyze results and adjust your strategy. It shows the impact of your efforts and helps guide important decisions.
The best social media dashboards track trending content and analyze results across different platforms. They also let you manage ad campaigns and monitor popular posts. This blog will cover the basics of social media dashboards and how they can help you save time and manage social media more efficiently.
The Role of a Social Media Manager
A social media manager is responsible for overseeing a brand's online presence across various social media platforms. Their main responsibilities include:
- Developing Content Strategy: Crafting engaging and relevant content that resonates with the target audience.
- Creating and Scheduling Posts: Planning and timing posts to maximize engagement.
- Engaging with Followers: Building relationships with the audience by responding to comments and messages.
- Monitoring Analytics: Tracking performance metrics to determine the effectiveness of campaigns.
Table of Contents
- Why Use a Social Media Dashboard?
- How to Create a Social Media Dashboard?
- Social Media Dashboard Examples
- Why are KPIs Crucial in Social Media Marketing?
- Tailoring Your Dashboard for Each Social Media KPI
Why Use a Social Media Dashboard?
A social media dashboard gives you a clear view of your social media performance. It helps you see what works and what doesn’t. It also enables you to track your progress over time and analyze the performance of your content. This will enable you to save money and time on your business's social media marketing.
Here are key reasons to use one:
- Efficiency: It saves time by combining analytics, engagement metrics, and post scheduling in one place.
- Make Better Decisions: You can change your strategies quickly to improve performance. This is possible when you have real-time insights from various platforms.
- Streamlined Workflow: Plan and deliver content more efficiently by managing multiple accounts without switching between apps.
- Tracking and Reporting: Easily measure campaign success, track performance, and generate reports automatically.
How to Create a Social Media Dashboard?
Social media marketing has evolved into an essential tool for businesses to reach their target audience. However, due to the large amount of data generated by social media, it can be difficult to track and analyze marketing campaigns. A social media marketing dashboard helps you organize and visualize your data, making it simple to track progress and adjust your strategy.
Furthermore, let's look at the steps to create a dashboard for social media marketing.
Step 1: Define your Objectives
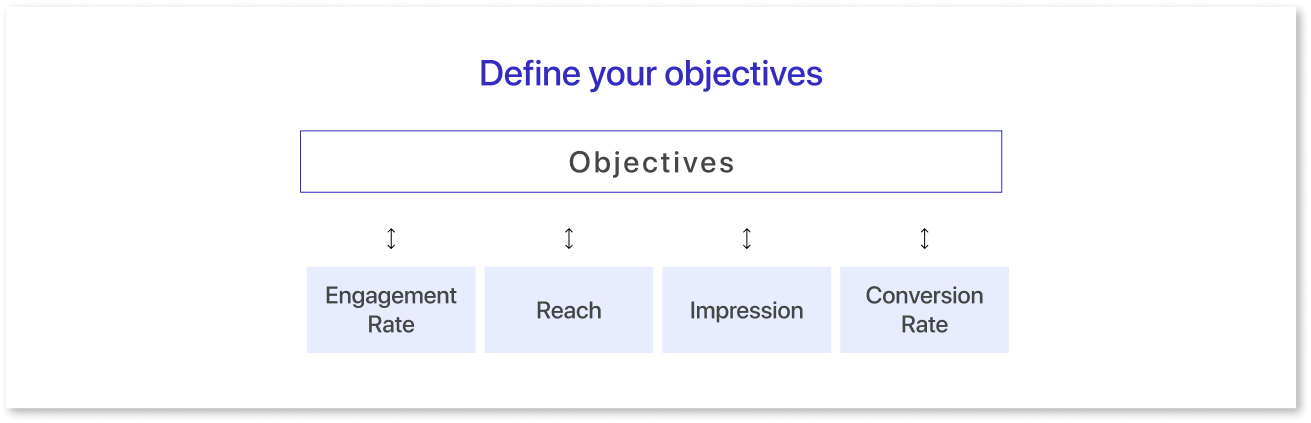
The first step in building a BI dashboard is to define your objectives. Determine what metrics are important for your social media campaign. Some common media metrics to track are engagement rate, reach, impressions, and conversion rate.
Step 2: Choose the Right Platform
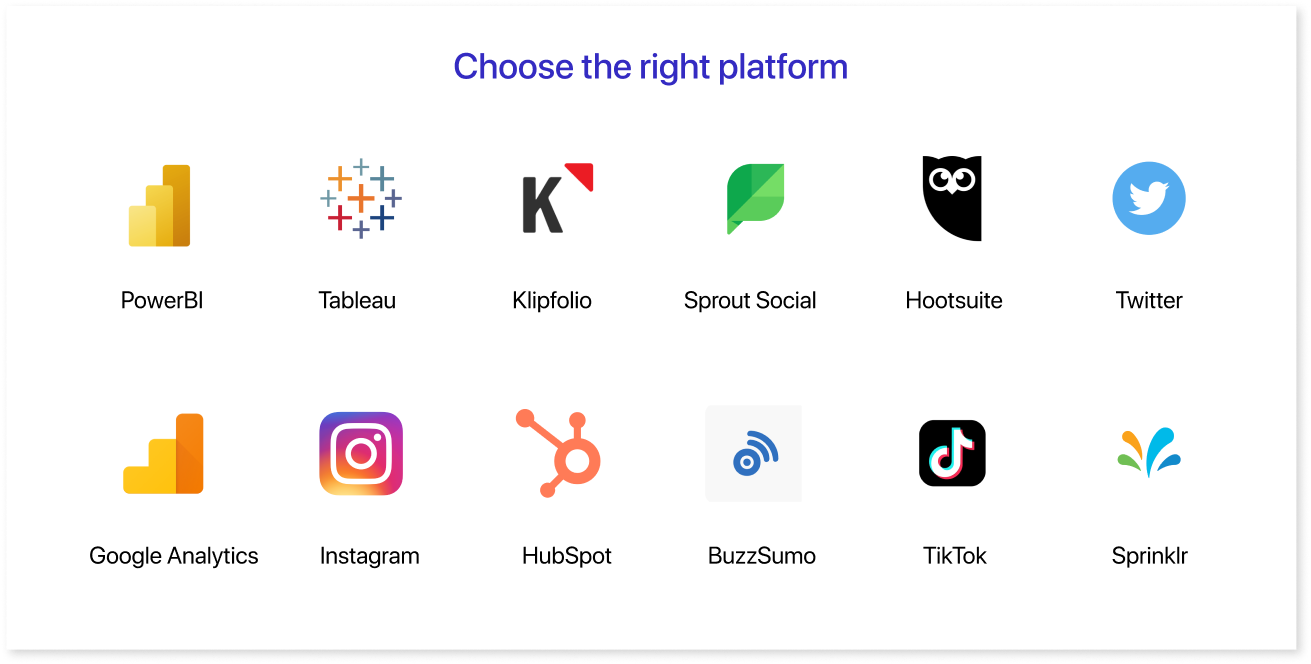
There are various social media analytics tools available in the market. Choose a tool that can provide you with the necessary metrics and is compatible with your social media platforms such as Instagram, Facebook, Twitter/X, and TikTok. For creators and marketers leveraging TikTok’s viral potential, learning how to find TikTok affiliates can further amplify monetization efforts by partnering with others to drive conversions and track performance all in one dashboard.
Step 3: Select the Key Performance Indicators (KPIs)
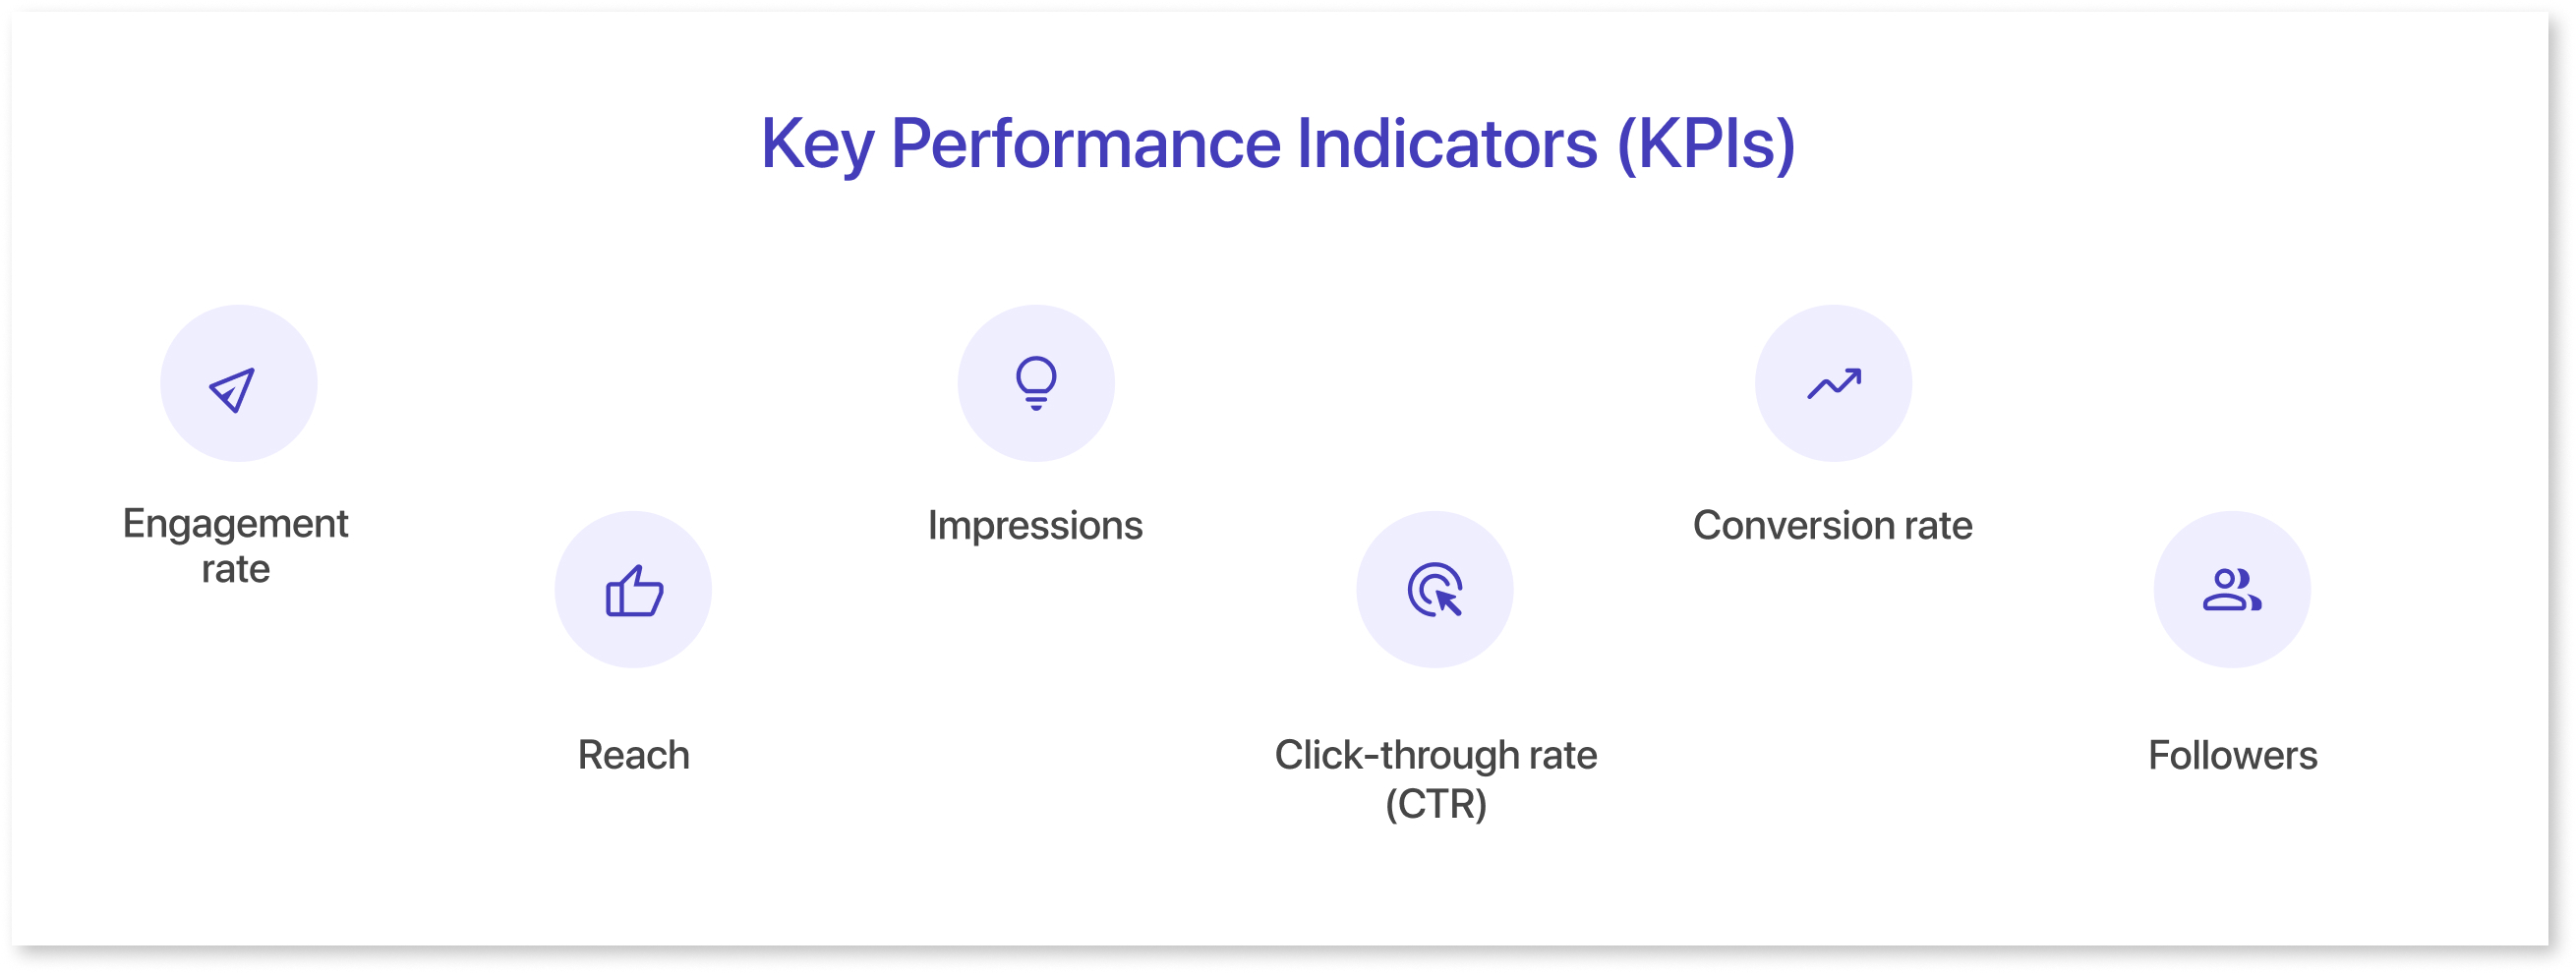
Social media Key Performance Indicators (KPIs) are metrics that help businesses measure and assess their social media success. These KPIs help businesses analyze data and understand their social media strategy. This understanding allows them to make better decisions and improve their marketing campaigns. Some of the most common social media KPIs include:
- Engagement Rate: This measures how often users interact with a piece of content. It includes likes, comments, shares, and other forms of engagement.
- Reach: This measures the number of people who have seen a piece of content. It includes both organic and paid reach.
- Impressions: Measures the number of times a piece of content has been viewed, including multiple views by the same person.
- Click-Through Rate (CTR): This metric compares the number of views on a link or CTA to the total number of impressions.
- Conversion Rate: Measures how many people take action, like making a purchase or signing up. It compares these actions to the number of clicks or impressions.
- Followers: This measures the number of people who follow a business's social media account.
Tracking these social media KPIs helps businesses better understand their performance and find areas for improvement. They can use this data to improve their social media strategy and create more engaging content, leading to more conversions and revenue.
Step 4: Wireframe your Dashboard
Mokkup helps you wireframe and design your dashboard before development, ensuring a clear and easy-to-navigate layout. By emphasizing clarity, usability, and appropriate visualizations, Mokkup ensures your dashboard effectively conveys important insights.
Once the dashboard design is complete, you can be sure it will give you a clear view of your performance. This will help you track important metrics and gain useful insights, as shown by the social media dashboard template above. This process helps you select the right visualizations for better data understanding.
Consider the following when designing your dashboard:
- User-Centric Layout: Arrange components in a way that meets user needs and priorities. Keep the most important information easy to find.
- Appropriate Visualizations: Choose the visualizations (charts, graphs, tables) that best portray your data. Use bar charts to compare data, line graphs to show trends, and pie charts to display proportions. Each type of chart has a specific purpose.
- Consistent Color Scheme: Use a cohesive color palette to improve readability and direct users' attention. Use contrasting colors to identify distinct datasets while maintaining a professional appearance.
- Interactive Elements: Add features like filters or drill-down options. This lets visitors explore the data more closely and customize their views to fit their needs.
- Clear Labels and Legends: Label all visual elements clearly and use legends to clarify data measurements. This will allow users to quickly understand what they are looking at without difficulty.
- Responsive Design: Make your dashboard adaptable, responding to different screen sizes and devices. This flexibility guarantees that users can access insights at any time and from any location.
Focusing on these design features will make your dashboard share data more clearly, boosting user engagement and understanding.
Step 5: Set up Data Sources and Automate Data Collection
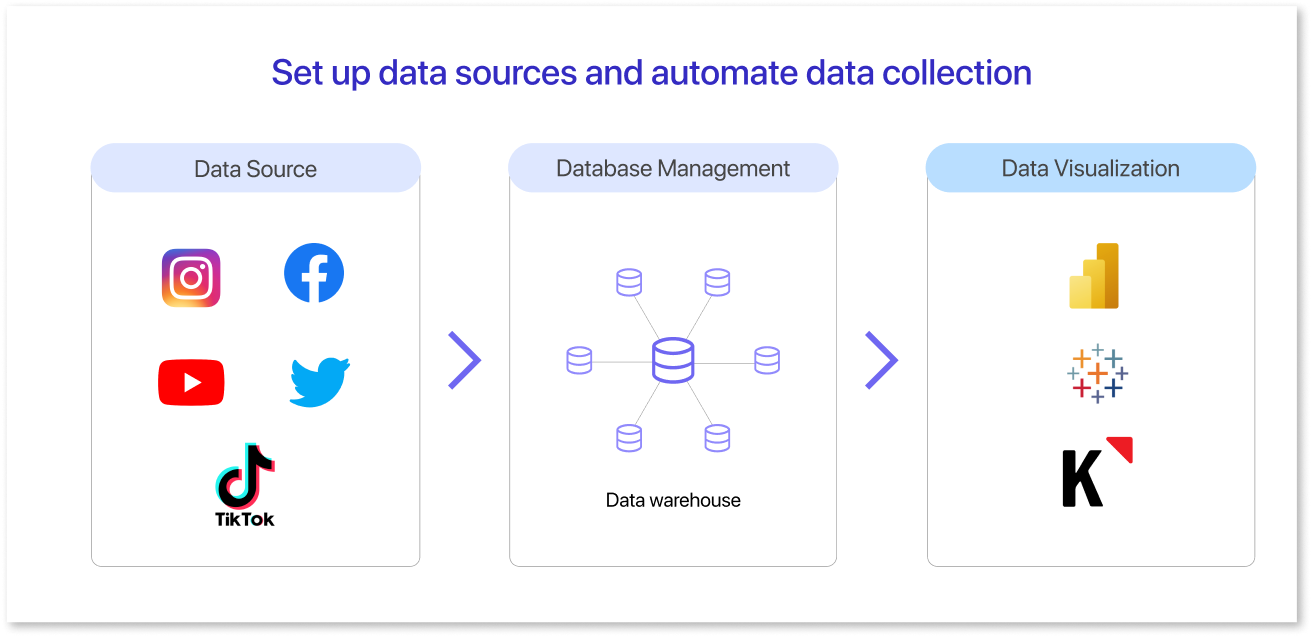
Link your social media accounts to your analytics tool using APIs. This allows for real-time data integration with tools like Power BI, Tableau, or Klipfolio. By automating data collection, your dashboard updates itself. This saves you time and lets you focus on analyzing insights instead of refreshing data.
This automation ensures accuracy and lowers the chance of errors. It also provides a steady flow of data. This helps you respond quickly to trends or changes in performance. It is critical to ensure that your dashboard contains up-to-date data in order to make informed decisions.
Step 6: Test and Refine
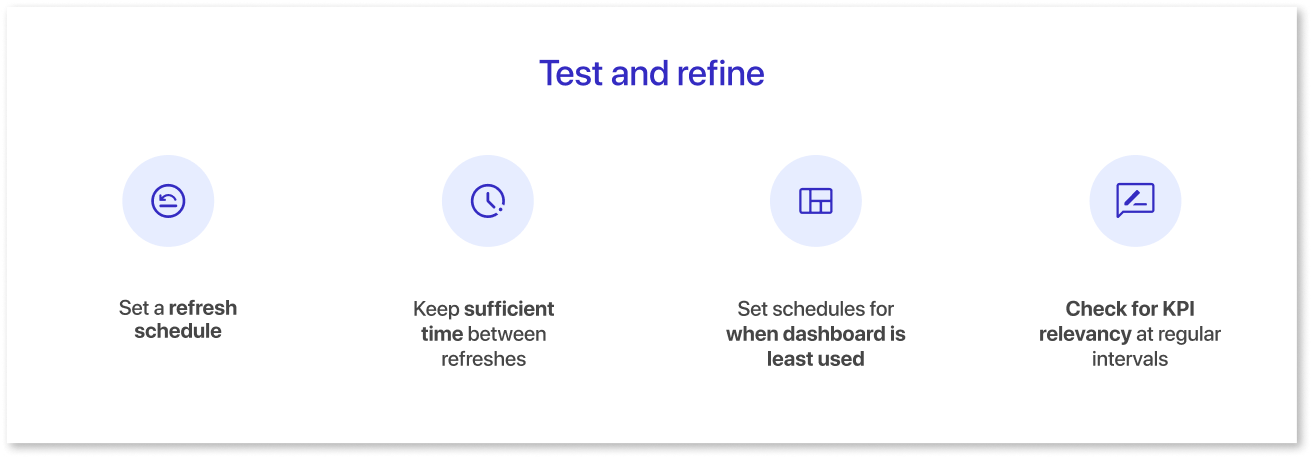
Test your dashboard and refine it based on feedback from your team or stakeholders. Make sure your dashboard is easy to understand and provides actionable insights.
- Set a Refresh Schedule: Create a frequent refresh plan to keep your data up to date. Balance frequency to minimize overload and noise.
- Allow Enough Time Between Refreshes: Give enough time between refresh periods for important data changes to happen. This will help you focus on key patterns.
- Set Schedules for When the Dashboard is Least Used: Make changes during off-peak hours. This helps avoid disruptions and keeps the dashboard available during busy times.
- Check KPI Relevancy: Regularly review tracked KPIs to make sure they match current business goals. Change them as needed for better decision-making.
Social Media Dashboard Examples
A well-structured social media reporting dashboard helps businesses track key performance metrics, optimize campaigns, and improve engagement. Below are 12-15 examples showcasing different types of dashboards and their impact on social media strategy. Each example highlights how businesses can gain insights, measure performance, and refine their approach to social media marketing.
- Engagement Dashboard: Tracks likes, shares, and comments across all platforms.
- Ad Performance Dashboard: Monitors ad spend, conversions, and ROI.
- Customer Service Dashboard: Measures response time and customer sentiment.
- Influencer Campaign Dashboard: Analyzes influencer engagement and reach.
- Platform Comparison Dashboard: Compares engagement metrics across social platforms.
- Video Performance Dashboard: Tracks views, watch time, and engagement on videos.
- Hashtag Tracking Dashboard: Analyzes trending hashtags and their impact.
- Brand Reputation Dashboard: Measures brand sentiment through mentions and comments.
- Conversion Dashboard: Tracks social-driven website traffic and purchases.
- Follower Growth Dashboard: Monitors the increase in social media followers over time.
- Content Performance Dashboard: Identifies top-performing posts and formats.
- Live Campaign Dashboard: Provides real-time insights into ongoing campaigns.
- Competitor Analysis Dashboard: Compares key social media metrics with competitors.
- Multi-Channel Analytics Dashboard: Aggregates data from various platforms.
- E-commerce Social Media Dashboard: Tracks purchases and social referrals
Why are KPIs Crucial in Social Media Marketing?
Key performance indicators (KPIs) play a crucial role in measuring the effectiveness of your social media strategy. In this article, we will discuss why KPIs are crucial in social media marketing.
1) Measure Progress Toward Objectives:
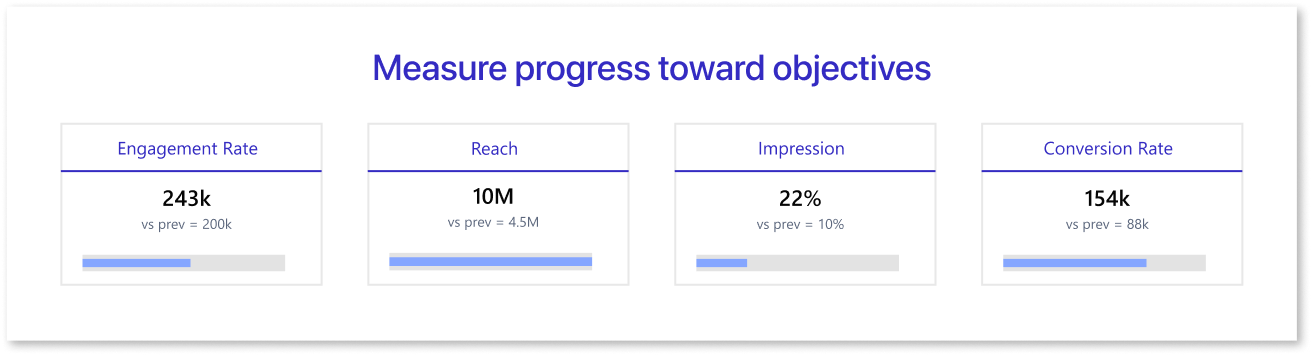
KPIs help measure progress toward objectives. Before launching a social media campaign, it is crucial to set specific and measurable objectives. KPIs help track progress toward these objectives and allow marketers to make informed decisions.
For example, if you want to increase website traffic, you can use KPIs like website clicks, referral traffic, and response rates. These metrics can help you measure your progress toward this goal.
2) Identify Strengths and Weaknesses:
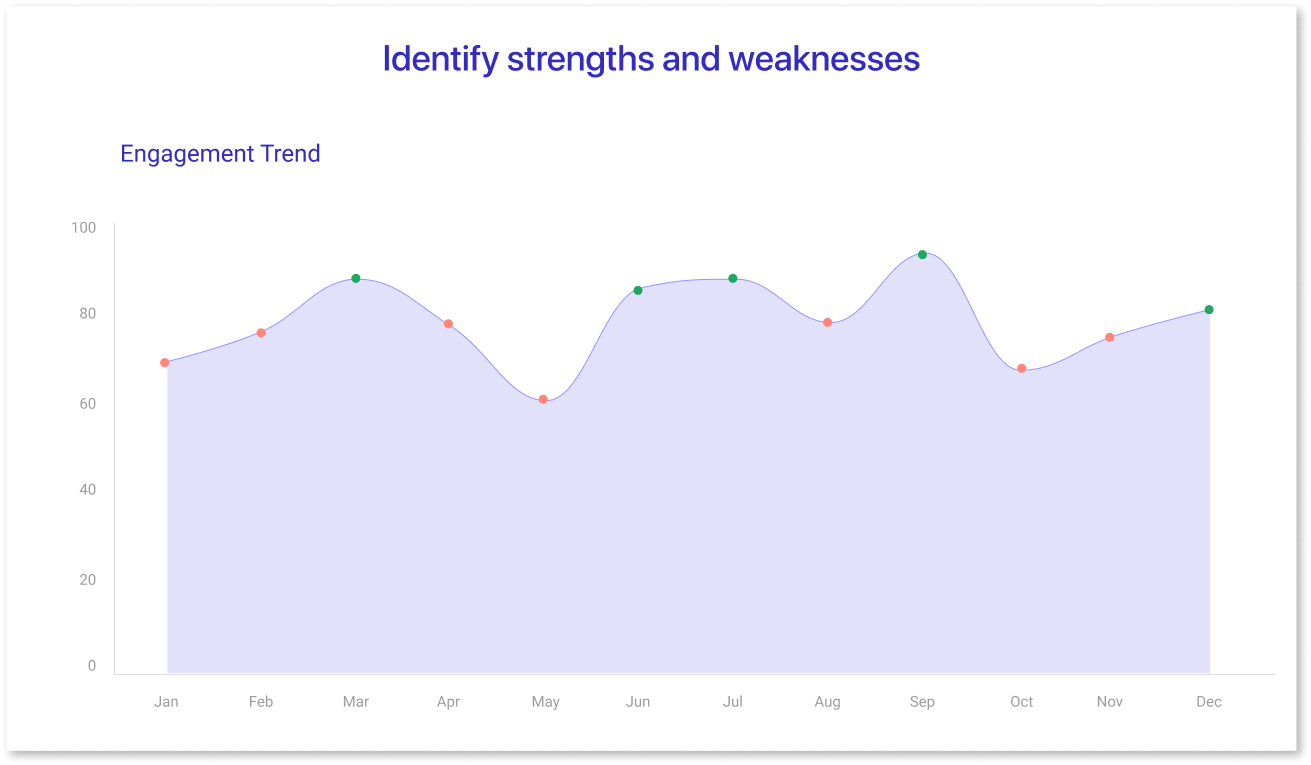
KPIs help identify strengths and weaknesses in your social media strategy. By analyzing KPIs, marketers can identify which campaigns or platforms are performing well and which ones need improvement. If a social media platform isn't getting enough engagement, there are ways to identify the issue.
Key performance indicators (KPIs) such as engagement rate and reach can be useful. They can help pinpoint the problem. This information can help marketers make data-driven decisions to optimize their social media strategy.
3) Measure ROI:
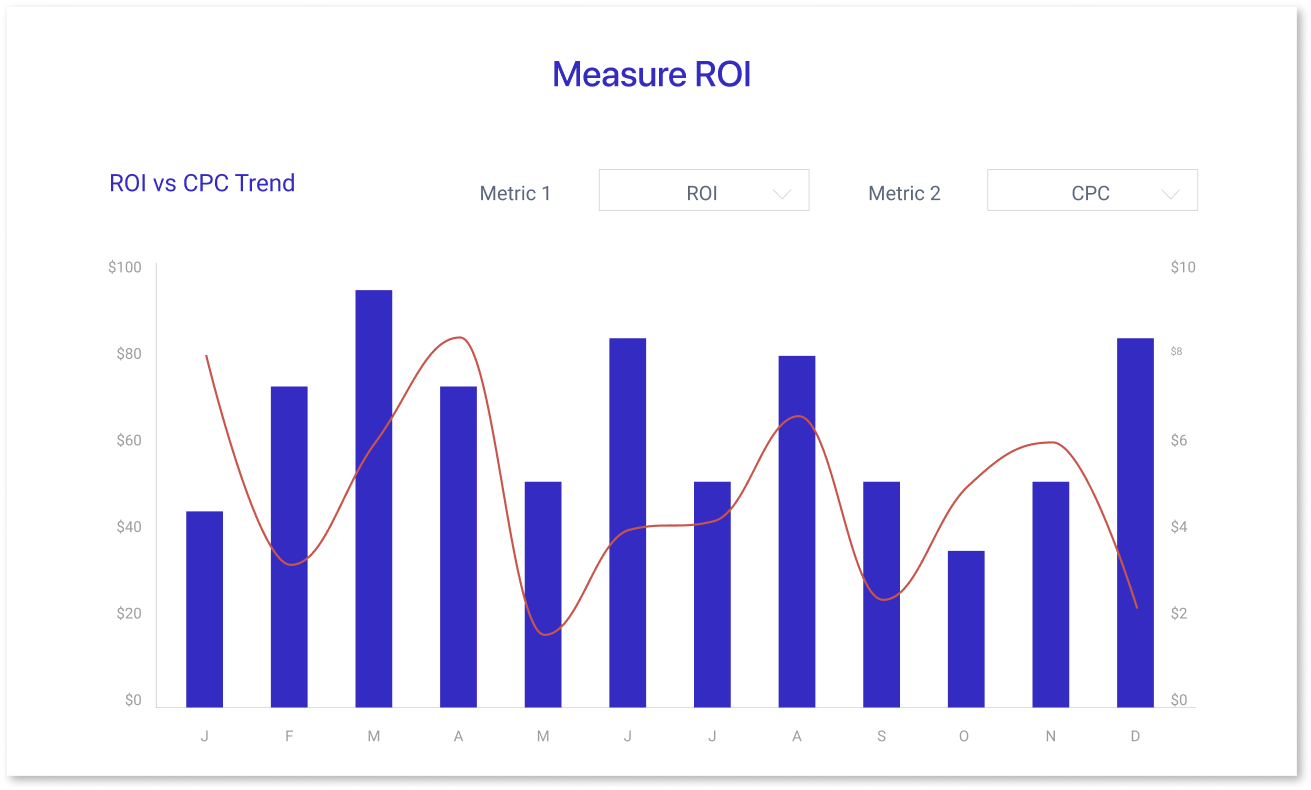
KPIs are important for measuring the return on investment (ROI) of social media marketing. This type of marketing can be a significant cost for businesses. Important metrics like cost per click (CPC), cost per impression (CPM), and cost per conversion (CPC) directly affect ROI. High costs can reduce profitability, while low costs might mean missed chances to engage with customers.
By looking at these numbers, marketers can see how well their social media campaigns are performing. They can understand their overall profits and make better choices for future spending.
4) Monitor Customer Engagement:
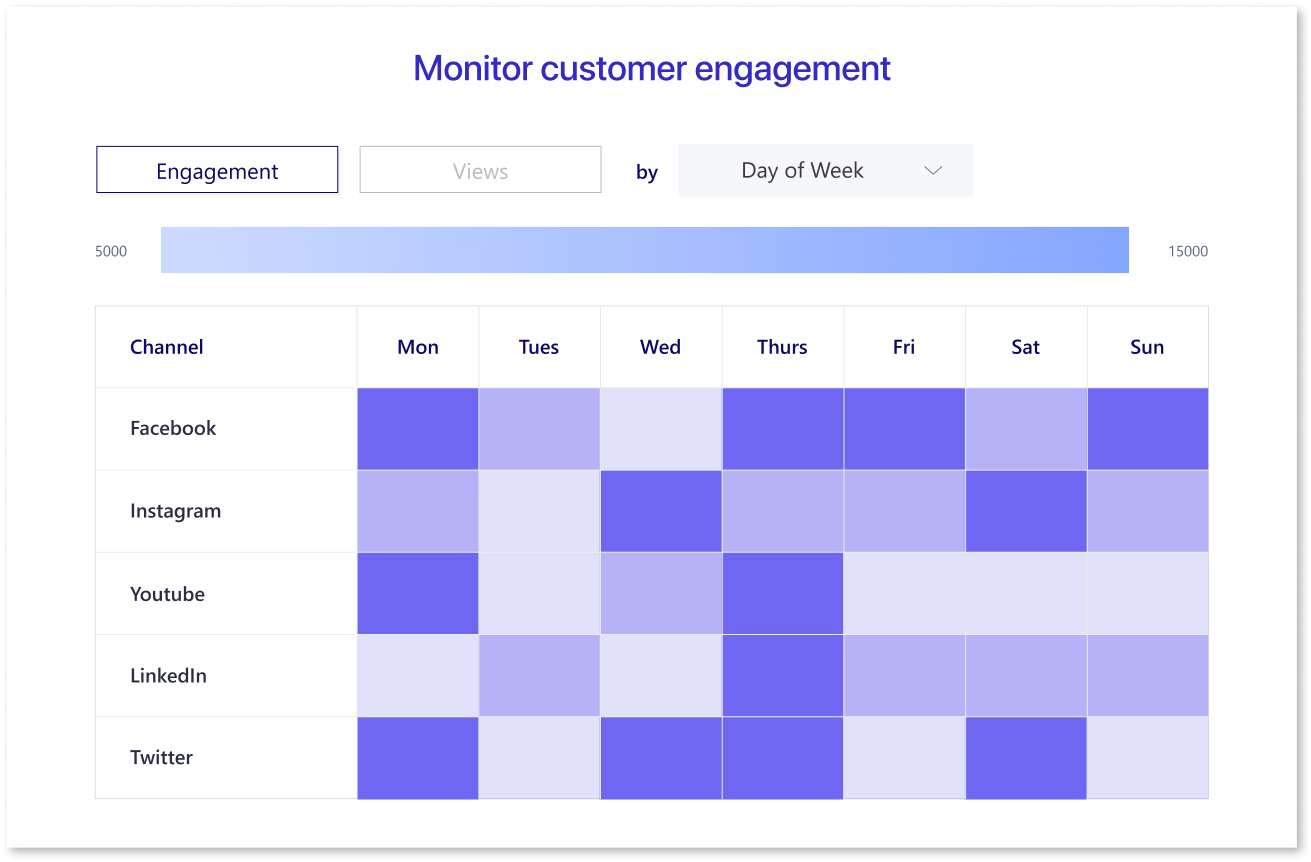
KPIs help monitor customer engagement. Social media platforms provide a unique opportunity for businesses to engage with their customers directly. KPIs such as likes, shares, comments, and mentions can help measure the level of engagement with your audience. By monitoring customer engagement, businesses can better understand their audience and create content that resonates with them.
5) Optimize Social Media Strategy:
KPIs help optimize social media strategy. By looking at KPIs, marketers can see which campaigns or platforms create the most value. They can then improve their strategy based on this information.
For example, if a certain type of content gets more engagement, marketers can make more of it. This helps maximize its effectiveness.
6) Stay Ahead of the Competition:
KPIs help businesses stay ahead of the competition. By monitoring KPIs, businesses can compare their performance to their competitors and identify areas where they can improve. For example, if a competitor gets more engagement on a platform, businesses can study their strategy. They can then make changes to stay competitive.
Tailoring Your Dashboard for Each Social Media KPI
Follow these simple steps to create a social media dashboard that tracks key metrics, automates data collection, and gives real-time insights to help improve your efforts. With a good dashboard maker and social media monitoring tool, you can simplify the process. This helps you collect important metrics all in one place.
- Track Conversions: To measure the ROI of your social media marketing, track conversions across each platform. Define conversions for your customers and set them as goals in Google Analytics for automatic tracking.
- Monitor Traffic: Website traffic from social media is another key metric to track. Monitoring the traffic from each platform allows you to refine your calls-to-action (CTAs). Most traffic comes from CTAs in individual posts, which guide consumers to specific pages. Some traffic comes from profile links.
- Track Comments: Tracking and analyzing comments across platforms helps you understand audience engagement and which content performs best. Social media dashboard templates help you manage comments from Facebook, Twitter, LinkedIn, YouTube, and Instagram all in one place, making it easier to keep up with interactions.
- Measure Likes: Tracking likes is a key way to measure engagement and refine your content. Depending on the platform, likes can affect how visible your posts are. It’s important to check this number often to increase your reach.
- Count Posts/Videos: When managing a client's social media campaign, it is critical to keep track of the quantity of posts or videos per platform. Adding this metric to your social media management dashboard shows your client that you are meeting the agreed-upon goals and are on track with the campaign's objectives.
- Make it Easier to View Content: Add a section to your Social media analytics dashboards. This section should display posts or videos from each platform. This way, you don't have to constantly switch between different apps or platforms to view and manage your content.
- Analyze Subscriber Demographics and Geographics: Lastly, it is useful to have a section in your dashboard. This section should track important demographic and geographic information about your subscribers. This includes their country, city, gender, and language preferences.
Moreover, these steps can help you track and analyze key metrics. They will also help you improve your campaigns and manage your client's social media presence.
Conclusion
In conclusion, social media marketing dashboards help you easily track important metrics and improve your marketing efforts. By bringing data from different platforms into one place, you can save time and make better decisions. With the right tools and a clear focus on your goals, a dashboard will keep you organized and help you reach your social media targets more effectively.
Frequently Asked Questions
A social media dashboard is a tool for tracking, analyzing, and managing social media performance in one place.
It helps streamline your social media efforts by consolidating key metrics, saving time, and improving decision-making.
It depends on your goals. Common choices include Facebook, Instagram, Twitter, LinkedIn, and TikTok.
Essential metrics include engagement rate, follower growth, reach, impressions, and conversion rates.
Popular tools include Google Data Studio, Hootsuite, Sprout Social, and custom-built dashboards using BI tools.
Prompt it. Wireframe it with Mokkup.ai.
