
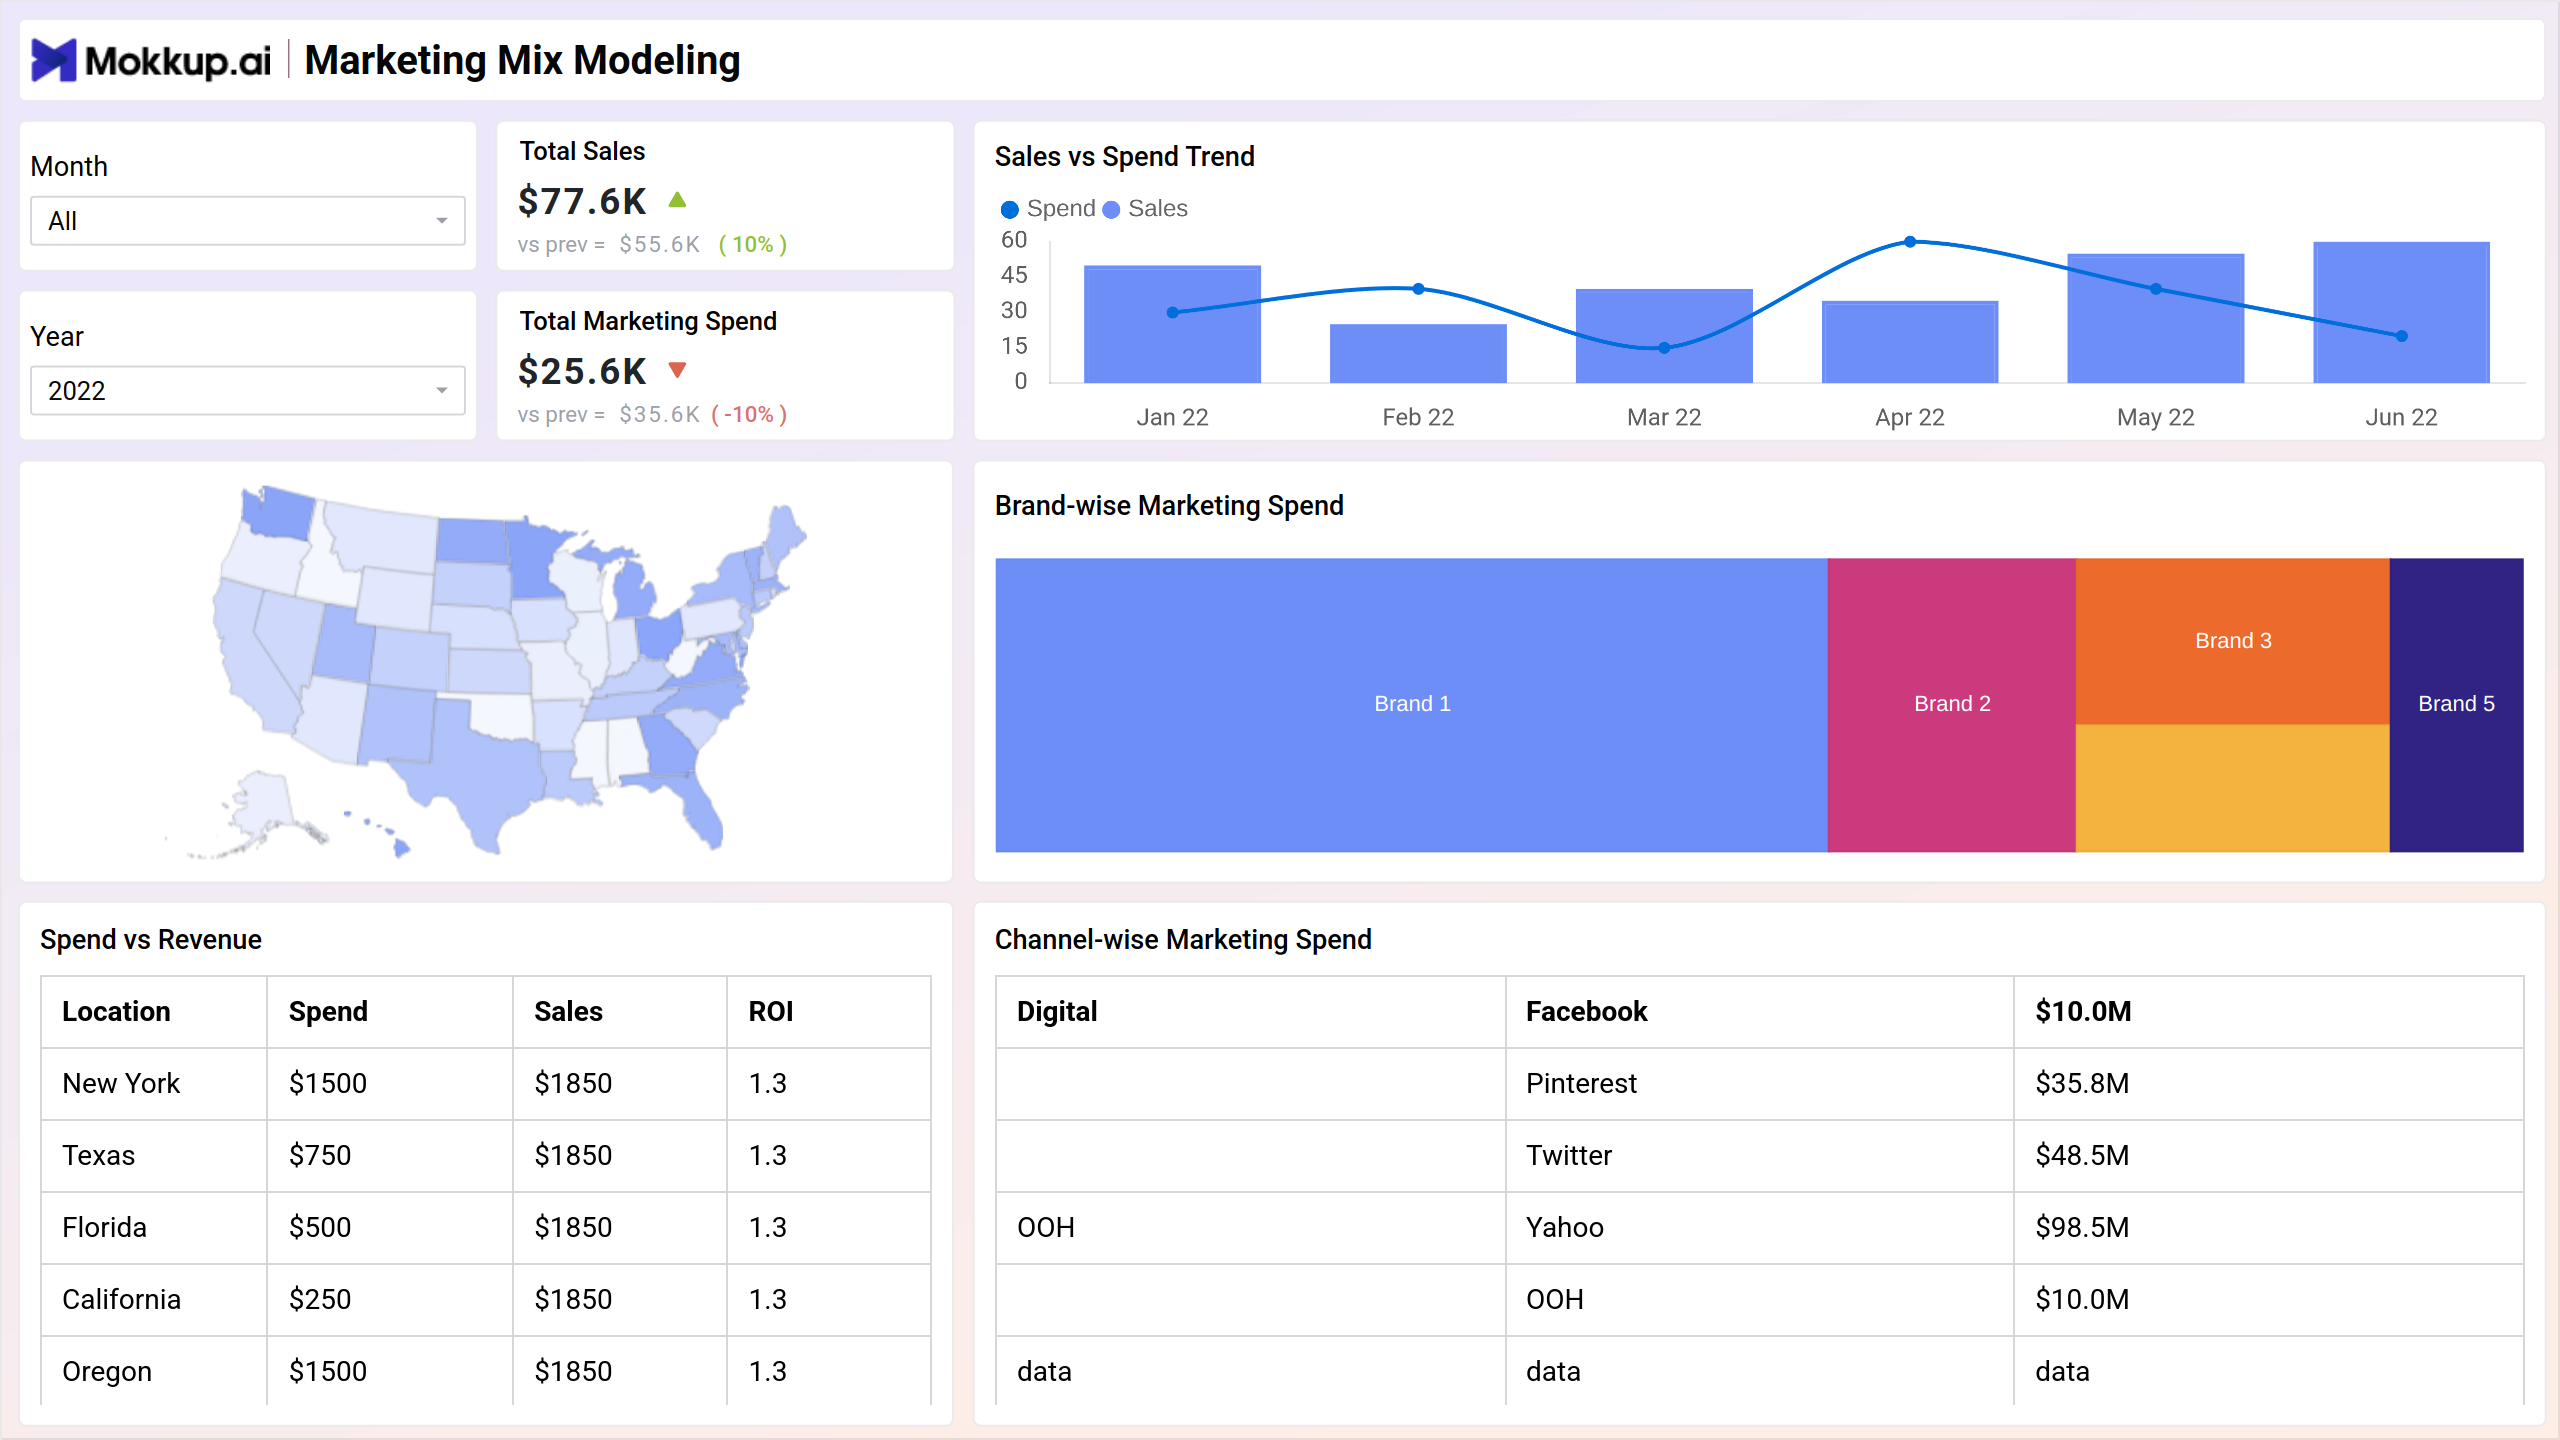
The Market Mix Modeling (MMM) dashboard enables businesses to efficiently optimize marketing spending and increase ROI by analyzing the influence of their advertising efforts and platforms on revenue.
Screen 1: Summary
This screen presents a summary of exploratory data analysis, together with information on current expenditure and income creation.
Key Terms to consider:
- Total Marketing Spend - Evaluate the overall expenditure on marketing initiatives to understand the scope of the budget allocation.
- Sales Vs Spend Trend - Analyze the trend between sales and marketing spend to identify correlations and optimize resource allocation.
- Brand-wise Marketing Spend - Break down marketing spend by brand to assess the effectiveness and impact of individual brand campaigns.
- Channel-wise Marketing Spend - Examine the allocation of marketing spend across different channels to optimize strategies based on performance.
- Spend Vs Revenue - Assess the relationship between marketing spend and revenue generated to measure the return on investment.
Screen 2: Spend Vs Effect
This screen illustrates the link between expenditure and its effect on results by representing the results of the marketing mix model on unprocessed information.
Key Terms to consider:
- Initial Vs Optimized Budget Allocation - Compare the initial budget allocation with optimized budgets to ensure efficient resource distribution.
- Avg. Adstock Decay Rate - Analyze the average rate at which advertising impact diminishes over time to optimize adstock levels.
- OOH - Evaluate the effectiveness and impact of Out-of-Home advertising strategies within the overall marketing spend.
- Optimized Spend - Determine the most effective and efficient level of spending to maximize outcomes and returns.
- Avg. Effect Share - Assess the average share of advertising effectiveness across different marketing channels.
Screen 3: Predictor Analysis
This screen assesses the significance and influence of different predictors (features) included in the model's construction on sales success.
Key Terms to consider:
Response Decomposition Waterfall by Predictor - Break down response factors to understand the waterfall of predictors influencing marketing responses.
Screen 4: Simulator
This screen allows users to alter marketing expenditure across channels and calculates the marginal ROI for data-driven decision-making.
Key Terms to consider:
- Total Simulated Weekly Spend - Calculate the total simulated weekly spend for a comprehensive overview of budget utilization.
- Admarket % - Examine the percentage of the advertising market captured by the brand to gauge market presence and competitiveness.
- DV360 - Evaluate the performance and impact of campaigns executed through Display & Video 360 (DV360).
Dashboard Template Insights
The Market Mix Modeling (MMM) dashboard facilitates efficient marketing spending and improved ROI by analyzing advertising influences on revenue. Through screens focusing on expenditure trends, the impact of spending on results, predictor analysis, and a simulator for data-driven decision-making, organizations can enhance campaigns, optimize budgets, and boost overall revenue production.
Conclusion
With the help of the Market Mix Modeling dashboard, organizations can make data-driven decisions, improve their marketing campaigns, and boost total revenue production.