
Marketing is all about results, but you can’t improve what you can’t measure. That’s where dashboards come in. They turn scattered data into clear visuals that show what’s going on with your campaigns. We’ve rounded up some of the best marketing dashboard templates and examples to help you track performance, spot trends, and confidently take action.
Table of Contents
- What is a Marketing Dashboard?
- Benefits of Using Marketing Dashboards
- Types of Marketing Dashboards with Templates & Examples
- Free vs Premium Marketing Dashboard Templates
- How to Choose the Right Marketing Dashboard Template
- Best Tool to Build Marketing Dashboards - Mokkup
- Tips for Designing Effective Marketing Dashboards
What is a Marketing Dashboard?
A marketing dashboard is a visual tool that consolidates critical marketing KPIs and performance indicators in one place. It helps marketers to analyze campaign success, evaluate client behavior, and measure return on investment (ROI) across many channels, such as social media, email, SEO, and paid ads.
Mokkup offers a variety of ready-to-use marketing dashboard templates, allowing users to plan and visualize their data efficiently. It also lets you export designs directly into Power BI and Tableau files, helping streamline development and saving valuable time.
Benefits of Using Marketing Dashboards
Marketing involves managing multiple projects, channels, and data points; keeping track of them all can be difficult. This is where marketing dashboards come in. They provide a clear, real-time overview of your efforts' progress, allowing you to stay organized and focused on what is truly important. Let's examine some key benefits of marketing dashboards and why they're essential for every modern marketing organization.
1. Real-Time Insights:
Marketing dashboards give you up-to-date information to monitor campaigns as they happen. This helps you spot what’s working (or not) without waiting for end-of-month reports.
2. All Data in One Place:
Instead of switching between platforms like Google Analytics, Facebook Ads, or email tools, dashboards combine everything. You get a complete view of your marketing performance on one screen.
3. Better Decision-Making:
Clear visuals and performance metrics make it easier to take smart, data-driven decisions, such as increasing ad spend, modifying a campaign, or focusing on a high-performing channel.
4. Saves Time:
No more manual reporting or creating charts from scratch. Dashboards update automatically, saving you hours of work each week.
5. Keeps Teams Aligned:
Everyone from the marketing manager to the executive team can see the same data, which keeps communication clear and goals aligned.
6. Helps Track ROI:
Marketing dashboards make it easier to measure return on investment across different campaigns and channels, so you can see where your money is going and what it’s returning.
7. Improves Campaign Performance:
You can quickly adjust strategies to improve results by tracking performance regularly instead of waiting until it’s too late.
Your marketing team gains clarity, speed, and focus with the right marketing reporting dashboard. With tools like Mokkup.ai, building these dashboards becomes faster, easier, and more collaborative than ever.
Types of Marketing Dashboards with Templates & Examples
Marketing spans websites, social media, email, ads, and more, making tracking performance in one place more challenging than ever. Mokkup helps simplify this process by offering pre-built marketing dashboard templates and allowing you to design and structure your marketing dashboards before development. It enables teams to align on KPIs, visualize performance clearly, and save valuable time.
Let’s explore three essential types of Mokkup marketing dashboard examples that you can customize in Mokkup to support your campaigns and reporting needs.
1. Digital Marketing Dashboard:
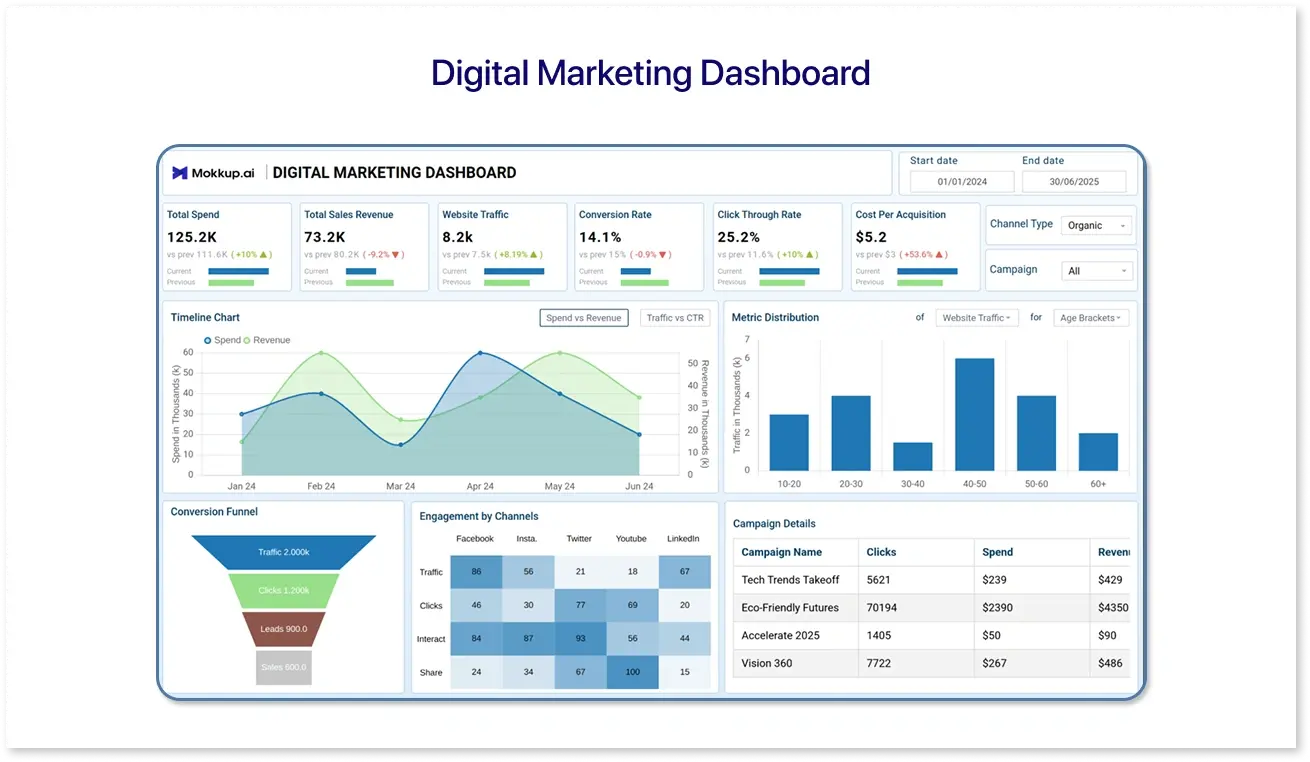
The Digital Marketing Dashboard template combines all your digital marketing efforts, across SEO, email, social media, and paid ads, into a single, easy-to-read view.
How It Helps:
This template consolidates key KPIs like impressions, CTR, CPC, conversions, and bounce rates, which helps quickly assess campaign performance, identify trends, and make informed decisions across channels.
Example Use Case:
A retail brand uses the digital marketing dashboard to track campaign performance during holiday sales. With one view, they can compare ROI across email, Google Ads, and Instagram promotions.
2. Marketing Funnel Dashboard:
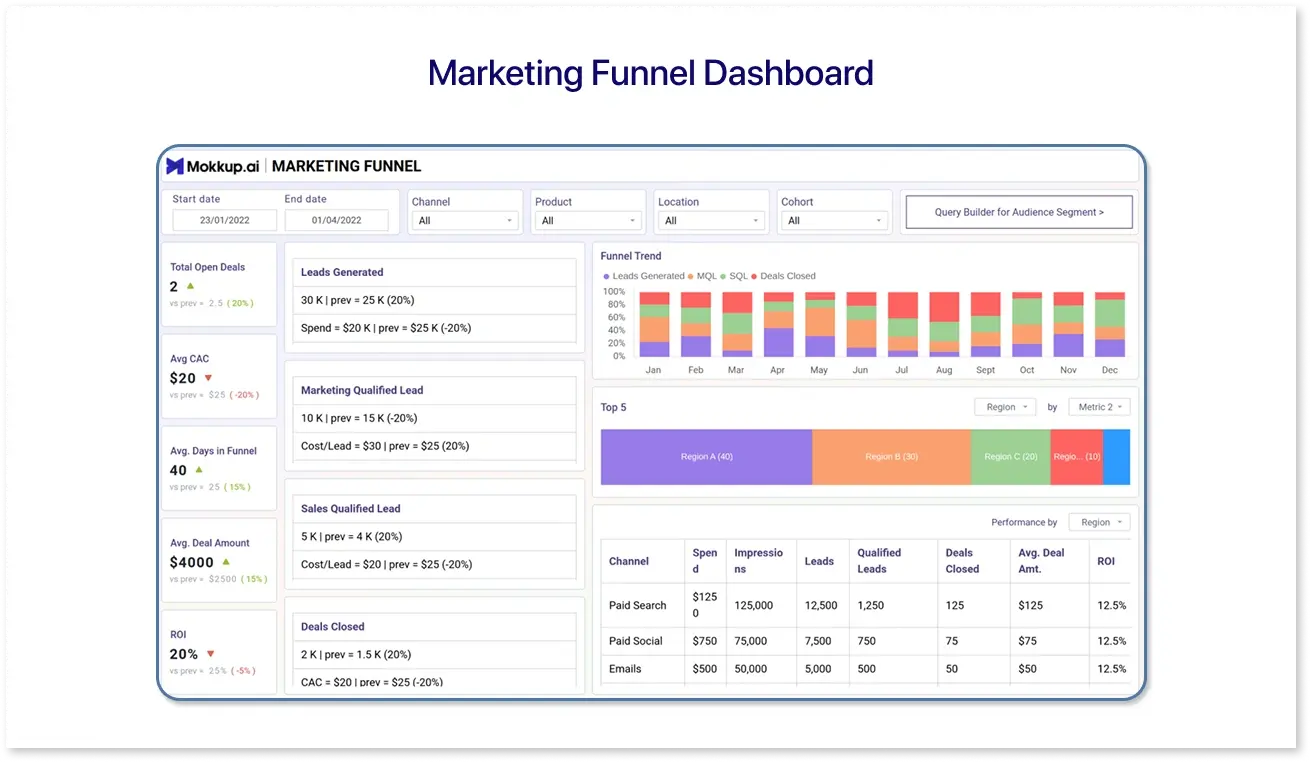
A Marketing Funnel Dashboard template clearly and visually breaks down how users move from awareness to action, showing drop-offs and conversion rates at every stage.
How It Helps:
This funnel template lets you quickly identify where leads are stalling, so your team can adjust messaging or improve targeting.
Example Use Case:
A B2B company uses the funnel dashboard to monitor lead movement from ad clicks to demo requests. They notice a sharp drop-off after sign-up and use this insight to improve their onboarding email sequence.
3. Content Marketing Dashboard:
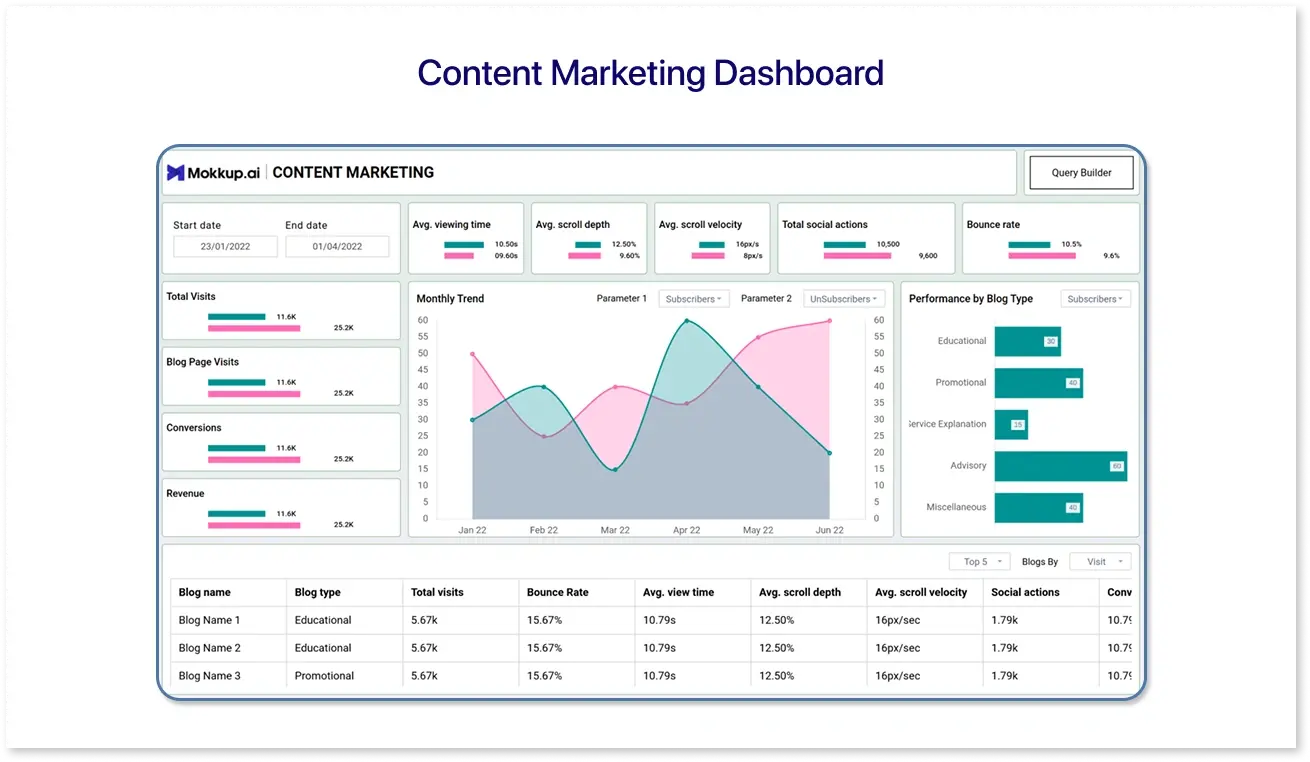
A Content Marketing Dashboard template focuses on the performance of your content, blogs, videos, landing pages, and more.
How It Helps:
The template displays engagement metrics like page views, time on page, shares, backlinks, and SEO rankings. You can customize it in Mokkup to fit your content goals and send it to your BI team for quick implementation.
Example Use Case:
A content team at a tech company uses this dashboard to measure which blogs drive the most organic traffic and form fills. The insights help guide their editorial calendar for the next quarter.
Ready-made marketing dashboard templates help you skip the blank canvas and focus on what matters—getting insights faster. They’re fully customizable, built with BI best practices in mind, and can be easily adapted to the tools your team already uses.
Free vs Premium Marketing Dashboard Templates
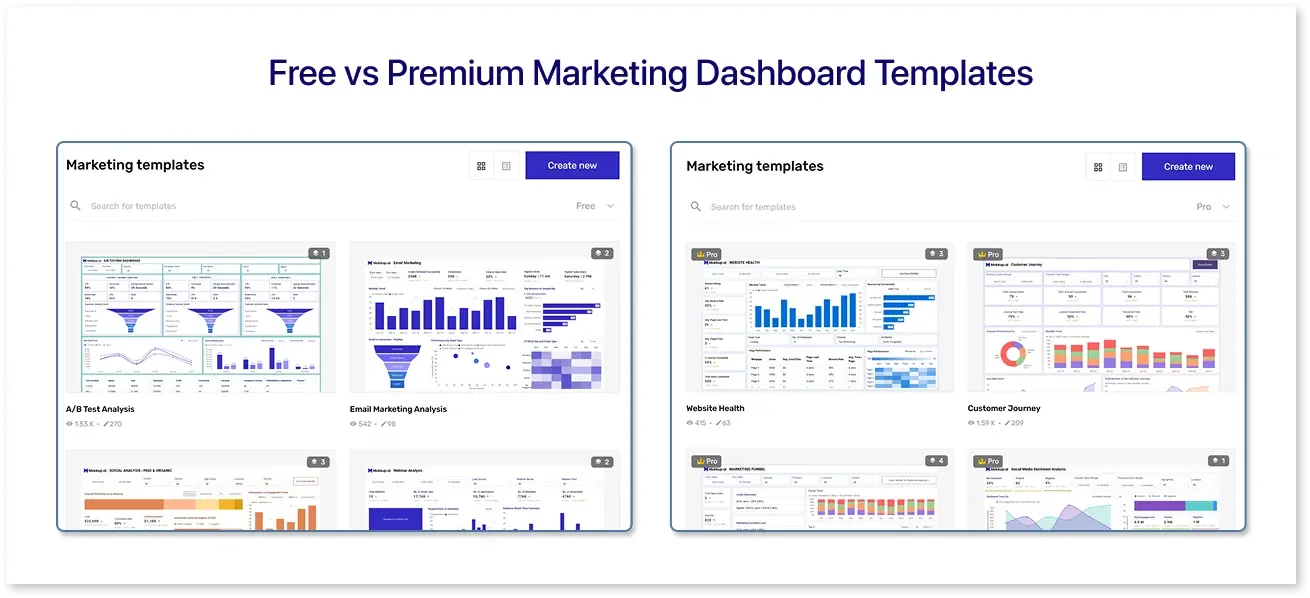
Mokkup offers various marketing dashboard templates to suit different needs and budgets. The free templates provide essential layouts and key metrics to get you started quickly without any cost. Premium templates are available for more advanced features, customization options, and specialized designs.
These paid options offer deeper insights and greater flexibility, helping teams build more tailored and impactful dashboards. Whether you choose free or premium, Mokkup makes finding the right template for your marketing goals easy.
Let’s look at examples of both free and premium marketing dashboard templates offered by Mokkup:
Free Marketing Dashboard Templates
Mokkup’s free templates are ideal for individuals or teams who need quick and straightforward dashboards to track essential metrics without extra customization.
1. Email Marketing Analysis:
An Email Marketing Analysis dashboard template easily tracks metrics like open rate, click-through rate, unsubscribe rate, and conversions from email campaigns. It is perfect for email marketers looking to understand audience engagement at a glance.
2. Social Media Analysis:
A Social Media Analysis dashboard template consolidates performance metrics across social platforms like Facebook, Twitter, and LinkedIn. Monitor follower growth, reach, impressions, and overall engagement trends easily.
3. Webinar Analysis:
A Webinar Analysis dashboard template provides a clear view of webinar performance with data on registration numbers, attendance rates, engagement during the session, and post-event feedback. This information helps optimize future virtual events.
Premium Marketing Dashboard Templates
Mokkup’s premium templates offer advanced features and refined layouts for teams that need more detailed insights and customization.
1. Website Health Dashboard:
Analyze your website’s performance in detail with the Website Health dashboard template, which offers metrics like page load time, bounce rate, device/browser performance, top traffic sources, and user journey insights. It is ideal for SEO and digital teams managing high-traffic websites.
2. Social Media Engagement Report:
Go beyond basic metrics with the Social Media Engagement Report dashboard template. This template offers post-level engagement data, content type performance, audience demographics, and trend analysis, helping content and social media teams refine strategy based on real interaction data.
3. Instagram Analytics Dashboard:
Focused entirely on Instagram analytics, this dashboard template covers story views, reel engagement, profile visits, link clicks, hashtag performance, and follower behavior. It is great for brands with a strong visual presence.
No matter which option you choose, Mokkup allows you to preview, customize, and export these templates into development-ready formats for tools like Power BI and Tableau. Whether you're just starting or need high-level reporting for stakeholders, there’s a template that meets your marketing needs.
How to Choose the Right Marketing Dashboard Template
Choosing the right marketing dashboard template depends on what you want to communicate, who you share it with, and how complex your reporting needs are. Here are a few tips to guide you:
1. Start with Your Marketing Goals:
Are you tracking digital performance, measuring lead conversions, or evaluating content reach? Select a template that aligns with your primary objectives.
2. Consider Your Audience:
Internal team templates may incorporate more detailed data, whereas executive dashboards should emphasize high-level KPIs and clean visuals.
3. Choose Based on Channel Focus:
Use a digital marketing template for multi-channel overviews, a funnel template for lead journey insights, or a content dashboard for blog and SEO reporting.
4. Decide Between Free and Premium:
Free templates are ideal for basic reporting. Premium templates are worth the investment if you require complex visualizations, layout flexibility, or in-depth research.
5. Look for Design Flexibility
Since Mokkup is a design-first tool, ensure the template you pick is easy to customize. This way, you can tweak layouts, KPIs, and visual elements to match your needs before handing it off for development.
Once finalized, you can export your designs directly into Power BI or Tableau files, making it easier for developers to build and deploy dashboards without starting from scratch.
Best Tool to Build Marketing Dashboards - Mokkup.ai
Here’s why Mokkup.ai is a top choice for building marketing dashboards efficiently and collaboratively:
1. Start with Pre-Built Templates:
To avoid starting from scratch, choose from various ready-to-use marketing dashboard templates, including digital marketing, funnel performance, and content analysis.
2. Design Before You Develop:
Create wireframes that adhere to BI best practices. It enables teams to agree on layout, KPIs, and visual structure before moving to Power BI or Tableau.
3. Export to Power BI and Tableau:
Once your design is complete, you can export it as a Power BI or Tableau file, saving developers time while ensuring your design vision is carried out.
4. Real-time collaboration with Mokkup Pro:
Collaborate with your team in real time. Mokkup Pro enables multiple individuals to edit wireframes simultaneously, provide instant feedback, and finish designs quickly.
5. Customizable and Easy to Use:
Mokkup.ai is a drag-and-drop marketing dashboard tool that lets you tailor every dashboard to your specific marketing goals and reporting needs, without needing design or coding skills.
With Mokkup.ai, you get a faster, cleaner, and more collaborative way to bring your marketing dashboards to life.
Tips for Designing Effective Marketing Dashboards
A good dashboard helps teams stay on the same page, find trends faster, and make better decisions. Whether you're starting fresh or using a ready-made template, here are some simple tips to make your dashboard more useful and clear:
- Define Your Objective First: Understand the dashboard's purpose, whether it is to track campaign ROI, lead generation, or brand engagement. Your aim will determine which KPIs and visuals you include.
- Keep It Focused: Don’t overload the dashboard with too many metrics. Focus on the most relevant KPIs for your audience to avoid clutter and confusion.
- Use Clear, Simple Visuals: Based on the data, choose the appropriate chart type (e.g., bar, line, donut). Make sure the visuals are straightforward to read and understand at a glance.
- Group-Related Metrics Together: Arrange similar data pieces, such as ad performance and spend, for context and clarity.
- Highlight What Matters Most: Use colors, icons, or callouts to highlight significant metrics, changes, or thresholds that require action.
- Design for Your Audience: A CEO dashboard should be high-level, whereas one for marketing analysts can contain more detailed information.
- Add Filters and Date Ranges: If supported, interactive filters allow users to explore data without affecting the primary layout, which is ideal for gaining deeper insights.
- Use Consistent Terminology: Use consistent terminology to avoid confusing users. For example, use “CTR” throughout instead of switching between “click rate” and “CTR.”
- Plan Before You Build: Wireframing your dashboard first (using tools like Mokkup.ai) helps align your team on design and structure before development begins.
- Test with Real Users: Share your dashboard with end users and collect feedback. A great dashboard is not only accurate but also usable.
These tips will help you create dashboards that are not only visually appealing but also functional and easy to act on
Conclusion
Marketing dashboards are essential for tracking performance and making informed decisions. With Mokkup.ai, creating and customizing these dashboards is fast, collaborative, and hassle-free. From templates to real-time editing, Mokkup simplifies your workflow, so you can focus on what matters: results.
Frequently Asked Questions
A marketing dashboard should include KPIs like lead conversion rate, customer acquisition cost, campaign ROI, social media engagement, and website traffic metrics.
You can create a free dashboard using tools like Mokkup.ai for wireframing or Google Data Studio for live data dashboards—both offer free plans.
Track engagement rate, reach, impressions, follower growth, click-through rate (CTR), and conversions from social platforms.
Popular tools include Mokkup.ai for design mockups, Tableau for BI dashboards, and Google Data Studio for free reporting.
Yes, dashboards can be tailored for e-commerce, SaaS, healthcare, and more, each focusing on metrics relevant to their marketing goals.
Prompt it. Wireframe it with Mokkup.ai.
