
If you’ve ever managed multiple social media accounts, you already know the struggle. Juggling multiple logins, checking notifications across apps, downloading analytics from each platform, and then manually building reports that never quite capture the whole picture. It’s time-consuming, messy, and often leaves gaps in understanding how your efforts are really performing.
This is where social media dashboards come in. They unify the critical metrics in one place to make the work of marketers, creators, and agencies easier. But before you start using one, it’s worth knowing why they matter, the different types available, and what resources you’ll need. This blog breaks it all down for you.
Table of Contents
- What Is a Social Media Dashboard?
- Why You Need Social Media Dashboards in 2025
- Key Features of a Modern Social Media Dashboard
- Types of Social Media Dashboards and Use Cases
- Essential Metrics to Track in Your Dashboard
- How to Choose the Best Social Media Dashboard Tool
- Step-by-Step Guide to Setting Up Your Dashboard
- Best Practices for Social Media Dashboard Success
What Is a Social Media Dashboard?
A social media dashboard is a centralized overview that pulls data from various social media channels, like Twitter, Instagram, LinkedIn, Facebook, and TikTok, into one visual space. Instead of digging through endless spreadsheets or native app reports, a dashboard gives you a real-time view of multiple social media analytics points, such as performance metrics, engagement trends, audience insights, and campaign ROI.
Whether you’re a marketer, brand manager, or business owner, a social media analytics dashboard does more than tracking key metrics. It helps you decide actions on consolidated data.
Why You Need Social Media Dashboards in 2025?
According to Statista, over 5.24 billion social media users exist globally. Naturally, brands face massive competition for attention. Each post, ad, and campaign must justify its cost and bring back ROI.
Additionally, brands must be omnipresent on multiple platforms to maintain visibility and awareness. They compete with each other by meeting customers on their preferred channels. Such wide integration requires brands to have a bird's-eye view of their customers' entire journeys.
But relying on native tools alone won’t cut it anymore. For instance, Twitter analytics will only show you platform-specific data. But what if you need to see how Twitter compares to LinkedIn in driving website leads, or whether Instagram ads generate better cost-per-click than Facebook? That’s where a unified Social media analytics dashboard comes in.
A social media reporting system powered by dashboards gives you:
- A single source of truth across all platforms
- Ability to track paid and organic efforts in one place
- Time savings on manual reporting
- Better decision-making with actionable insights
- Competitive edge through real-time optimization
In short, without a dashboard, you will be blind in 2025 due to rising AI-driven campaigns and cross-channel content. This need is reflected in the social media analytics market growth, which is expected to grow at a CAGR of 20.8% by 2032.
Key Features of a Modern Social Media Dashboard
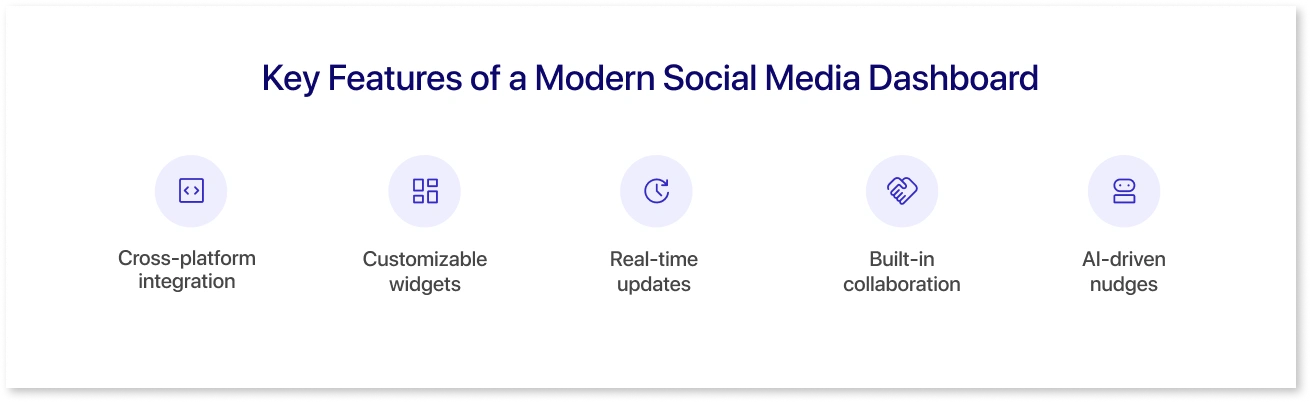
The truth is, not every dashboard is worth your time. Plenty of them just throw likes, shares, and follower counts at you. Nice to know, but not very helpful when you’re trying to prove results or decide where to put your next marketing dollar. A modern dashboard should go deeper. It should connect the dots, save you time, and give you insights you can actually use. That’s what today’s social media dashboard templates are built for.
-
Cross-platform integration: Instead of bouncing between Facebook Ads Manager, LinkedIn Analytics, TikTok reports, and Twitter analytics, you get one clean view of everything—one login, one screen.
-
Customizable widgets: Every business tracks something different. Good dashboards let you pick the charts, layouts, and crucial e-commerce KPIs that matter to your business. This is why most dashboard templates for marketing and sales offer flexibility with customization.
-
Real-time updates: Forget waiting until the campaign ends. If something’s tanking, you’ll see it as it happens and fix it before the budget is gone. That’s where real-time dashboard updates help.
-
Built-in collaboration: Reporting isn’t a solo job. The best dashboards let teams comment, tweak, and align in one place without messy email threads.
- AI-driven nudges: Some dashboards now have predictive capabilities that suggest the best times to post or even where to shift your budget. It’s like having an extra strategist for data-backed insights on your team.
And here’s a bonus: The most effective dashboards that change the game for businesses don’t just crunch numbers, they tell a story.
Types of Social Media Dashboards and Use Cases
There isn’t a one-size-fits-all Social media dashboard template. Depending on goals, companies often use specific ones. Let’s look at them.
1. Social Media Sentiment Analysis Dashboard
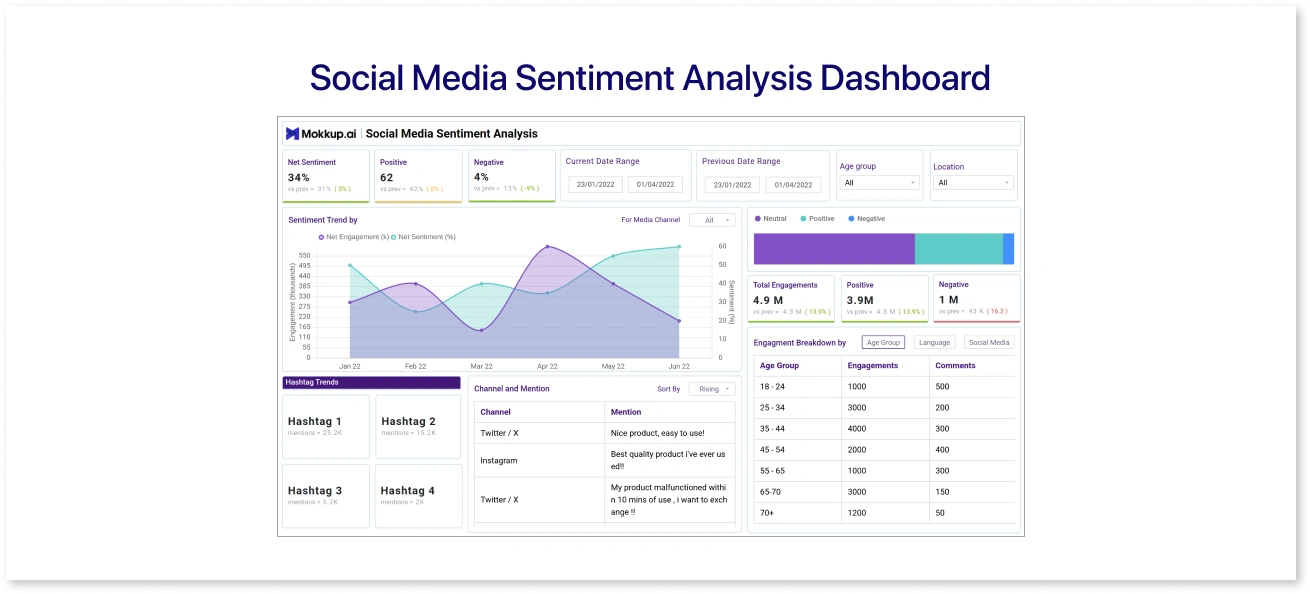
As its name suggests, a Sentimental analysis dashboard for social media shows the public perception and overall engagement across multiple social media channels. Its role is to help businesses identify customer patterns, review performance, and assess the overall outlook.
A social media sentiment analysis dashboard organizes scattered sentiment data, engagement trends, and demographic filters, helping businesses understand what is being said about them and by whom.
Use cases:
- Tracking audience mood during a product launch
- Spotting negative spikes early to manage PR,
- Comparing sentiment across platforms to refine content strategy
- Connecting numbers with real perception.
If this social media dashboard template fits your needs, you don’t have to build it from scratch. You can pick it straight from Mokkup.ai, integrate it with your BI tools, and customize it as you like. The platform has 250+ ready-to-use templates across social media, sales, finance, healthcare, and more.
2. Social Media Engagement Report Dashboard
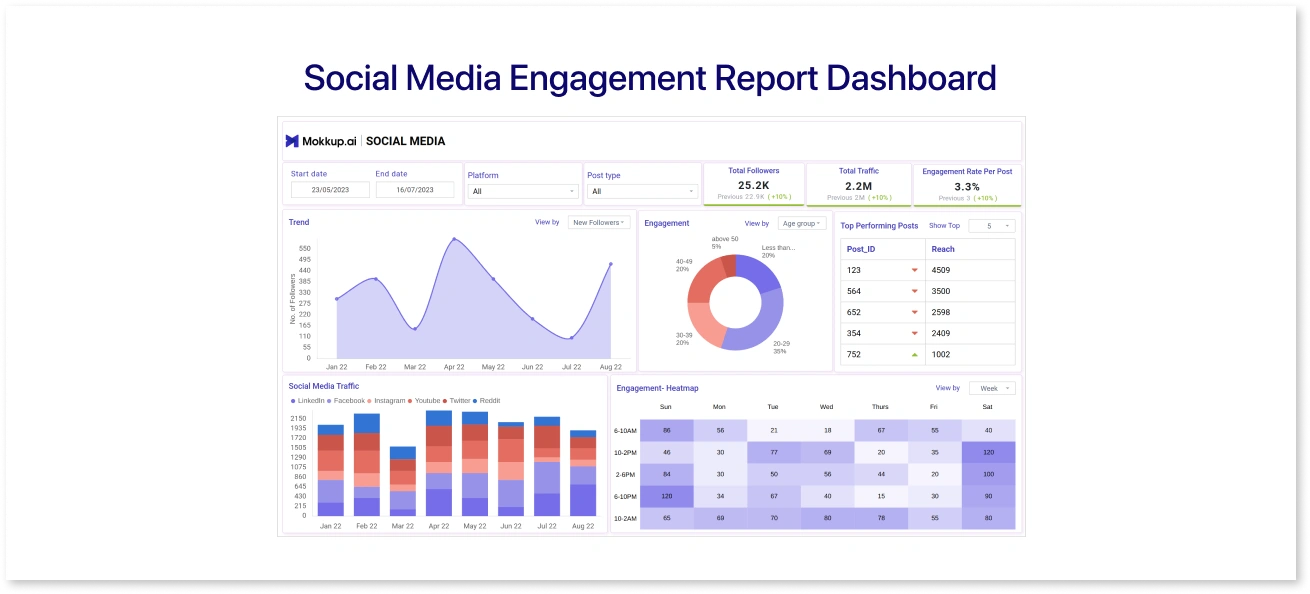
A social media engagement dashboard clearly shows how audiences interact with your brand across platforms. Instead of checking likes, shares, and comments separately on each channel, this dashboard pulls everything together to measure overall engagement in one place.
It highlights patterns in how people respond to your posts, which content formats drive the most activity, and how engagement changes over time. Filters for channels, age groups, campaigns, and time periods help teams see both the big picture and the fine details behind audience behavior.
Use cases:
- Monitoring top-performing posts and formats
- Tracking engagement trends during campaigns or events
- Comparing audience interaction across platforms
Are these the social media dashboards you’ve been looking for? Get it from Mokkup.ai, customize it, and export it easily to your BI tools.
3. Social Media Platform Overview Dashboard
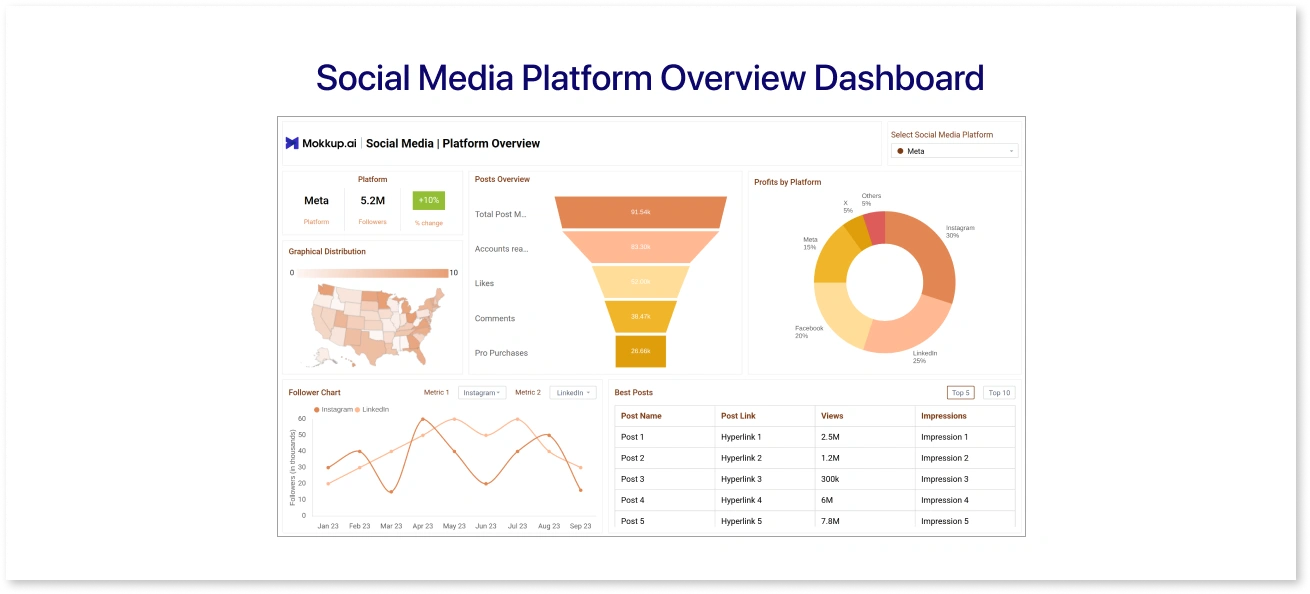
A social media platform overview dashboard gives you a clear snapshot of your brand's performance across different channels. Instead of opening each app separately to check followers, engagement, or revenue, everything shows up in one place.
The dashboard pulls data into charts and visuals that make sense, including growth funnels, follower trends, and engagement breakdowns. You can quickly see which posts are bringing in the most views, impressions, or revenue, and spot patterns that help refine your content strategy.
Use cases:
- Tracking how your followers and engagement change over time
- Pinpointing your top-performing posts and campaigns
- Checking which platforms drive the most revenue or ROI
- Comparing results across multiple accounts to guide strategy
In short, such social media dashboards save time, cut the guesswork, and help teams decide where to focus their energy to build stronger audience connections.
For those looking for a social media reporting dashboard like this, Mokkup.ai offers it ready to use, editable, and exportable straight into your BI tools.
4. Online Search Analysis Dashboard
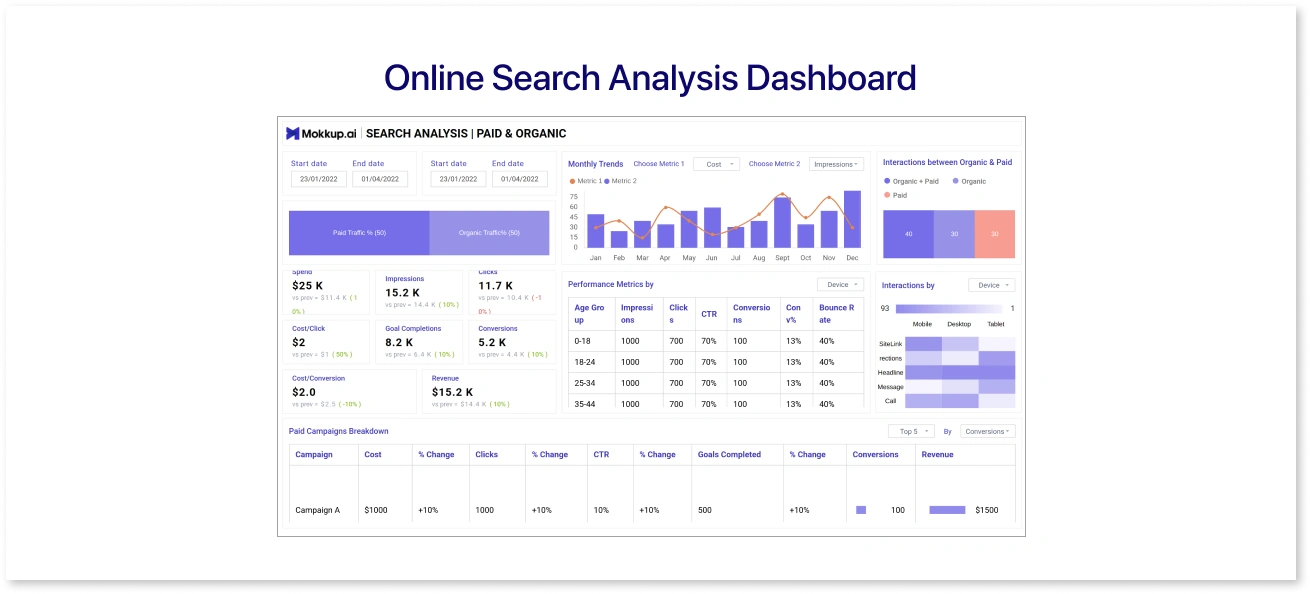
A search summary dashboard helps businesses understand how people are finding their brand online. It pulls together data from paid and organic searches by analyzing KPIs like clicks, impressions, conversions, and keyword performance. This showcase helps teams see what’s working and what needs adjusting. Instead of sifting through separate reports, you get a clear view of how campaigns perform and where your budget delivers the best ROI.
It is the best social media dashboard for businesses consistently investing money in paid and unpaid marketing on various social media channels. They can have a unified view of demographics, posts, trends and other key aspects of their campaigns at a single glance.
Use cases:
- Tracking ad performance with metrics like cost per click, impressions, CTR, and cost per conversion
- Breaking down paid campaigns to optimize spend and efficiency
- Comparing organic vs. paid traffic sources to refine search strategy
When social media dashboard examples like these are exactly what you want, Mokkup.ai lets you grab it, tweak it, and integrate it directly with your BI tools.
5. Customer Data Platform
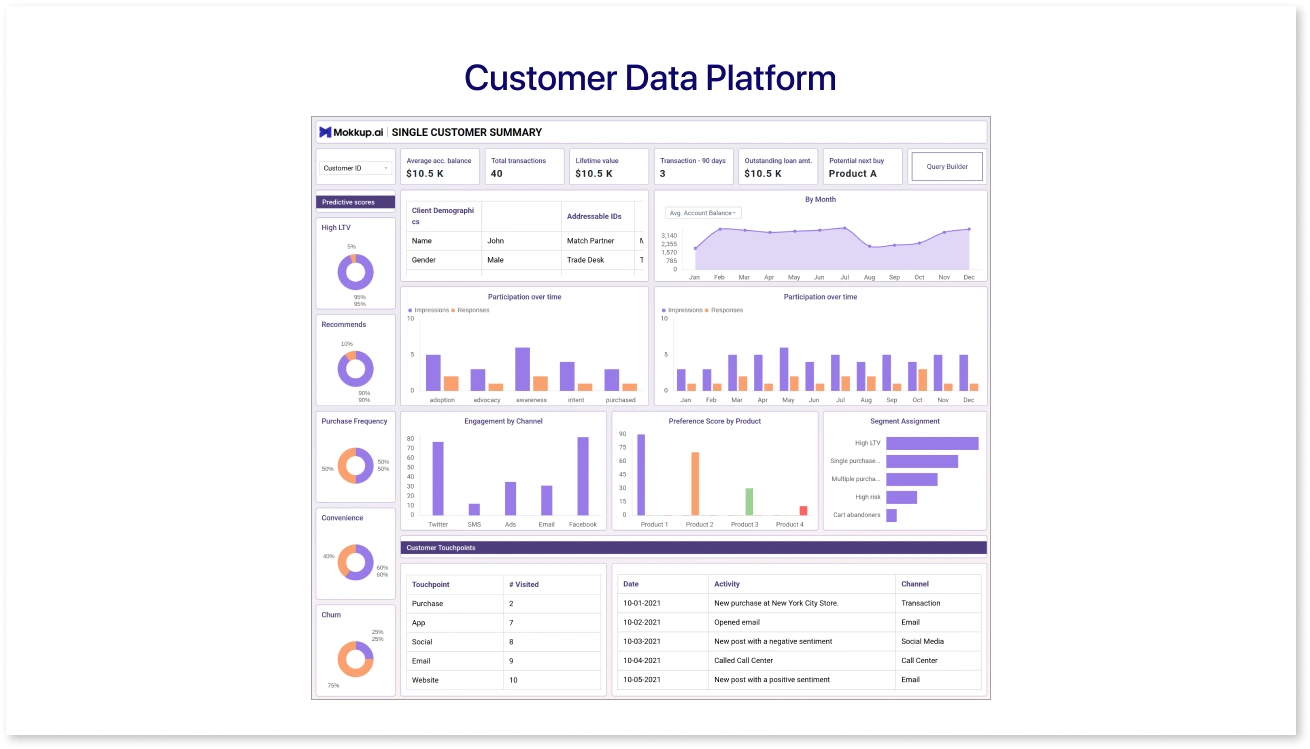
The next mention in the list of Social media dashboard templates is a Customer Data Platform (CDP) dashboard that gives digital marketers a single and reliable view of their audience. Instead of juggling spreadsheets or disconnected tools, this dashboard organizes profiles, tracks behavior, and reveals insights that help shape smarter campaigns.
It provides dedicated views on a single customer journey with interesting, actionable metrics like lifetime value, demographics, and potential purchases. The detailed ensemble of the campaign journey via funnel, from impressions to clicks, also adds to its speciality, which makes it easy for marketers to understand the weak points and segregate audiences for future campaigns.
Use cases:
- Identifying high-value customers and predicting future purchases
- Creating precise audience segments for targeted campaigns
- Analyzing channel performance to refine strategy and spend
- Improving data quality for better personalization and reporting
When it comes to finding the best social media dashboard that meets your needs, a wide variety of options exist in the market. While the above examples may meet most business requirements in social media management, some still need specifically designed versions. For that, dashboard wireframing tools like Mokkup.ai provide an easy-to-design environment with drag-and-drop features and AI-powered wireframing.
Need a step-by-step guide? Check out how to build an ultimate social media dashboards for practical tips.
Essential Metrics to Track in Your Dashboard
Dashboards are only as good as the metrics they show. While vanity metrics look good, the right KPI metrics maximize your dashboard’s impact. Some must-have metrics include:
- Impressions: Showcases brand visibility on social platforms
- Engagement Rate: Users interacting with your posts (in%)
- Click-Through Rate (CTR): How often users click on your content.
- Conversions & Leads: Tied to business outcomes.
- Customer Response Time: Critical for service-heavy industries.
- Sentiment Analysis: AI-driven insights into positive vs. negative mentions.
How to Choose the Best Social Media Dashboard Tool
When selecting a social media analytics dashboard tool for creation, consider usability, customization, and scalability. The best tools will let you integrate multiple channels, create reports without coding, and adjust to growing needs.
Here’s where Mokkup.ai stands out. It offers:
- AI-powered dashboard creation for faster setups
- Export compatibility with BI tools like Power BI and Tableau
- Collaboration-friendly design for marketing teams
- 250+ ready-to-use dashboard templates (including social media dashboard examples)
- Drag-and-drop customization with zero technical skills required
Step-by-Step Guide to Setting Up Your Dashboard
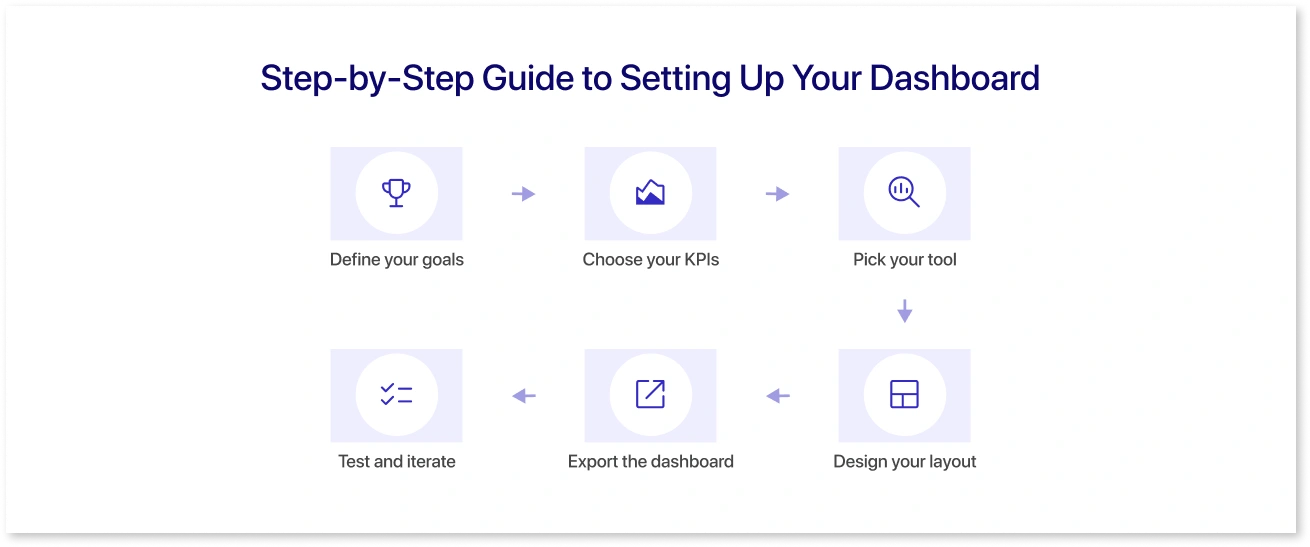
- Define your goals, like brand awareness, lead generation, or customer service.
- Choose your KPIs that align with goals.
- Pick your tool for designing or setting up the dashboard. Make sure to pick those which provid export feature to your preferred BI tool.
- Design your layout by starting from scratch or using ready-to-use dashboard templates.
- Export the dashboard to your preferred BI tool and integrate data sources such as Instagram, Twitter analytics, Facebook, GA4, Google AdSense, and more.
- Test and iterate by monitoring accuracy, adjusting filters, and refining visualizations.
Best Practices for Social Media Dashboard Success
To get the most out of your dashboards:
- Keep visuals simple but meaningful (read more in the art of dashboard design).
- Don’t overload with metrics. Only prioritize those tied to revenue.
- Involve all relevant teams, like sales, service, and content, to ensure all insights are captured.
- Review dashboards regularly.
- Benchmark against competitors for context.
- Evolve the dashboards with time as algorithms change and new platforms emerge.
Conclusion
Social media dashboards are essential for making sense of fragmented data and obtaining good marketing ROI. Whether you’re looking at engagement, conversions, or campaign efficiency, dashboards consolidate everything into one actionable view. With modern solutions like Mokkup, even non-technical teams can create customized social media dashboard templates in minutes, collaborate in real time, and integrate with BI tools for deeper analysis.
Frequently Asked Questions
It is a dashboard that collects and visualizes data from multiple social media platforms so users can track performance, engagement, and ROI easily.
Some popular options include Mokkup, Power BI, and Tableau. Each varies in customization, pricing, and integrations.
Start by defining goals and KPIs, choosing a tool with customizable templates, and designing layouts tailored to your reporting needs.
Key metrics include engagement rate, reach, CTR, conversions, and sentiment analysis.
They save time, reduce manual reporting, and provide a holistic view of performance across channels. Most importantly, they help marketers make informed, data-driven decisions.
Prompt it. Wireframe it with Mokkup.ai.
