In marketing, we often say that first impression is the last impression. Given that, SaaS onboarding funnels are critically important to make a strong first impression. In fact, according to the “User Onboarding Statistics” report by UserGuiding, “90% of users churn if they don’t understand a product’s value within the first week of signing up.” This is mainly due to poorly optimized SaaS onboarding metrics, resulting in significant drop-offs.
Clearly, it means that your onboarding flow needs to be data-driven, which drives retention and conversions. Tracking the right SaaS onboarding metrics helps you understand where users drop off, what actions correlate with long-term success, and how to continuously improve the experience.
Let’s explore how you can use KPIs to transform your SaaS onboarding funnel into a conversion-ready experience.
Table of Contents
- Why Measuring KPIs Is Critical for SaaS Onboarding Success
- Essential Data-Driven KPIs to Track in Your SaaS Onboarding Funnel
- Step-by-Step Process to Optimize SaaS Onboarding with KPIs
- Best Practices for Improving Onboarding Funnel Metrics
- Choosing Tools for KPI-Driven Onboarding Analysis
- Common Mistakes and How to Avoid Them
- Future Trends in Data-Driven SaaS Onboarding Optimization
Why Measuring KPIs Is Critical for SaaS Onboarding Success
The optimisation of your SaaS onboarding funnel hinges on your ability to define, track, and act upon critical onboarding success metrics. A well-measured onboarding funnel lets you:
- Understand where users drop off (activation, first task, first key action)
- Diagnose friction: long wait times, unclear UI, irrelevant tasks
- Correlate onboarding behaviour with retention, upgrade, and expansion
- Make iterative improvements based on data, not gut feel.
For example, in a robust SaaS flow, the goal is to achieve minimal “time-to-value” (the moment a user understands the benefit) and maximize activation.
Essential Data-Driven KPIs to Track in Your SaaS Onboarding Funnel
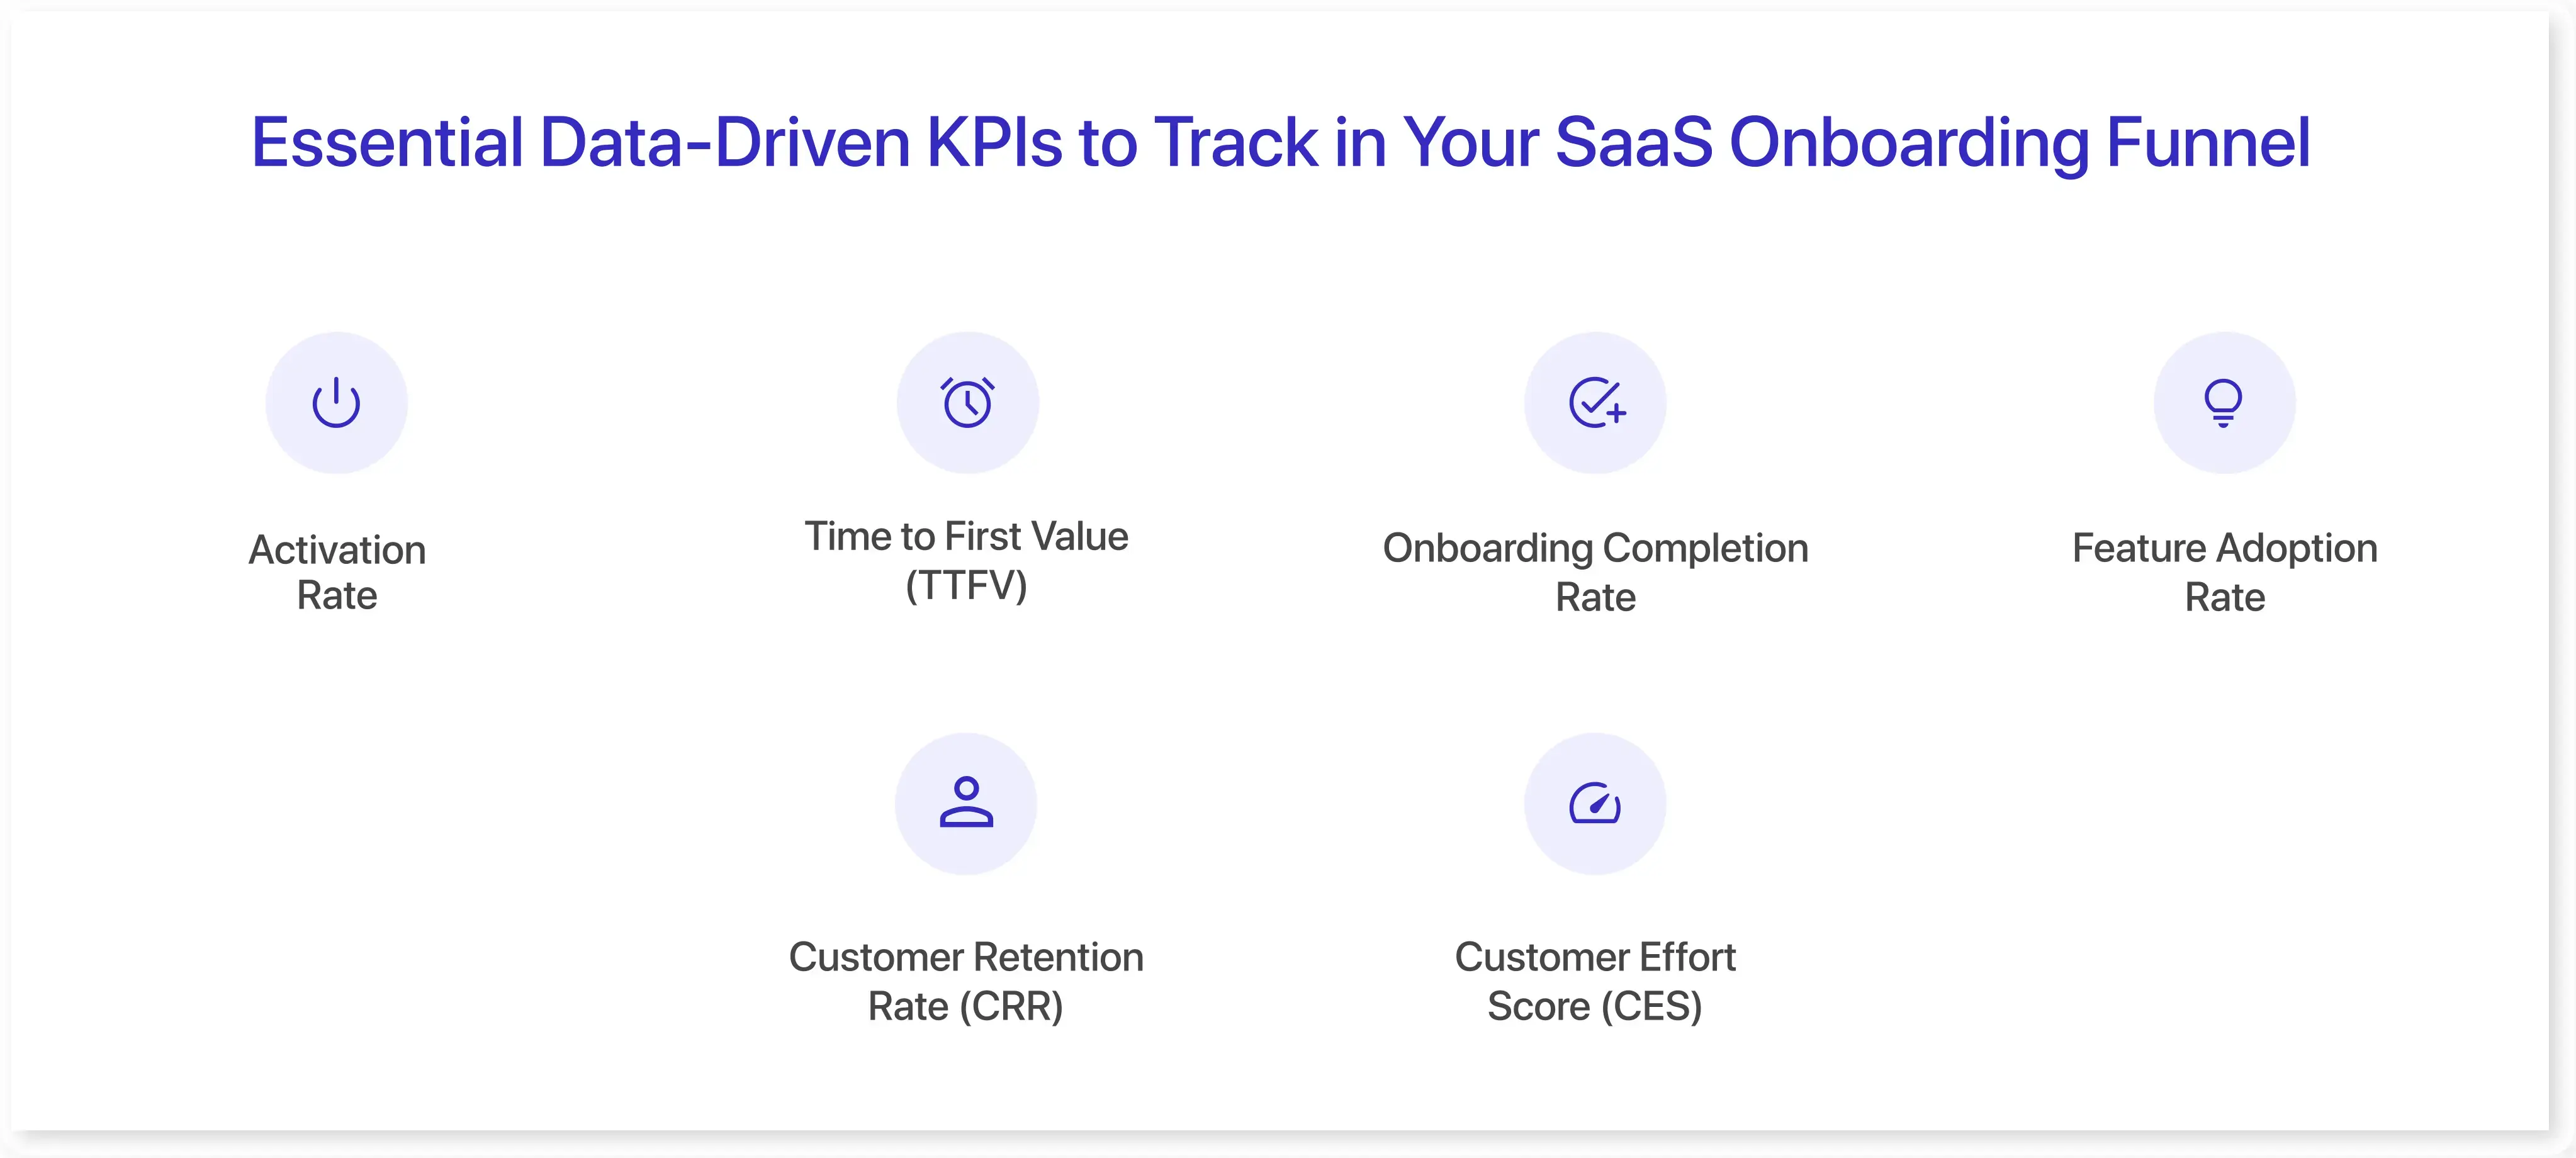
Not all metrics matter equally. Focus on the ones that show progress toward activation and retention. Here are the key customer onboarding metrics you should keep on your radar to optimise your saas onboarding funnel:
1. Activation Rate
This KPI measures the % of users who reach a meaningful milestone that signals product value. For example, creating their first project, sending an invite, or setting up an integration. A high activation rate indicates that users are quickly understanding and experiencing the core value of your product. Tracking this helps you gauge the effectiveness of your onboarding flow and pinpoint where users encounter issues before realizing the value.
2. Time to First Value (TTFV)
Time to First Value tracks how long it takes a user to experience their “aha moment”. The shorter this time, the stronger your onboarding experience will be. Reducing TTFV often involves streamlining setup steps, offering guided walkthroughs, or automating initial configurations to minimize the time-to-first-value. A fast TTFV directly correlates with higher retention and lower churn.
3. Onboarding Completion Rate
This KPI measures the number of users who complete your full onboarding flow, whether that involves finishing an in-app tutorial, checklist, or guided tour. A low completion rate often indicates friction in your process, resulting in confusing steps, lengthy forms, or unclear subsequent actions. By monitoring this SaaS metric, you can identify where users drop off and simplify the flow for smoother progression.
4. Feature Adoption Rate
The feature adoption rate indicates the percentage of activated users who go on to use key features within a given time frame. It shows whether users are engaging deeply or only scratching the surface of your product. If adoption is low, users might not understand how to use features or fail to see their relevance. Use in-app tooltips, nudges, and contextual education to encourage meaningful engagement.
5. Customer Retention Rate (CRR)
Retention is the ultimate indicator of onboarding success. A strong onboarding experience lays the foundation for users to stay longer and continue seeing value. Monitoring retention post-onboarding helps you assess whether users sustain engagement after their initial setup. High churn within the first 30 days typically indicates onboarding gaps that failed to convey product value effectively.
6. Customer Effort Score (CES)
CES is an important metric that measures how easy it is for users to complete tasks during the onboarding process. It’s typically gathered through quick in-app surveys. A low score means users find onboarding difficult or time-consuming, signaling a need for simplification. Since ease of use strongly predicts loyalty, improving CES can directly improve activation and retention.
Step-by-Step Process to Optimize SaaS Onboarding with KPIs
Optimizing your SaaS onboarding funnel means building a continuous loop of measurement, analysis, and improvement. Here are the steps to follow:
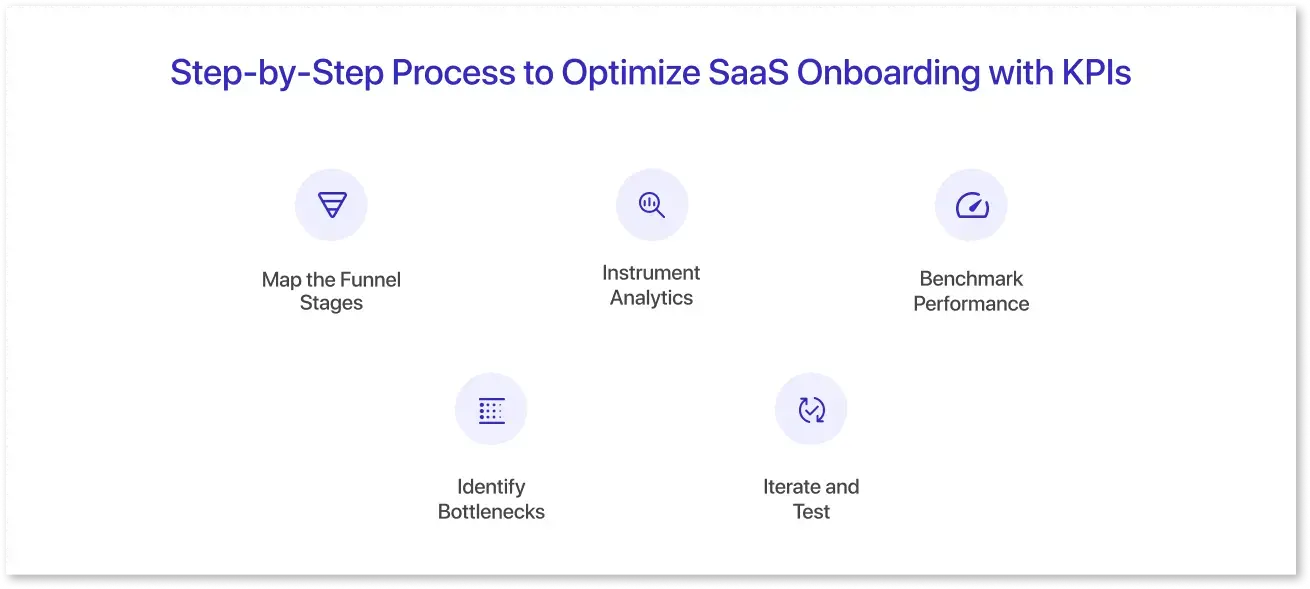
- Map the Funnel Stages: Define each step, such as sign-up, first login, first key action, activation, retention, and what success looks like, using charts and graphs. Document user intent and potential friction points at every stage so your team knows exactly where to focus optimization efforts. Tools like Mokkup.ai can help you quickly wireframe SaaS onboarding dashboards with pre-built KPI templates, making it easy to visualize the full funnel before you start optimizing.
- Instrument Analytics: Track actions across the funnel using tools like Mixpanel, Amplitude, or GA4 to gather reliable data. Ensure event tracking is consistent across platforms to avoid blind spots that could skew your onboarding metrics.
- Benchmark Performance: Establish baselines for key metrics, such as activation rate and time to value, before implementing changes. These benchmarks serve as your control data, allowing you to validate the impact of each iteration with confidence.
- Identify Bottlenecks: Look for sharp drop-offs between stages to find friction points. Complement quantitative data with qualitative insights from user recordings or feedback to identify the reasons behind drop-offs.
- Iterate and Test: Adjust flows, copy, or UI elements, then measure the impact to confirm improvement. Adopt an agile mindset by treating every optimization as an experiment, using A/B testing to validate what truly moves your SaaS KPIs. Similarly, with Mokkup.ai, you can iterate dashboard designs quickly to test different KPI combinations or onboarding flows before going live.
Best Practices for Improving Onboarding Funnel Metrics
To get the most out of your onboarding analytics, focus on these proven strategies:
- Deliver Value Fast: Reduce time-to-value by helping users achieve an immediate win within the first session. Whether it’s sending their first email campaign or integrating a key tool, quick wins boost confidence and motivation to continue exploring your product.
- Personalize Onboarding: Tailor steps based on user persona, role, or goals to make onboarding more relevant. Segmenting users and customizing onboarding paths ensures that each user sees features and flows that align with their needs, increasing engagement and activation.
- Simplify Every Step: Keep the forms concise and clicks to a minimum to create a seamless experience. Unnecessary action adds friction, so streamline sign-ups, eliminate redundant confirmations, and guide users through logical next steps.
- Leverage Guided Tours and Tooltips: Use contextual help to lead users through key actions. Interactive walkthroughs, checklists, and embedded tooltips make complex products more intuitive, reducing the need for customer support.
- Measure, Learn, Iterate: Regularly review onboarding optimization strategies and run A/B tests on flows or messages. By turning insights into experiments, you can continuously refine your onboarding funnel to improve activation, adoption, and retention rates.
Choosing Tools for KPI-Driven Onboarding Analysis
Here are some of the best platforms to help you analyze, visualize, and enhance your onboarding performance:
Mokkup.ai
Mokkup.ai enables teams to quickly wireframe and visualize onboarding dashboards without requiring design expertise. With drag-and-drop elements and AI-powered generation, you can create KPI dashboards in minutes, helping you plan and communicate funnel improvements before full development.
For example, their SaaS Lead Generation dashboard enables users to measure the effectiveness of their marketing plan and track the user journey to improve the conversion rate.
Mixpanel
Mixpanel enables deep analysis of user engagement and retention across your onboarding flow. It helps you track activation events, segment users, and uncover where they drop off, providing clear insight into your SaaS onboarding metrics.
Hotjar
Hotjar provides behavioral analytics through heatmaps, click tracking, and session recordings. You can see exactly how users interact during onboarding and identify friction points that block progress.
Userpilot
Userpilot helps product teams design no-code onboarding experiences, including checklists, walkthroughs, and in-app messages. It’s ideal for improving activation rates and personalizing onboarding based on user behavior.
Power BI
Power BI enables you to visualize onboarding KPIs in real-time and share insights with stakeholders. You can combine product, marketing, and support data to monitor how onboarding impacts conversion and retention. The Power BI dashboard templates can optimize reporting efficiency and present insights in a professional format.
Optimizely
Optimizely is a robust experimentation platform for testing onboarding flows, copy, or feature placements. With this platform, you can run A/B testing to validate which changes truly move your key onboarding success metrics. Its detailed analytics make it easy to connect test results to your KPIs, ensuring that every improvement is backed by data, not guesswork.
Common Mistakes and How to Avoid Them
Even experienced teams slip up when optimising their saas onboarding metrics. Here are common pitfalls:
- Tracking Too Many Metrics: Focus on 5–7 core KPIs that clearly link to activation and retention. Tracking too many metrics can create confusion, so only track the ones that directly align with your business goals.
- Ignoring User Segmentation: Instead of looking at overall numbers, break down your data by user type, subscription plan, or acquisition source. For example, free trial users may drop off for different reasons than enterprise customers.
- Overcomplicating Onboarding: Long or confusing setups reduce user interest. Keep it simple and show quick wins early. The faster users reach their first success, the more likely they are to continue.
- Neglecting Qualitative Feedback: Combine data with direct feedback from users to understand why problems happen. Simple surveys or short interviews can reveal issues that numbers alone can’t show.
- Treating Onboarding as a “One-Time” Event: Onboarding should evolve with your product. Update your flows often so users can learn about new features and stay engaged.
Future Trends in Data-Driven SaaS Onboarding Optimization
The future of SaaS onboarding funnels lies in automation, personalization, and predictive analytics. As AI tools mature, companies can create onboarding flows that dynamically adjust to users' behavior in real-time. For instance, predictive models will soon identify which users are most likely to churn during onboarding, allowing proactive interventions through automated nudges or personalized tutorials.
By embracing these advancements early, SaaS teams can future-proof their onboarding optimization strategies and build experiences that learn, adapt, and retain users automatically.
Conclusion
Optimizing your SaaS onboarding funnel is not just about smoother sign-ups; it’s about building long-term user confidence and reducing churn from the very beginning. By tracking the right SaaS onboarding metrics, setting clear goals, and continuously refining your onboarding process, you can turn first-time users into loyal customers. If you want to visualize your onboarding KPIs and funnel journeys more clearly, try Mokkup.ai’s onboarding dashboard wireframes for instantly bringing your data-driven onboarding ideas to life.
Frequently Asked Questions
SaaS onboarding funnel is the structured journey users take from signup to activation and retention. Each stage measures engagement and drop-off points in your SaaS product.
Simplify the process, guide users to value faster, personalize flows, and continuously measure performance using SaaS onboarding metrics.
Activation rate, time to value, completion rate, feature adoption, and early churn rate are the most impactful onboarding success metrics.
There’s no fixed length, but best practice is: as short as possible to achieve the key value, avoid unnecessary steps, and aim for rapid activation. The shorter the time to value, the lower the drop-off.
Tools that help optimize onboarding flows include analytics platforms like Mixpanel or Amplitude for tracking user behavior, engagement tools like Appcues or Userpilot for guiding users, and visualization tools like Mokkup.ai for quickly wireframing and testing data-driven onboarding dashboards before implementation.
Prompt it. Wireframe it with Mokkup.ai.
