In the modern business landscape, data-driven decision-making has become paramount to success. Key Performance Indicators (KPIs) have emerged as crucial metrics to track and evaluate an organization's performance effectively. KPIs are specific, measurable, and quantifiable indicators that reflect the performance of essential aspects of a business, such as revenue, customer satisfaction, productivity, and more.
However, with the ever-increasing volume of data, simply having KPIs is not enough. To derive meaningful insights and make informed decisions, businesses require a visually intuitive tool to monitor and analyze these key metrics effectively. Enter the KPI dashboard: which is a visual representation of key performance indicators (KPIs) that helps businesses track their progress toward their goals.
If you are looking for a way to improve your business's performance, then a KPI dashboard is a great place to start. In this blog post, we will discuss what KPI dashboards are, how they work, and the benefits of using them. We will also provide some tips for creating an effective KPI dashboard.
Table of Contents
- What are KPIs?
- What is a KPI Dashboard?
- Important KPI Examples for different industries
- Benefits of Using a KPI Dashboard
- Design Principles to Follow While Creating a KPI Dashboard
- How to Create the Best KPI Dashboard Using Mokkup.ai
What are KPIs?
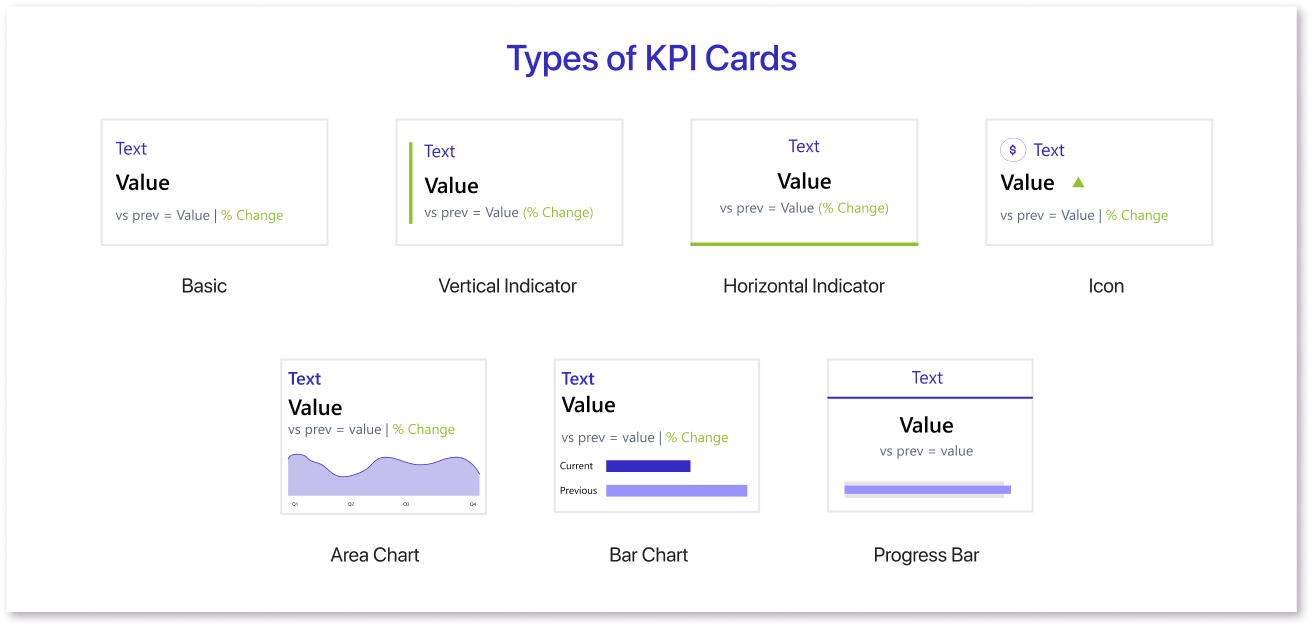
KPIs, or Key Performance Indicators, are measurable metrics that serve as essential yardsticks for evaluating the success and performance of an organization, project, or individual. These specific and quantifiable indicators reflect the progress made toward achieving strategic objectives and goals. KPIs vary across industries and departments, but they share a common purpose: to provide valuable insights into crucial aspects of business operations, such as revenue, customer satisfaction, productivity, and efficiency. By regularly tracking and analyzing KPIs, businesses can identify strengths, weaknesses, and areas for improvement, allowing them to make informed decisions and stay focused on achieving their desired outcomes.
What is a KPI Dashboard?
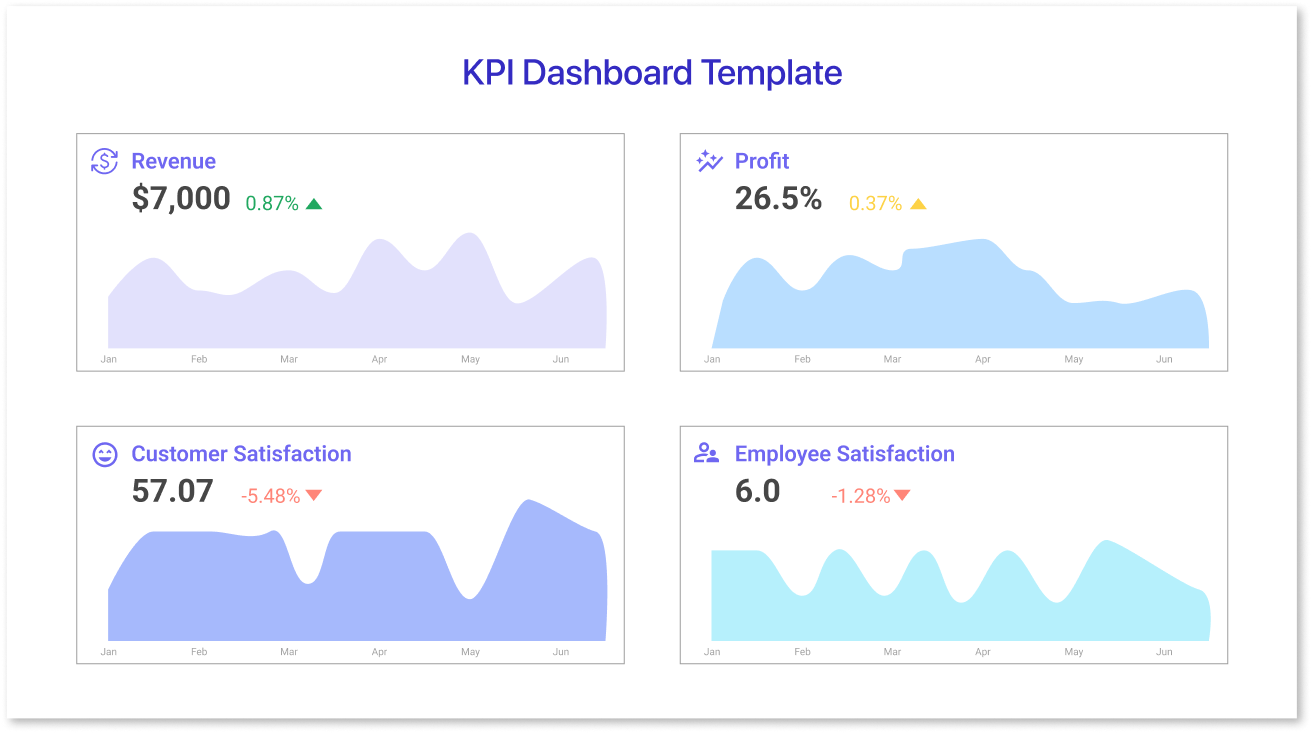
A KPI dashboard is a centralized and interactive data visualization platform designed to provide stakeholders, executives, and decision-makers with a bird's-eye view of the company's performance. Through intuitive charts, graphs, tables, and other graphical elements, a KPI dashboard simplifies complex data, allowing users to monitor trends, spot patterns, and identify areas that need attention or improvement.
This comprehensive snapshot of KPIs allows users to track progress toward strategic goals, identify performance bottlenecks, and respond swiftly to changing market conditions. The dashboard provides real-time updates, eliminating the need for manual data compilation and analysis, saving time, and ensuring accuracy.
Additionally, KPI dashboards are highly customizable, enabling organizations to tailor them to their specific needs and industry. They can be designed to encompass various departments, projects, or individual contributors, fostering transparency and data-driven culture within the organization.
Important KPI Examples for different industries
1) E-Commerce:
Several essential business KPIs are utilized to monitor and optimize performance. One such critical metric is the Conversion Rate, which indicates the percentage of website visitors who complete a desired action, such as making a purchase. Another vital KPI is Customer Lifetime Value (CLV), which helps evaluate the long-term profitability of each customer. Additionally, Average Order Value (AOV) provides insights into the average spending per transaction. Moreover, the Cart Abandonment Rate is a key indicator of the effectiveness of the checkout process. By visualizing these metrics, sellers can quickly identify sales trends, spot underperforming areas, and optimize their sales strategies.
2) Transport:
KPIs play a pivotal role in measuring the performance and efficiency of the transport industry. One crucial metric is On-Time Performance, which tracks the punctuality of transportation services, such as trains, buses, and flights. Another essential KPI is Fleet Utilization, which assesses the extent to which transport vehicles are being utilized effectively. Additionally, Fuel Efficiency is critical for monitoring and reducing operational costs and environmental impact. Collectively, these KPIs guide transportation providers in making informed decisions to enhance their services, reduce costs, and ensure the smooth movement of people or goods.
3) Restaurant:
In the restaurant industry, Key Performance Indicators (KPIs) are essential for measuring success and identifying areas for improvement. One vital metric is the Table Turnover Rate, which measures how quickly tables are cleared and reset for new customers, directly impacting revenue. Additionally, Customer Satisfaction and Net Promoter Score (NPS) provide insights into the overall guest experience and their likelihood to recommend the restaurant to others. Average Ticket Size helps gauge the average amount spent by each customer, aiding in revenue optimization. Moreover, Food Cost Percentage monitors the cost of ingredients compared to menu prices, ensuring profitability.
4) Healthcare:
In the healthcare industry, KPIs are used for assessing the quality of care and operational efficiency. One of the metrics is the Patient Satisfaction Score, which measures the level of satisfaction and experience of patients during their treatment and stays. Another essential KPI is Patient Wait Time, which evaluates the time taken from check-in to receiving care, directly impacting patient experience. Additionally, the Hospital Readmission Rate helps monitor the effectiveness of treatments and post-discharge care. Bed Occupancy Rate measures the utilization of hospital resources, ensuring optimal use of facilities. Moreover, the Average Length of Stay provides insights into patient care and resource allocation. Healthcare facilities also track Infection Control and Hand Hygiene Compliance to maintain high patient safety standards.
5) Law:
In the law industry, KPIs help in evaluating the effectiveness of legal practices and ensuring client satisfaction. One vital metric is the Case Success Rate, which measures the percentage of cases won or settled in favor of the client. Additionally, the Client Retention Rate reflects the ability to retain and satisfy existing clients, indicating the quality of legal services provided. Another important KPI is Billable Hours, which assesses the productivity and utilization of lawyers' time. Turnaround Time for legal documents and contracts helps gauge the efficiency of the legal team. Client Feedback and Reviews provide valuable insights into the client's perception of the firm's services. By focusing on these KPIs, law firms can optimize their performance, enhance client relationships, and ultimately achieve greater success in the legal landscape.
Benefits of Using a KPI Dashboard
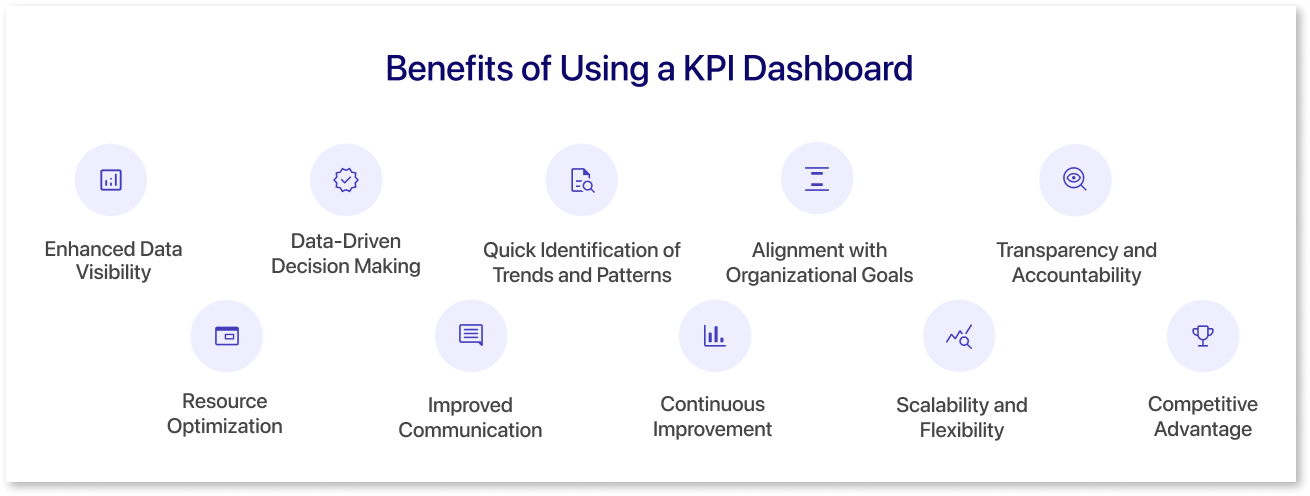
Using a KPI dashboard offers numerous benefits to organizations, helping them make informed decisions, improve performance, and achieve their strategic objectives. Some of the key benefits of using a KPI dashboard include:
- Enhanced Data Visibility: KPI dashboards provide a clear and real-time view of key performance metrics, making complex data more accessible and understandable to stakeholders at all levels.
- Data-Driven Decision Making: By presenting critical KPIs in an intuitive format, dashboards empower decision-makers to base their choices on data and insights rather than gut feelings, leading to more effective and strategic decision-making.
- Quick Identification of Trends and Patterns: Dashboards allow users to identify trends, patterns, and correlations within data quickly, helping them uncover valuable insights and opportunities for improvement.
- Alignment with Organizational Goals: KPI dashboards ensure that teams and departments are aligned with overarching organizational goals, fostering a culture of collaboration and accountability.
- Transparency and Accountability: KPI dashboards promote transparency by making critical metrics visible to all stakeholders, fostering a sense of ownership and accountability among employees.
- Resource Optimization: By analyzing performance metrics, organizations can optimize resource allocation, ensuring that time, budget, and effort are focused on the most impactful areas.
- Improved Communication: Dashboards offer a visual and standardized representation of data, facilitating communication between teams and stakeholders and eliminating confusion arising from different interpretations of data.
- Continuous Improvement: Regularly reviewing KPIs on the dashboard allows organizations to identify areas for improvement, set benchmarks, and track progress over time, supporting a culture of continuous improvement.
- Scalability and Flexibility: KPI dashboards can be customized to suit specific needs, accommodating various departments and changing business requirements as the organization grows.
- Competitive Advantage: By utilizing data-driven insights from KPI dashboards, organizations can gain a competitive edge by responding quickly to market trends and customer needs.
Design Principles to Follow While Creating a KPI Dashboard
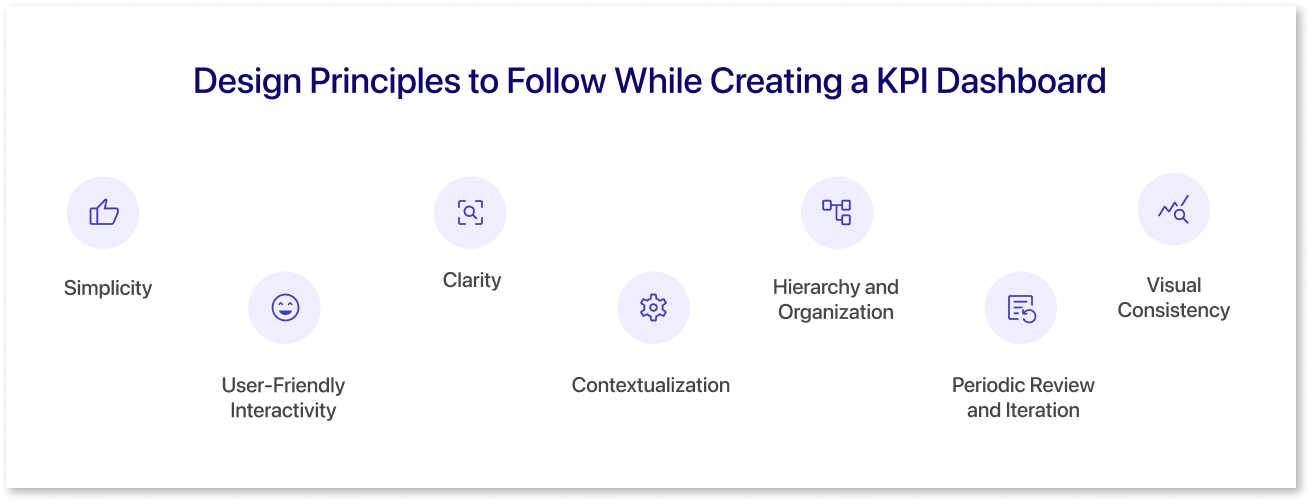
Effective KPI dashboard design is essential to ensure that the information is presented in a clear, concise, and meaningful manner. Here are some key principles to consider when designing a KPI dashboard:
- Simplicity: Keep the design simple and avoid visual overload. Use clean and intuitive data visualizations that are easy to understand at a glance without requiring extensive explanations.
- Clarity: Use clear and concise labels, titles, and descriptions for each KPI to ensure that users can quickly grasp the meaning and context of the data presented.
- Hierarchy and Organization: Organize KPIs in a logical hierarchy and group related metrics together. This helps users to navigate the dashboard effortlessly and locate information based on their specific needs.
- Visual Consistency: Maintain consistency in the visual elements throughout the dashboard, such as color schemes, fonts, and iconography. Consistency fosters familiarity and improves user experience.
- User-Friendly Interactivity: Incorporate interactive features, such as drill-down options, filters, and tooltips, to allow users to explore data and gain deeper insights from the dashboard.
- Contextualization: Provide context for KPIs by including trend lines, historical data, or benchmarks. Context helps users understand the significance of the current data and how it relates to past performance or industry standards.
- Periodic Review and Iteration: Regularly review and iterate the dashboard design based on feedback and changing business needs. Continuously improve the dashboard to maximize its effectiveness.
How to Create the Best KPI Dashboard Using Mokkup.ai
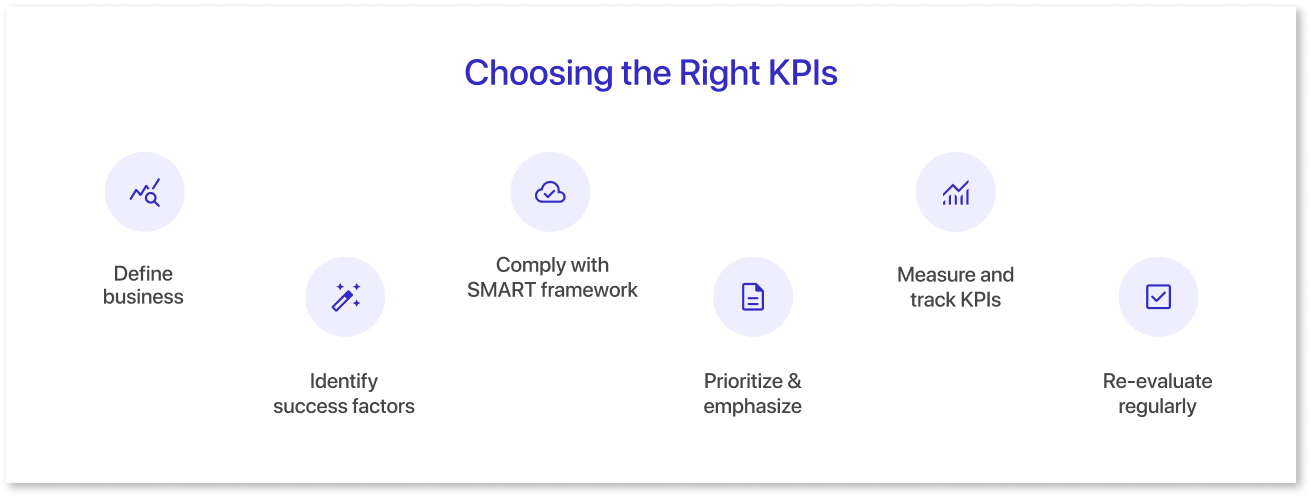
Here are some tips on how to create the best KPI dashboard using Mokkup.ai:
- Start by defining your KPIs: What are the most important metrics for your business? What do you need to track in order to make informed decisions? Once you know your KPIs, you can start to create visualizations that will help you track them effectively.
- Design your dashboard: Mokkup.ai makes it easy to design your dashboard using a drag-and-drop interface. You can choose from a variety of pre-made dashboard templates or create your own custom dashboard.
- Add interactive elements: Mokkup.ai allows you to add interactivity to your dashboards so that you can drill down into the data and see more detail. This is a great way to understand the trends and patterns in your data.
- Share your dashboard: Once you're happy with your dashboard, you can share it with others. Mokkup.ai makes it easy to share your dashboard in various ways, including PDF, PNG, or JPEG.
Here are some additional tips:
- Use clear and concise labels for your KPIs.
- Use colors and icons to make your dashboard visually appealing.
- Keep your dashboard simple and easy to understand.
- Update your dashboard regularly with new data.
By following these tips, you can create a operations KPI dashboard that is both informative and visually appealing.
Here are some examples of KPIs that you could track on your dashboard:
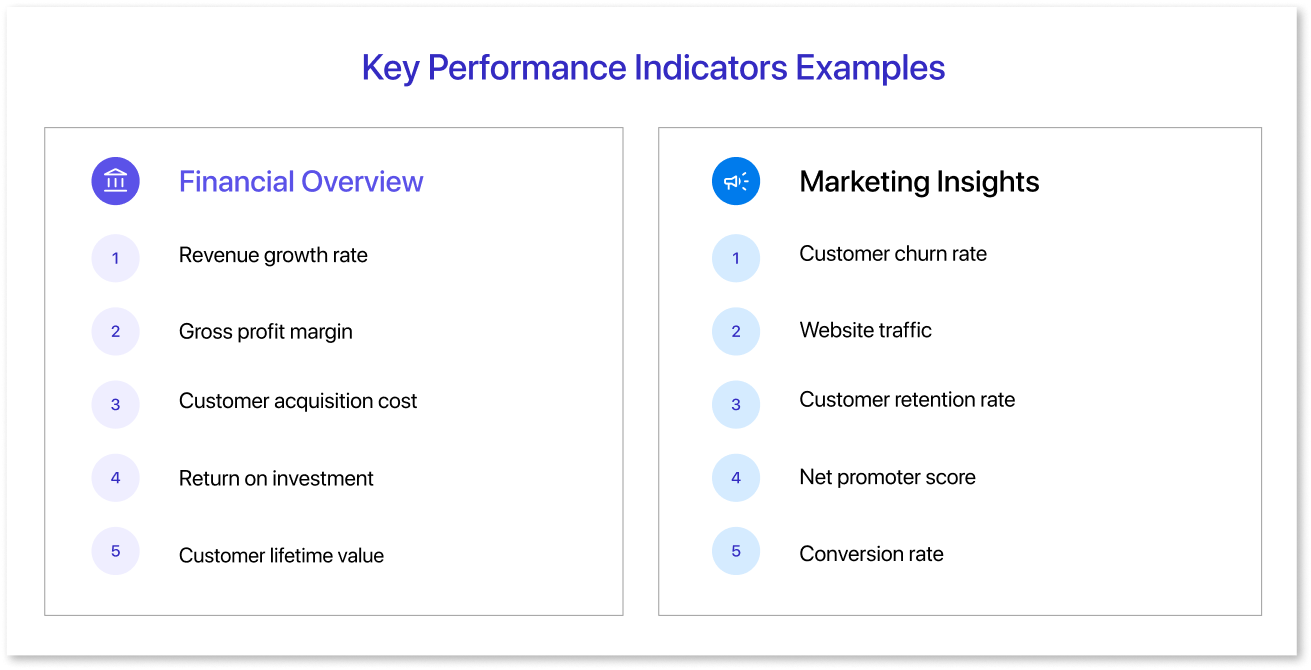
- Sales: Number of leads generated, number of sales closed, average sales value, customer lifetime value
- Marketing: Website traffic, click-through rate, conversion rate, social media engagement
- Operations: Order fulfillment time, customer satisfaction score, employee productivity
- Finance: Revenue, expenses, profit margin, cash flow
The specific KPIs that you track will depend on your business goals and objectives. However, by tracking the right KPIs, you can gain valuable insights into your business performance and make informed decisions that will help you achieve your goals.
Conclusion
In conclusion, KPI dashboards are a powerful tool that can help you track your business performance and make informed decisions. By presenting key metrics in a clear and intuitive manner, these types of dashboards empower stakeholders to monitor progress, identify trends, and take timely actions to achieve strategic objectives. With user-friendly interactivity and a focus on relevant KPIs, businesses can enhance transparency, accountability, and operational efficiency. By following the tips in this blog, you can create a KPI dashboard that is both informative and visually appealing.
Prompt it. Wireframe it with Mokkup.ai.
