
Have you ever felt overwhelmed by the flood of sales data you're managing, not knowing which metrics really matter? You're not alone. McKinsey, a respected research firm, has highlighted this as a significant issue: there's so much data, but without a clear focus, it's hard for sales leaders to find those crucial insights that drive confident decisions and long-term growth.
Successful sales teams rely on data to drive their success. Whether it's boosting sales, maximizing profits, growing the team, or outperforming competitors, the good news is that sales leaders have plenty of data available from systems like CRM and ERP. The challenge lies in identifying the most important data points and KPIs, understanding what they mean, and taking action to meet or exceed sales goals. One effective way to do this is by establishing clear sales KPIs.
Table of Contents
- What are KPIs in Sales?
- Why are Sales KPIs So Important?
- What are Sales Metrics Vs. Sales KPIs?
- What are The Most Important Sales KPIs?
- How do you Track Sales KPIs?
- What Sales KPI Dashboards Should You Use?
What are KPIs in Sales?
Sales KPIs are like a filter that transforms raw data into essential business metrics. They're crucial for evaluating how well an individual, team, or even the entire business is doing compared to their goals. These KPIs can include financial data, specific deal metrics, or the progress of individuals or teams. They play a key role in helping businesses assess and improve sales team performance, make the sales process smoother, and boost sales revenue.
Why are Sales KPIs So Important?
Sales teams and leaders depend on sales KPIs to track their progress toward established goals. Without these metrics, sales reps and managers may struggle to understand how effective their efforts are and whether they need to make any changes. Additionally, KPIs act as a tool for identifying emerging trends and patterns in sales performance.
By analyzing the insights provided by KPIs, sales leaders can identify the underlying factors affecting performance and develop strategies to address them. For example, if a new product is selling exceptionally well, resources can be redirected to take advantage of this success. Conversely, if a product is struggling due to competitive pricing, adjustments such as price reductions or shifting focus to other products may be necessary.
Sales KPIs also provide visibility into the activities and performance of individuals and teams, which is especially valuable when team members are located in different regions. Through regular monitoring of these metrics, managers can determine if efforts are effectively contributing to goal attainment. This careful monitoring ensures that leaders maintain a clear understanding of the business's direction.
What are Sales Metrics Vs. Sales KPIs?
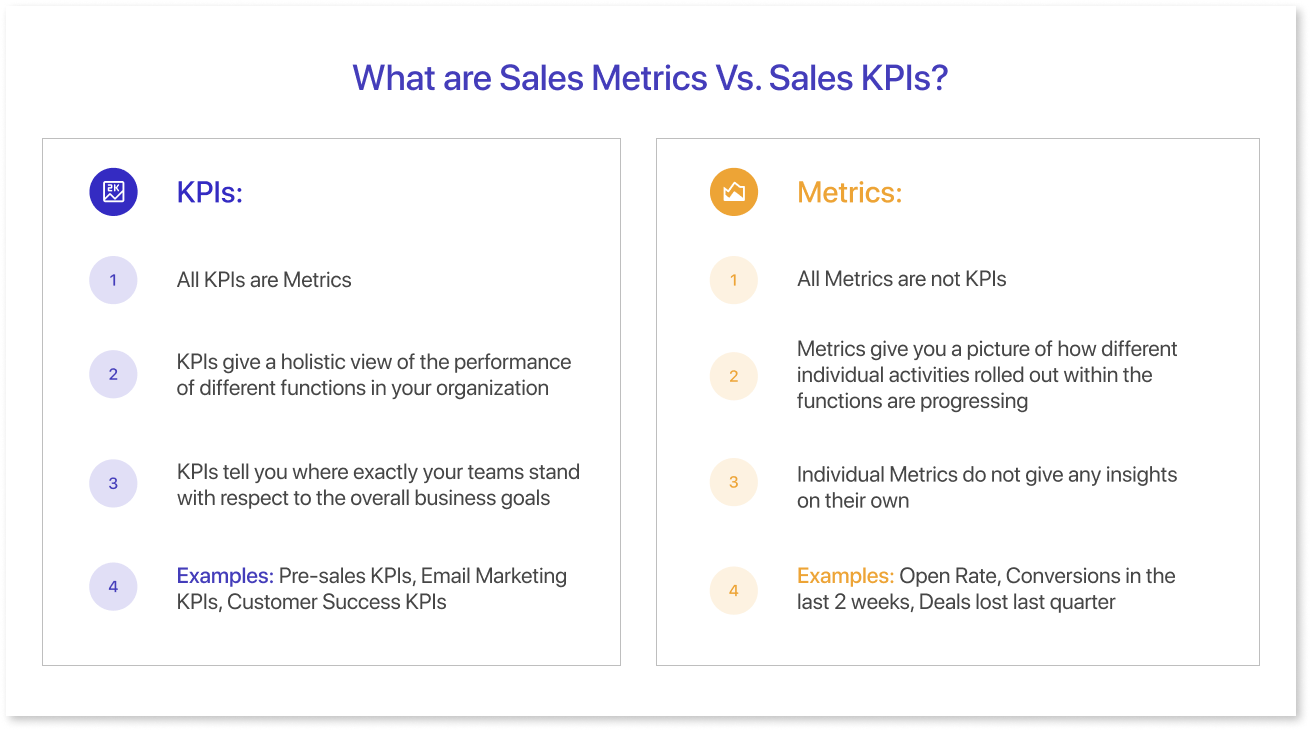
Your sales KPIs are closely linked to your sales and broader business goals. For example, if the ultimate business objective is to achieve 1,200 sales in a year, a corresponding KPI might involve reaching 100 sales each month. (100 sales per month multiplied by 12 months equals 1,200 sales)
Sales metrics cover any measurable indicator of sales performance. This could include various aspects such as the number of activities completed by sales representatives, the quantity of leads in the sales pipeline, or any other sales-related metric. The key difference is that while sales metrics provide valuable insights, they may not always directly align with overarching goals.
What are The Most Important Sales KPIs?
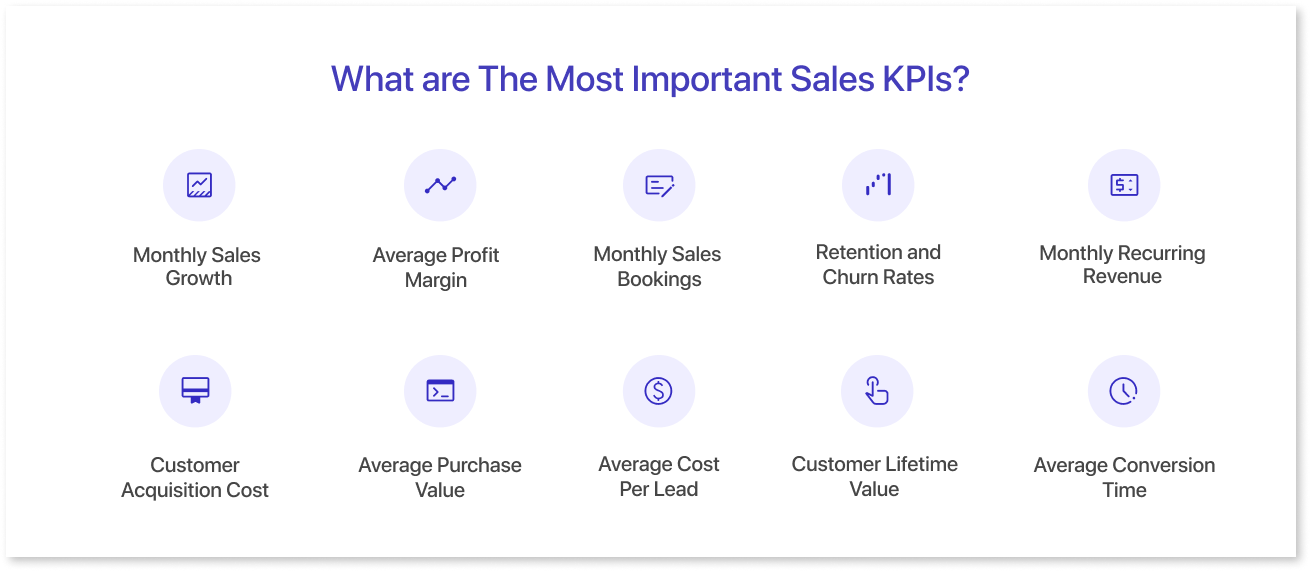
While sales KPIs should be chosen based on individual needs, certain KPIs can be effective for many businesses. Here are ten commonly applicable sales KPIs:
1. Monthly Sales Growth
A business needs to keep increasing its sales to thrive. By keeping an eye on this number on your monthly sales report, leaders can see issues early and respond to trends fast. Setting achievable goals for sales growth each month can inspire the sales team and make sure they're working in line with what the company wants.
The formula for monthly sales growth is as follows:
Monthly sales growth = ((Sales for the current month - sales for the prior month) / sales for the prior month) x 100
2. Average Profit Margin
The average profit margin shows how much of the sales revenue turns into profits, and it's a crucial financial measure. To calculate it, you subtract the costs of making the company's goods and services from the sales revenue. Companies can also look at profit margins for individual products, sales areas, and salespeople. Businesses with many products or services should keep a close eye on profit margins, especially if sales reps can set prices. You can monitor this for the overall average profit margin or for specific areas.
The formula for average profit margin is:
Average profit margin = (Net income / net sales ) X 100
3. Monthly Sales Bookings
Sales bookings measure the worth of a sale, including related expenses, during a set time frame. Software-as-a-service (SaaS) sales teams commonly rely on monthly sales bookings to gauge their successes. Leaders utilize this data to plan sales strategies and predict future performance.
The formula for monthly sales bookings is:
Monthly sales bookings = Total new bookings sales dollars for the month - (average cost per transaction x total number of bookings)
4. Retention and Churn Rates
Retention and churn rates are like two sides of a coin. Retention rate shows the portion of customers who stick around or renew their agreements for a company's stuff. It's a vital measure of how well a sales team keeps customers and keeps income flowing in regularly. When retention rates go up, it means people like what the company offers and want to stick with it.
On the other hand, the churn rate tells us the percentage of customers who decide to leave or not renew their agreements for a company's stuff. If churn rates increase, it might signal issues with what the company offers, how customers experience it, or how it's being sold. It could also be because of competition. Since it's cheaper to keep existing customers happy than to find new ones, companies watch this closely.
The formulas for retention and churn rates are:
Retention Rate= (Number of Customers at End of Period−Number of Customers Acquired During Period)/Number of Customers at Start of Period ×100%
Churn Rate = Number of Customers Lost During Period/Number of Customers at Start of Period × 100 %
5. Monthly Recurring Revenue (MRR)
Monthly recurring revenue (MRR) represents the expected steady income a company anticipates each month. New MRR signifies the extra income gained from new customers during the month. Expansion MRR indicates the additional recurring revenue derived from existing customers, typically through upgrades or expanded services. These indicators are vital for Software-as-a-Service (SaaS) or subscription-based businesses to forecast, identify new revenue streams, and assess sales growth trends.
The formula to calculate new and expansion monthly recurring revenue is:
Monthly recurring revenue (MRR) = (Average monthly revenue from total new and expanded accounts / total number of accounts) x total number of accounts that month
6. Customer Acquisition Cost
Customer acquisition cost (CAC) signifies the expense a business incurs to acquire a single new customer. These costs vary based on the business model, but considering all sales and marketing expenditures, including salaries and overhead, ensures a thorough calculation. Enhancing customer lifetime value and average revenue per customer while reducing customer acquisition costs can sustain or boost profitability.
The formula to calculate customer acquisition cost is:
Customer acquisition cost = Total sales and marketing cost/number of new customers
7. Average Purchase Value
Average purchase value assesses the typical amount customers spend on products or services, assisting in revenue improvement strategies and predicting lead value. This metric is valuable for understanding customer behavior and optimizing sales approaches.
The formula for average purchase value is:
Average purchase value = Total sales/number of customers or transactions
8. Average Cost Per Lead
Average cost per lead measures the cost-effectiveness of marketing campaigns and offers the marketing team insight into a reasonable expenditure for generating new leads. This metric can be monitored collectively for all marketing endeavors or separately for individual campaigns. When paired with the average new deal size, marketing teams can assess which lead channels attract customers with greater purchasing potential. The aim is to maintain a low average cost per lead while producing a substantial number of high-quality leads.
The formula for average cost per lead is:
Average cost per lead = Total cost of campaign/number of leads generated
9. Customer Lifetime Value
Customer lifetime value (CLV) represents the anticipated revenue a company expects to generate throughout its entire relationship with a customer. This metric is crucial for businesses to identify profitable customer segments and decide how much to invest in acquiring new customers. Calculating customer lifetime value involves several factors.
The formula for customer lifetime value is:
Customer lifetime value = Gross margin % x retention rate x average revenue per customer
10. Average Conversion Time
Average conversion time indicates the typical duration required to turn a lead into a sale. Sales managers utilize sales conversion dashboards to track this metric and assess the efficiency of the sales process. This helps in identifying which cycle lengths lead to the highest number of successful deals and evaluating the effectiveness of individual sales representatives in closing deals.
The formula to calculate average conversion time is:
Average conversion time = Total length of time to convert lead to sale / total number of new deals
How do you Track Sales KPIs?
A CRM (Customer Relationship Management) system utilizes customer and sales performance data to track progress toward sales KPIs. To aid in interpretation, many CRMs provide visualization tools or dashboards that can be tailored to the most important KPIs for your business. These dashboards offer a visual snapshot of sales and overall company health, empowering everyone, from sales representatives to leaders, to make informed decisions that contribute to revenue growth.
Additionally, dashboard wireframes can serve as a starting point for designing the layout and functionality of these visualization tools. By creating wireframes, teams can sketch out the most important KPIs, their hierarchy, and how granular they want to see data before finalizing the design. This iterative process allows for feedback and adjustments, ensuring that the dashboard effectively communicates key metrics and insights to users.
Several mockup tools can streamline your dashboard wireframing process. One such tool is Mokkup, a cloud-based dashboard wireframing tool that can further streamline the wireframing process. Mokkup offers features specifically tailored for creating mock dashboards, providing pre-built templates and elements. These elements can be dragged and dropped to create a customized wireframe, allowing you to experiment with different layouts. With Mokkup, teams can collaborate effectively and visualize how the dashboard will look before investing time and resources into full development. Moreover, dashboard wireframes facilitate collaboration among stakeholders, enabling them to align on the desired features and functionalities early in the development process.

What Sales KPI Dashboards Should You Use?
To ensure comprehensive communication across all levels, it's essential to have dashboards that offer both high-level summaries for C-suite executives and more detailed, deal-oriented insights for your sales representatives. Mokkup offers a variety of customizable templates that allow users to see standard kpis and customize to their liking.
Here are the templates we recommend for how to track sales KPIs:
1. SaaS|Lead Generation
In the competitive business landscape, the Lead Generation Dashboard prioritizes tracking the customer journey, evaluating marketing effectiveness, and managing Customer Acquisition Costs (CAC). This dashboard follows the path taken by leads to customers and provides data regarding expenses, sales, avenues, roles, and locations. It efficiently converts leads to customers by segmenting the journey, optimizing resource allocation, and emphasizing the balance in CAC expenditure for sustained growth.
2. SaaS: Sales Forecasting
The sales forecast dashboard is essential for organizing, budgeting, and managing risks in the workplace. It is indispensable for predicting total sales, enabling informed decision-making, and optimizing marketing strategies, offering a comprehensive overview of key terms and insights for short-term planning. Businesses can leverage this tool to make educated decisions, adapt to market dynamics, and ensure long-term growth.
3. E-commerce|Geographical Analysis
The dashboard makes it easier to accomplish goals, including determining system efficiency, comprehending regional sales e-commerce trends, establishing region-specific marketing and price strategies, observing product purchase trends, and evaluating client satisfaction.
Pricing and marketing tactics are informed by insights from AOV comparisons. Applying successful strategies in comparable regions requires identifying the top revenue-generating cities. The tracking of refund and return rates identifies areas where order handling needs to be improved.
4. E-commerce|Multi-Channel Analytics
The Multi-Channel E-commerce Dashboard assists companies in maximizing the potential of the digital market by growing their customer base and income. It gives a thorough perspective of all transactions, from sales to inventories, and it enables channel-specific sales trend analysis to boost efficiency. Emphasizing key metrics, it facilitates strategic decision-making for informed, channel-based plans that enhance consumer satisfaction and drive business growth.
5. Website Health
The Website Health Dashboard is a powerful template for monitoring and improving overall website functionality and user experience, introducing key metrics such as Domain Rating and Bounce Rate. These metrics provide insights into website prominence, user engagement, load times, content effectiveness, and user pathways, enabling businesses to positively impact organic search results and enhance the online user experience. Regularly checking and improving the Dashboard helps businesses stay strong online by keeping track of their performance and making necessary adjustments to attract and retain customers.
Summing Up
In summary, tracking these 10 key performance indicators offers invaluable insights into your sales team's success. From lead conversion rates to customer satisfaction, each metric provides a snapshot of performance and areas for improvement. By consistently monitoring these KPIs, you can drive growth and optimize strategies for long-term success.
Frequently Asked Questions
Revenue growth, conversion rate, average deal size, and customer acquisition cost are among the most crucial sales KPIs to track.
Assess performance using metrics like quota attainment, win rate, sales cycle length, and overall revenue contribution.
Leading indicators predict future outcomes (like pipeline value), while lagging indicators reflect past performance (like closed deals).
Ideally, track 5–10 focused KPIs that align with business goals and provide actionable insights.
Benchmarks vary by sector; for example, SaaS teams often target conversion rates of 20–30%, while retail focuses on sales per employee or transaction volume.
Review KPIs monthly for performance trends and quarterly for strategic adjustments.
Pipeline value, lead response time, and opportunity win probability are strong predictors of future revenue.
Divide the number of closed deals by the total leads generated, then multiply by 100 to get the percentage.
Prompt it. Wireframe it with Mokkup.ai.
