Today, getting an edge in the market requires more than just data collection, which indeed demands actionable insights. According to the latest report by Dresner Advisory Services, 65% of organizations found real-time data access to be a critical factor in running operations smoothly. This gives rise to the use of real-time business intelligence dashboards, which are powerful tools to turn raw business data into compelling insights that drive strategic decisions.
These BI tools are comprehensively developed to monitor key metrics when they occur, providing a wholesome view of customer behavior or sales performance. By representing visual summaries of complex data, these dashboards can facilitate better agile responses by identifying trends and patterns.
Read this blog to learn how these business intelligence tools enable real-time business insights and transform data analytics.
Table of Contents
- What are Business Intelligence Dashboards?
- Benefits of Real-time Business Intelligence Dashboards
- Case Studies: How BI Dashboards Are Used in Different Industries
- Business Intelligence Platform Best Practices
What are Business Intelligence Dashboards?
Using spreadsheets can be cumbersome for deriving insights while we navigate the complexities of data. Business intelligence data dashboards come into the picture to free up the chaos of spreadsheets. These dashboards can revolutionize data analysis by integrating information from multiple sources and bringing a unified view of business operations, streamlining decisions to a greater extent.
Using interactive elements like charts, graphs, tables, and maps, analysts can create compelling visual storytelling that improves information retention. This can help them gain insights into business intelligence, identify trends and patterns, and diagnose business problems by deep-diving into them.
Here are some essential features of BI dashboards:
- Includes relevant key performance indicators (KPIs) that help monitor the progress towards the goal.
- Uses interactive components like charts and graphs to make comprehension easier.
- Dashboards can be customized to a specific department or industry.
- Includes dynamic filtering capabilities to drill down into a particular segment.
Benefits of Real-time Business Intelligence Dashboards
BI dashboards are decision-making accelerators that can bring tangible benefits to the business. Here are some of them:
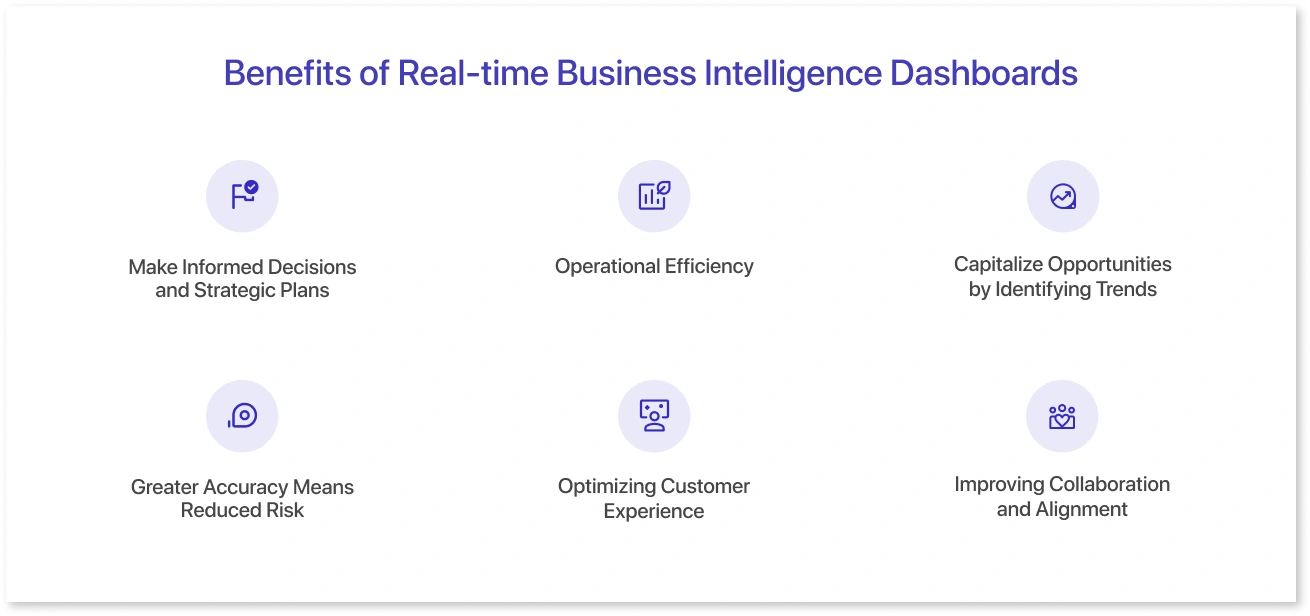
1. Make Informed Decisions and Strategic Plans
Leading organizations use real-time reporting tools to make data-driven decisions on every aspect of business operations. These tools can feed managers with live data, providing instant visibility to key metrics. Businesses can also employ robust strategies based on historical data and market trends, which inform long-term objectives or initiatives. Being aware of potential changes can empower businesses to make resilient strategic plans.
2. Operational Efficiency
In a world where optimized workflows are key to achieving long-term gains, business intelligence dashboards are here to make a difference. These data visualization tools or software can provide up-to-date information about operational activities, enabling teams to respond to changes like sudden spikes or inventory shortages swiftly. They can also avoid disruptions and optimize operational performance.
3. Capitalize Opportunities by Identifying Trends
BI dashboards can help organizations review trends and patterns that might otherwise be invisible in raw data. Positive trends can help realize profits, while negative trends can alert organizations to areas requiring immediate attention. By manipulating massive amounts of data, such dashboards can help you plan, forecast, and budget, which can be an incredible way to stay ahead of the curve.
4. Greater Accuracy Means Reduced Risk
Relying on obsolete data can cost you errors. With business intelligence tools or dashboards, you can minimize the risk of inaccurate data, as the figures are the latest only. In order to achieve the maximum ROI from the dashboard, you can get accurate access to data, which provides insights that are helpful in making decisions backed by real-time data.
5. Optimizing Customer Experience
With dashboard metrics visualization, businesses can track real-time customer interactions and behaviors to personalize customer experiences. This way, you can better understand your end-user, thereby reducing churn rate, which can help you build customer loyalty and satisfaction. Now, you can respond to customer issues promptly and develop a sustainable relationship with them.
6. Improving Collaboration and Alignment
Real-time business intelligence dashboards can provide a single source of truth for stakeholders, keeping everyone on the same page. This ensures that all employees are working together by harnessing live information with reduced data silos. For example, the Power BI dashboard templates help communicate insights and improve the collaboration between the BI developers and the respective teams.
Case Studies: How BI Dashboards Are Used in Different Industries
Interactive dashboards for business intelligence have become mission-critical across industries, enabling them to make smarter business decisions at every step of the way. Here is how different industries or sectors are leveraging Mokkup.ai’s templates to get the insights they need:
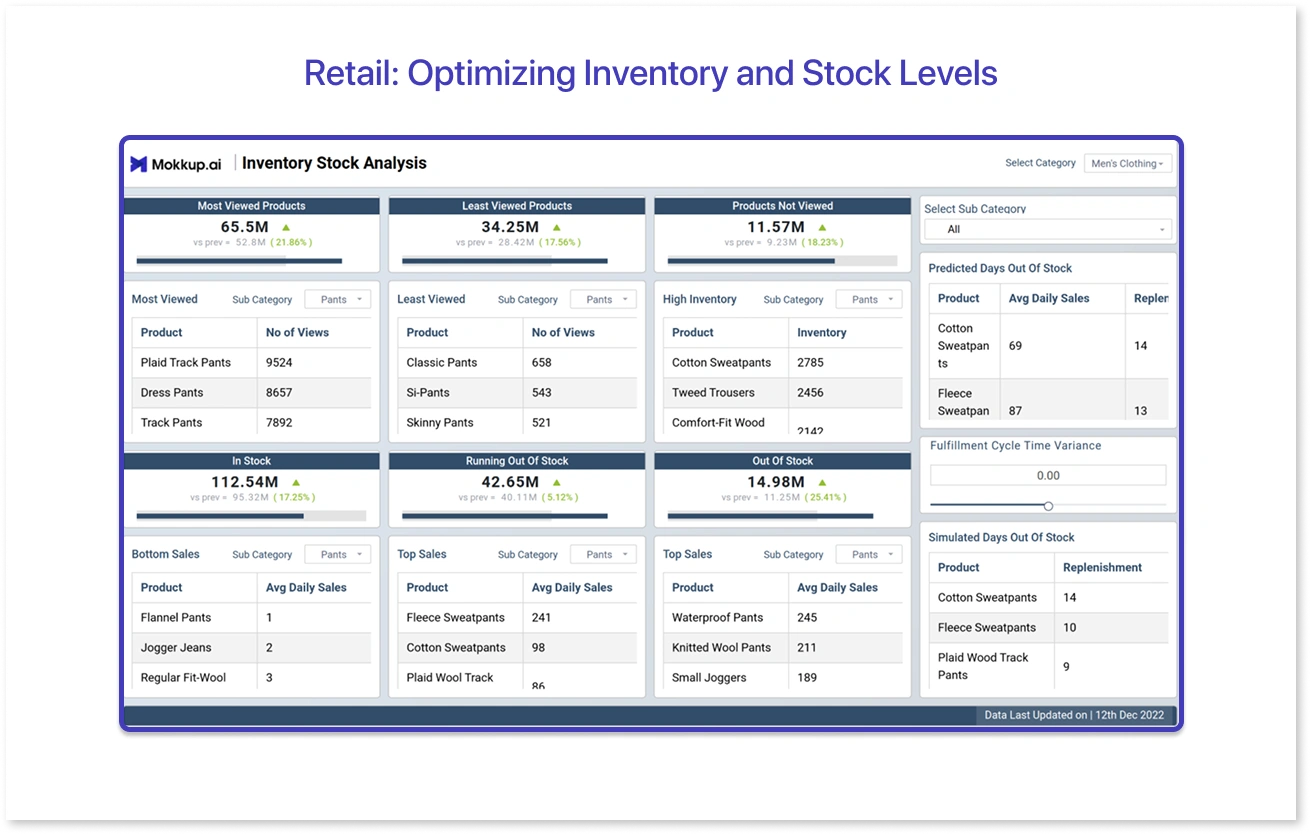
1. Retail: Optimizing Inventory and Stock Levels
The Inventory Stock Analysis dashboard by Mokkup gives businesses an overall overview of essential stock-related KPIs for managing inventory. For example, a fashion retailer integrated this dashboard template to dive deeper into stock levels. They had caused an 18% reduction in stockouts and optimized the supply chains to boost operational efficiency.
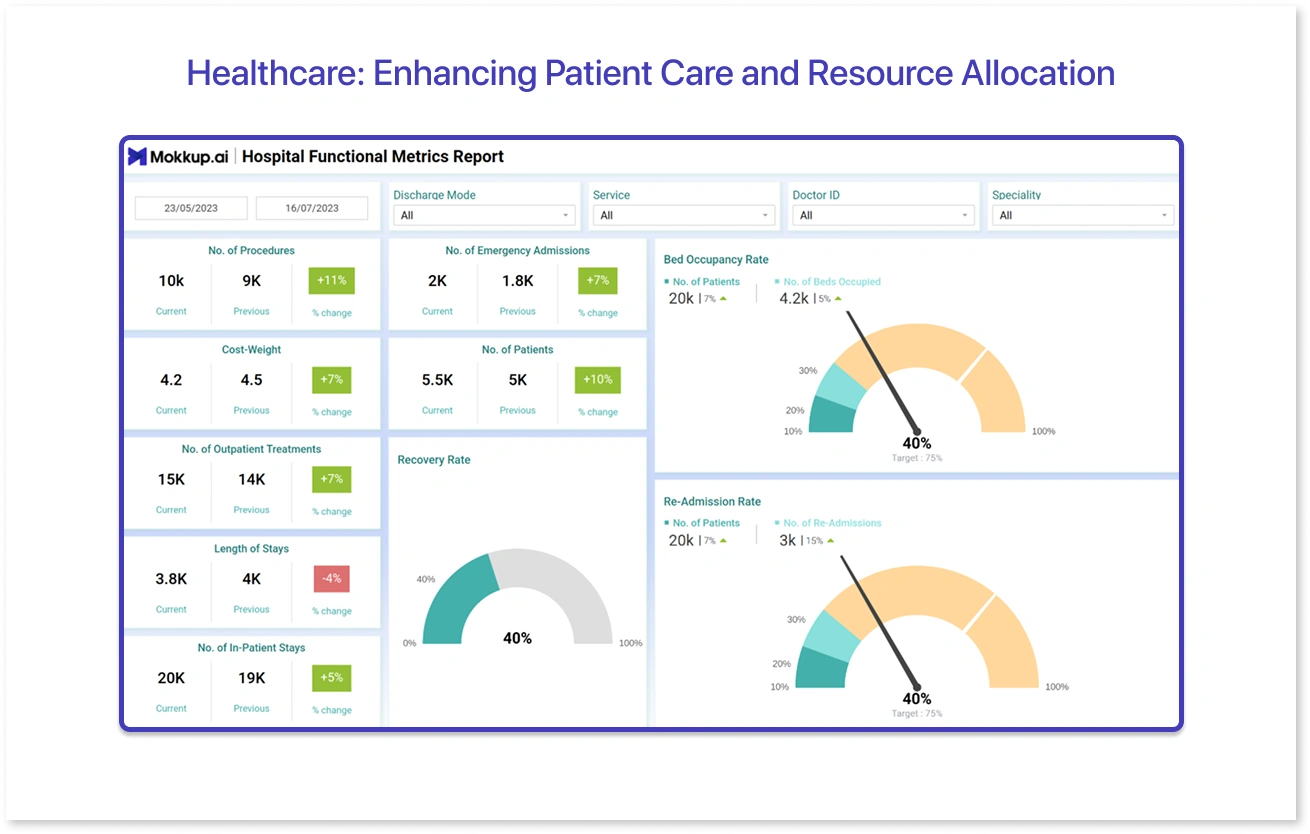
2. Healthcare: Enhancing Patient Care and Resource Allocation
A multi-location hospital has used the Hospital Functional Metrics Report to monitor patient admissions, wait times, bed occupancy, and treatment outcomes. As a result, hospital professionals improved their emergency response times and thereby improved care delivery. With real-time insights on staff occupancy, this BI dashboard helped allocate resources for an optional staff deployment.
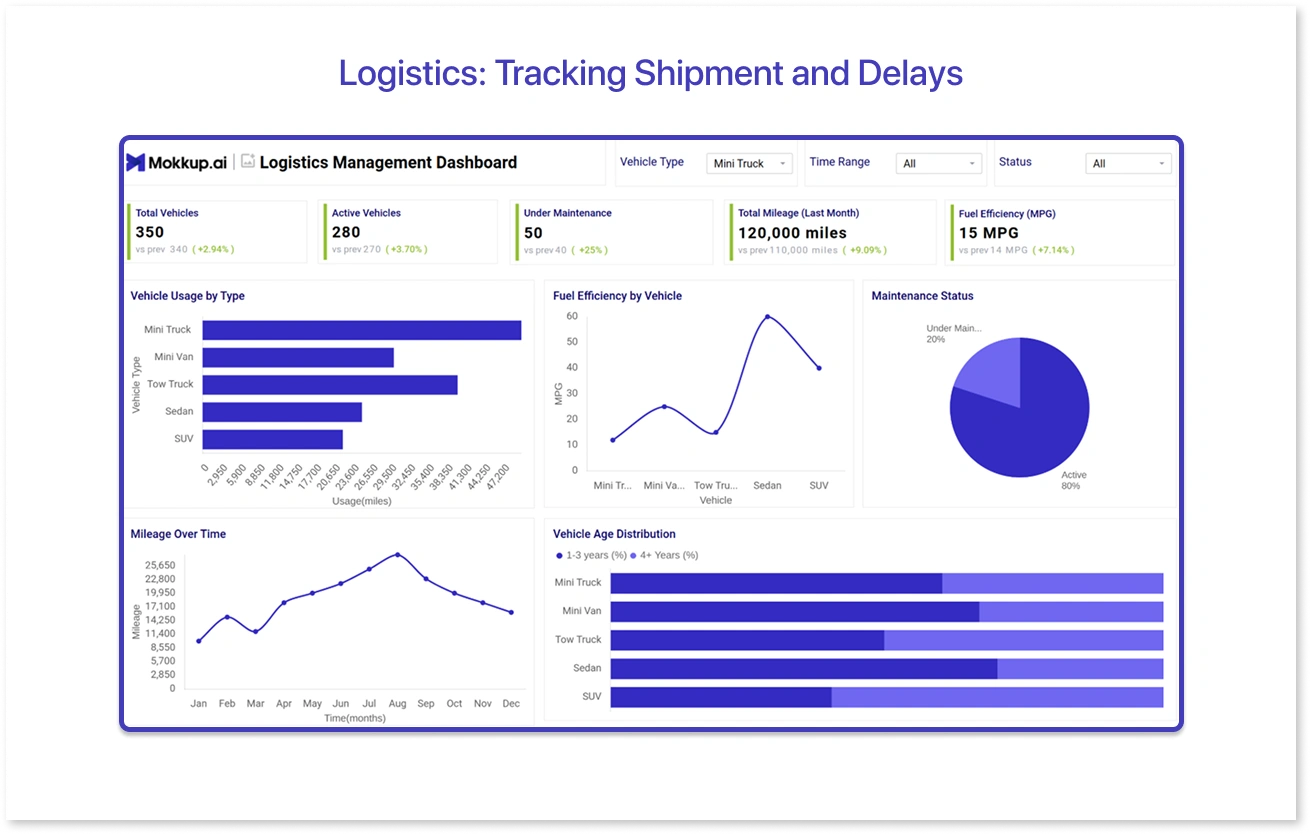
3. Logistics: Tracking Shipment and Delays
Mokkup deployed the logistics management dashboard for a mid-sized logistics company to track shipments and improve estimated delivery times. The dashboard wireframe provided a detailed overview of fleet performance, maintenance status, and vehicle usage. The purpose was to reduce transportation costs while facilitating a 20% improvement in on-time deliveries.
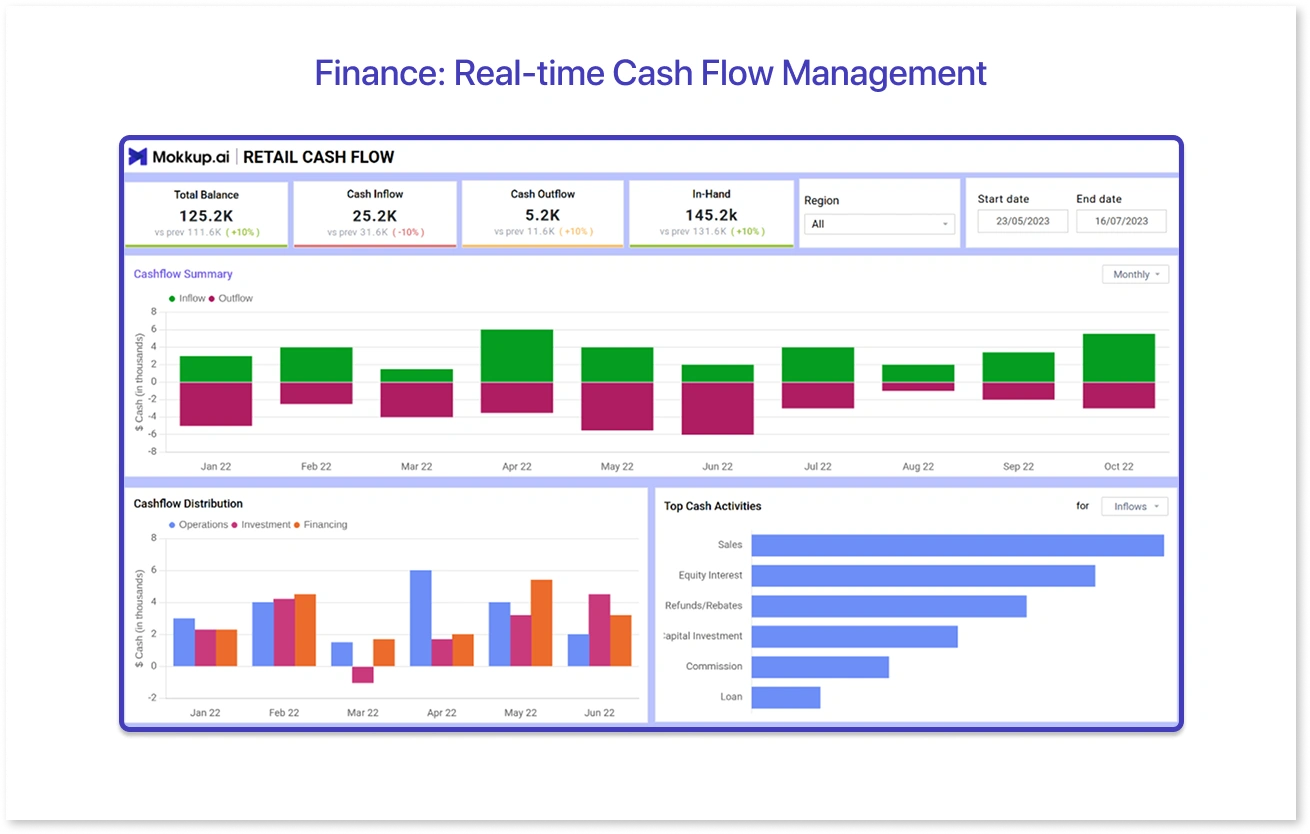
4. Finance: Real-time Cash Flow Management
A mid-sized financial services firm implemented a real-time cash flow planner dashboard to track cash inflows, outflows, and liquidity positions across business units. The dashboard template involves total cash inflows and outflows balances, liquidity trend, and bank account summary, giving an accurate snapshot of the financial summary, including upcoming obligations and potential pitfalls. With the real-time visibility, CFOs improved working capital efficiency by 22% with better investment and expense planning.
Business Intelligence Platform Best Practices
While the key is to leverage the right insights, implementing a BI platform with careful planning is paramount. Here are four best practices that you can consider:
- Goal Alignment: First and foremost, organizations have to understand the BI dashboard's objective and ensure it aligns with the business goal. Likewise, the dashboard can provide relevant insights for accommodating strategic decision-making. Know what KPIs or metrics matter more to the organization and start tracking them.
- Data Quality Management: When choosing a business intelligence platform for reporting, you should seek expertise in data quality management. This involves implementing data governance practices such as duplicacy identification, accuracy checks, and other stewardship programs that deliver end-to-end accuracy for reliable insights.
- Promoting User Adoption: The effectiveness of BI dashboards depends on how easily the team uses them to analyze insights. Comprehensive training is required to help them interact with the dashboard, which indeed develops a data-driven culture. This will maximize their comfort while using BI tools and improve the likelihood of dashboard adoption.
- Continuous Monitoring and Improvement: Your BI dashboard must be relevant to the market. To sustain in the competitive landscape, you need to monitor it and make necessary improvements. This can take place via feedback gathering, research on new technologies, and embracing agile methodologies.
Key Takeaways
Today, real-time business intelligence is vital for revolutionizing businesses by enabling them to be agile and responsive. Business intelligence dashboards are here to make your strategy planning more effective by aligning goals with data. They can provide accurate insights on every aspect of business so that you are well prepared for the decisions that drive success. Likewise, many forward-thinking companies rely on real-time analytics powered by BI dashboards, which is necessary to stay in the data-driven world.
Frequently Asked Questions
BI dashboards are generally connected with live data sources that ensure that captured data is reflected at frequent intervals. This can lead to interactive visualizations backed by real-time insights, enabling businesses to respond to changes when they happen.
A business intelligence dashboard is a visual tool that comprises relevant KPIs and visual elements to make data centralized and easy to understand. When you connect it with live data sources like CRMs, ERPs, or cloud databases, it pulls data automatically and gives an overview of changes and trends.
Real-time insights are crucial as they allow a swift response to changing market conditions and customer behaviour. They eliminate the reliance on outdated reports and give clarity on what’s happening currently, significantly improving decision-making.
An effective BI dashboard includes key features like user-friendly design, real-time data updates, customizable layout, data integration, drill-down capabilities, and clear KPIs or metrics.
Yes, small businesses can use BI dashboards without breaking the bank. It is because they are generally cloud-based and offer scalable pricing, making it cost-effective for all business sizes.
Prompt it. Wireframe it with Mokkup.ai.
