Hospital functional metrics report dashboard template, designed to provide a comprehensive overview of hospital operations and performance. This report includes key metrics such as patient satisfaction, staff efficiency, resource utilization, and treatment outcomes. With its clear and concise data presentation, it empowers hospital administrators to make informed decisions, improve patient care, and enhance overall hospital efficiency.
The dashboard wireframe comprises four screens: Executive Summary, Patient Record, Patient Profile & Patient Experience Analysis; each is explained briefly below.
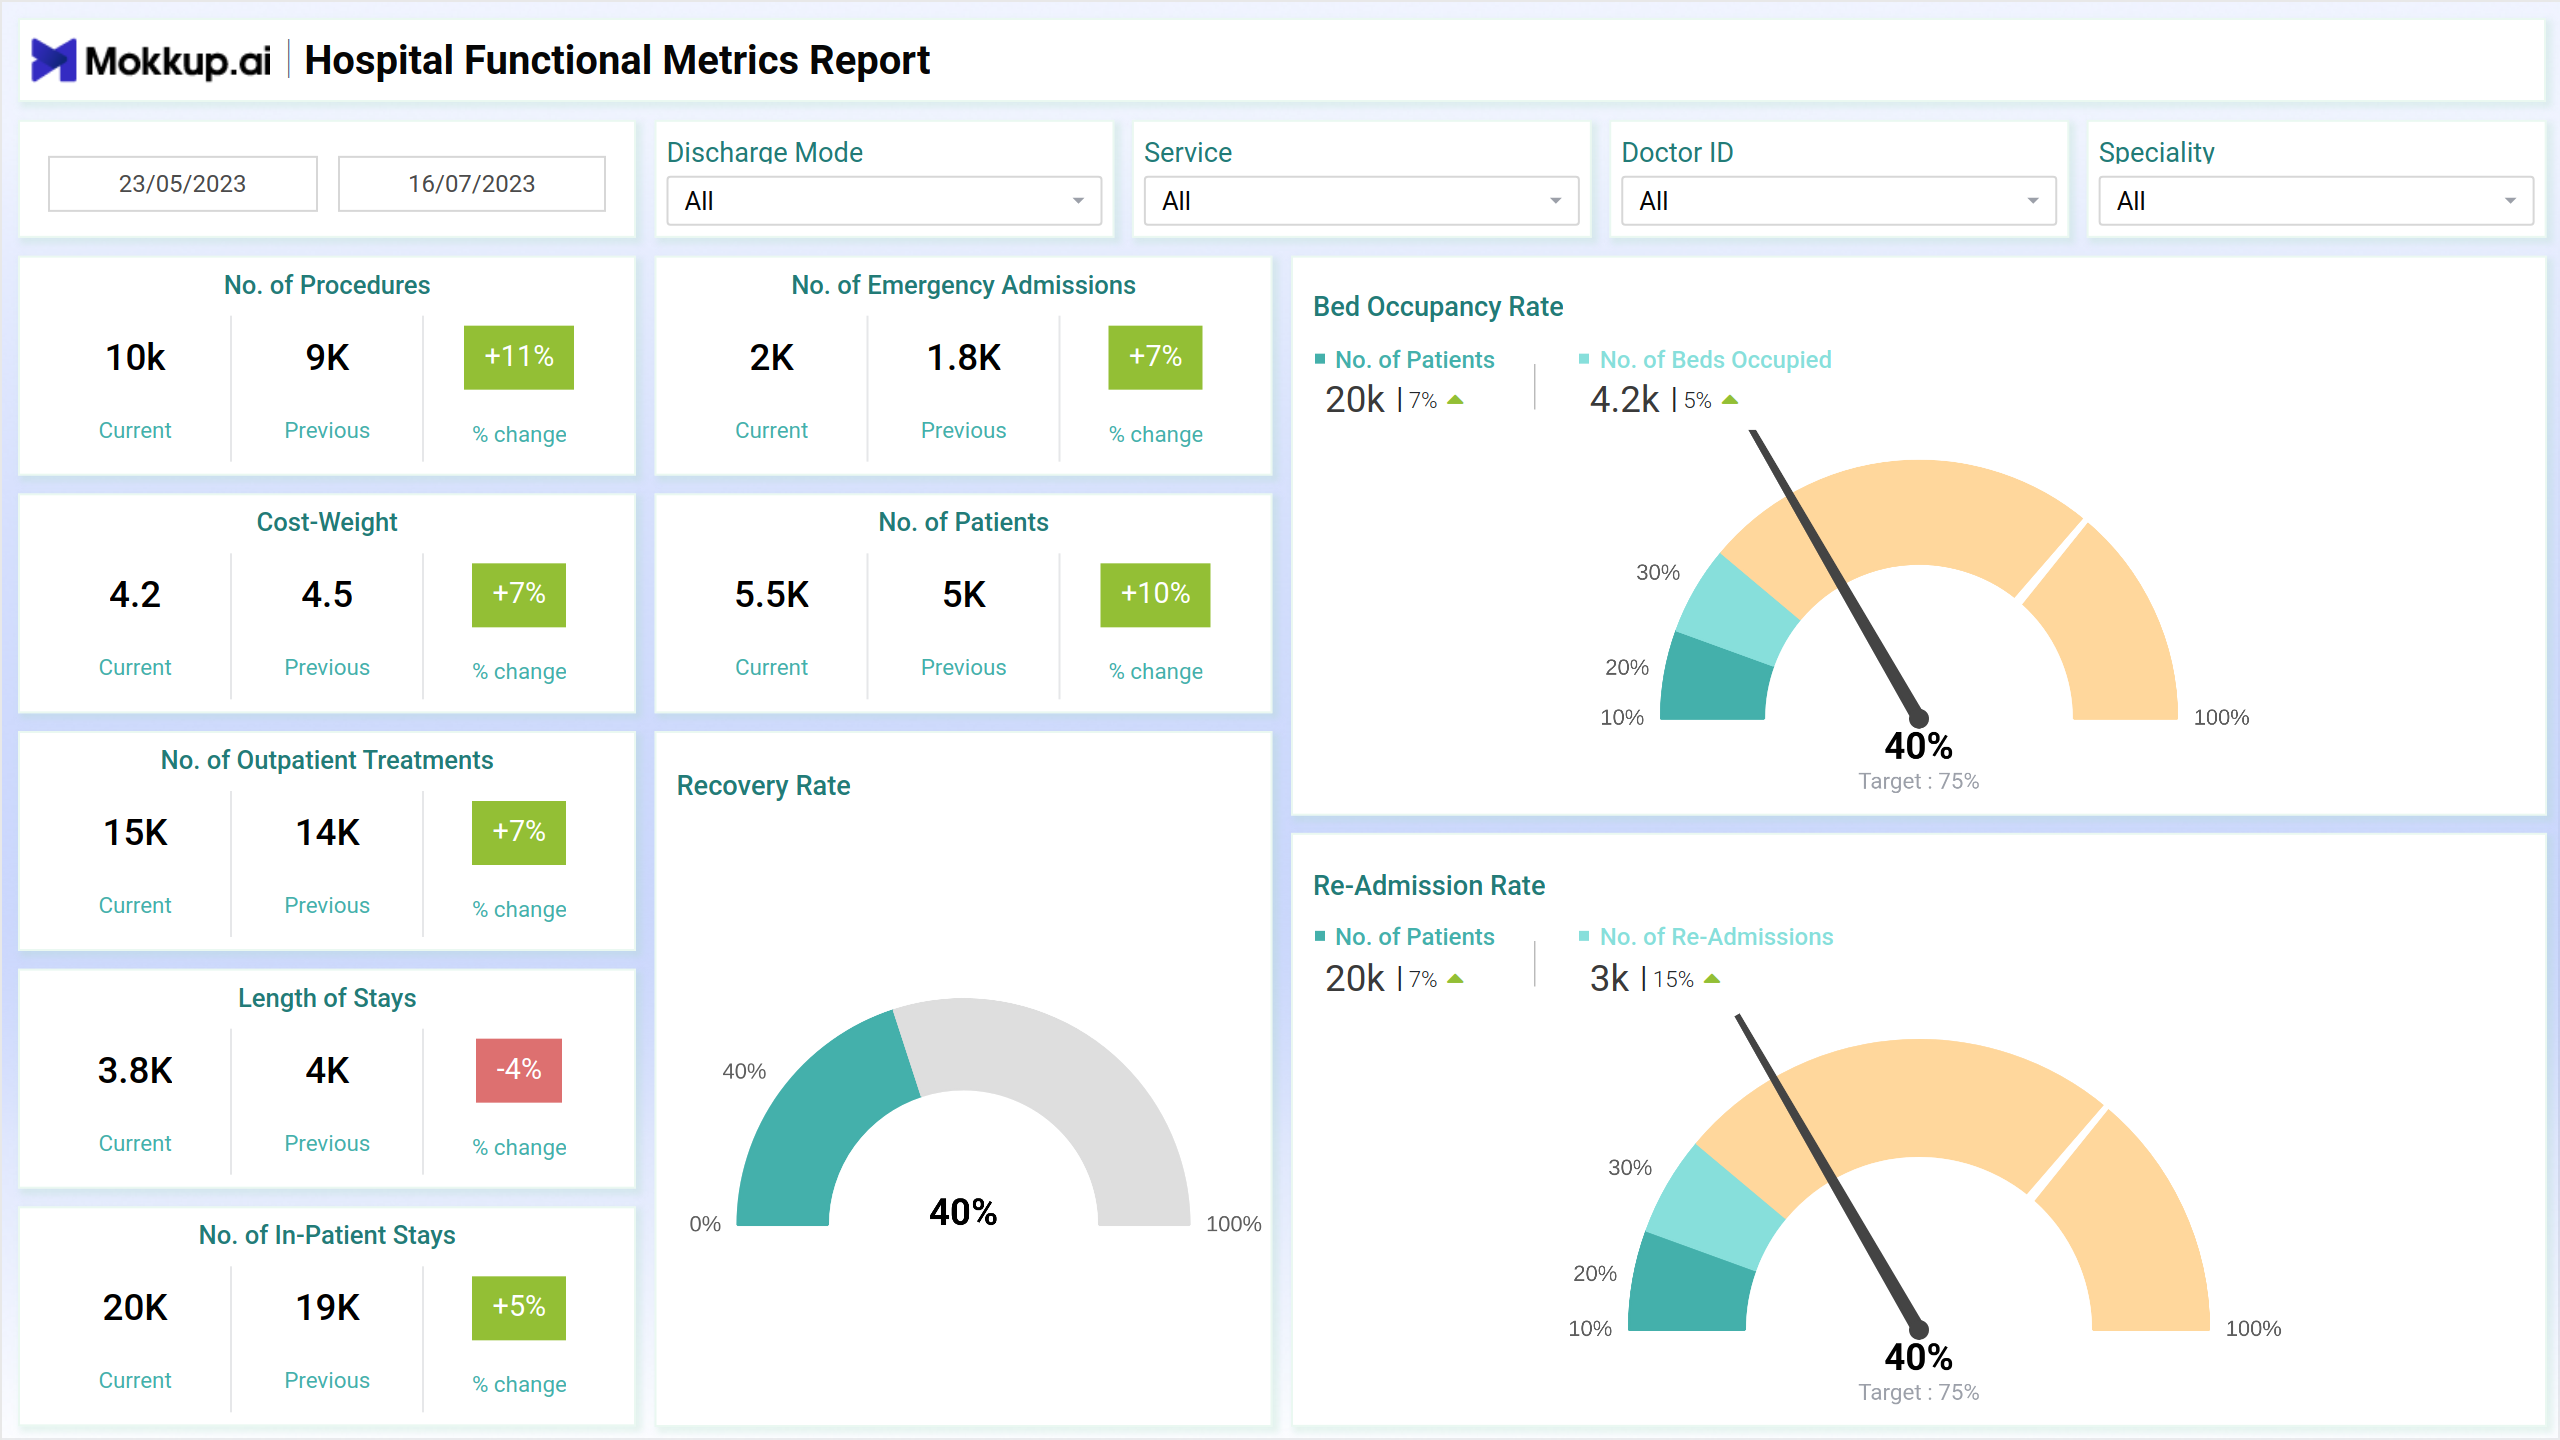
Executive Summary
This screen is designed to provide a high-level overview of the hospital's performance across a number of key metrics, including patient volume, length of stay, cost-weight, and re-admission rates. The dashboard is easy to use and can be customized to view data for specific dates, discharge modes, services, or doctors.
Key Terms to Know
- No. of Procedures: Indicates the total number of medical procedures performed.
- Cost Weight: Represents the relative cost associated with different medical procedures or treatments.
- Length of Stays: Measures the average duration of hospital stays for patients.
- No. of Emergency Admissions: Shows the total number of patients admitted through the emergency department.
- No. of Patients: Displays the total number of patients treated within a specified period.
- Recovery Rate: Indicates the percentage of patients who successfully recover from their treatments.
- Bed Occupancy Rate: Measures the percentage of occupied hospital beds at any given time.
- Re-admission Rate: Calculates the percentage of patients who are readmitted to the hospital after their initial discharge.
Patient Record
This screen is designed to help hospitals track key metrics related to patient records, such as the number of patients, the average age of patients, and the average satisfaction rating of patients. The dashboard is designed to be easy to use and intuitive to the user. The dashboard is made up of a number of columns, each of which has a title and a description. The columns are arranged in a way that is easy to read and understand.
Key Terms to Know
- Discharge Mode: Specifies the manner in which patients are discharged, such as home, transferred to another facility, or left against medical advice.
- Doctor ID: Identifies the doctors responsible for treating patients, linked to specific procedures and outcomes.
- Average Age of Patients: Indicates the mean age of patients treated in the hospital.
- Patient Base by Specialty: Breaks down the patient population based on medical specialties, such as cardiology, orthopedics, or pediatrics.
- Patient Profiles: Provides detailed demographic and medical information about the patients, including age, gender, diagnosis, and treatment history.
Patient Profile
This screen is designed to provide a comprehensive overview of a patient's medical history and treatment history. The dashboard includes demographic information, insurance details, cost-weight history, diagnoses and treatments, and medications. The dashboard is designed to be user-friendly and easy to navigate.
Key Terms to Know
- Patient Profile: Provides detailed demographic and medical information for each patient, including age, gender, and medical history.
- Coverage Overview: Summarizes the types of insurance coverage patients have, including the extent and limits of their coverage.
- Insurance Details Summary: Highlights key information about patients' insurance policies, such as provider, policy number, and coverage specifics.
- Diagnosis & Treatments: Lists the diagnoses and corresponding treatments administered to each patient, offering a comprehensive view of their medical care.
Patient Experience Analysis
This screen is designed to help hospitals understand how patients perceive their care. It provides insights into areas such as patient satisfaction, net promoter score (NPS), re-admission rates, wait times, and complaint resolution time. The dashboard also allows users to drill down into specific patient journeys and service utilization rates. By understanding patient experience, hospitals can identify areas for improvement and make changes that will lead to better patient outcomes.
Key Terms to Know
- Net Promoter Score: Measures patient satisfaction and likelihood of recommending the hospital to others.
- Re-Admission Rates: Calculates the percentage of patients who are readmitted to the hospital within a specific timeframe after discharge.
- Patient Engagement: Assesses the level of patient involvement and interaction with their healthcare plans and services.
- Wait Times: Indicates the average time patients spend waiting for services such as appointments, procedures, or emergency care.
- Patient Journey Analysis: Maps the complete patient experience from admission to discharge, identifying key touchpoints and potential areas for improvement.
- Service Utilization Rate: Measures the extent to which hospital services and facilities are used by patients.
- Complaint Resolution Time: Tracks the average time taken to resolve patient complaints and issues.
Dashboard Template Insights
This dashboard wireframe highlights key achievements in healthcare management and performance evaluation:
- By providing metrics on treatment outcomes and patient satisfaction, the dashboard supports initiatives to improve patient care and experience.
- With insights into resource utilization, it helps in efficient allocation and management of hospital resources.
- Metrics on staff performance and efficiency aid in workforce planning and development, ensuring optimal staff deployment.
Conclusion
In conclusion, this template provides crucial insights into hospital performance and patient care. By offering comprehensive data on key metrics such as patient satisfaction, resource utilization, staff efficiency, and treatment outcomes, this dashboard equips hospital administrators with the necessary tools to make informed decisions and drive improvements in healthcare delivery and operational efficiency.
Frequently Asked Questions
Q1. What KPIs are essential for hospital performance tracking?
Essential KPIs for hospital performance include patient satisfaction, recovery rates, bed occupancy, re-admission rates, staff efficiency, and overall treatment outcomes.
Q2. How to measure healthcare operational efficiency?
Healthcare operational efficiency can be measured by monitoring the average length of stay, bed utilization, patient wait times, cost per procedure, and staff workload distribution.
Q3. Best practices for hospital dashboard reporting?
The best practices for hospital dashboard reporting are to use real-time data, provide drill-down views, segment insights by department or service, and keep the layout simple for easy interpretation.
Q4. What metrics improve patient care quality tracking?
Patient care quality can be tracked using metrics such as patient satisfaction scores, net promoter score (NPS), complaint resolution time, re-admission rates, and treatment success rates.
Q5. How to monitor hospital resource utilization effectively?
Hospital resource utilization can be monitored by tracking bed occupancy, service utilization rates, equipment usage, and staff deployment to ensure optimal allocation and efficiency.