What Is a Logistics Management Dashboard?
A Logistics Management Dashboard is a visual interface that brings together key operational metrics such as fleet usage, vehicle activity, mileage, maintenance workload, and fuel efficiency. It acts as the logistics command center, enabling managers to evaluate performance across warehouses, fleets, and freight processes. Using visual elements such as bar charts, line graphs, pie charts, and age distribution bars, the dashboard simplifies complex logistics data and delivers end-to-end visibility of the supply chain inventory. This makes it one of the best logistics dashboards for supply chain visibility, particularly for organizations that rely on timely, data-driven decision-making.
How to Create a Logistics Management Dashboard
You don’t need to build your report from scratch—just start with a ready-to-use dashboard template from Mokkup. Add in your data and export it however you like. Here’s how to do it:
1. Create or Log in to Your Mokkup Account
Start by signing up on Mokkup.ai using your email. If you already have an account, just log in, and you’ll be good to go.
2. Choose and Customize Your Dashboard Template
Find the Logistics Management Dashboard template in the Templates section. Use the drag-and-drop editor to adjust KPIs, edit filters, or add elements based on your data.
3. Export to Your BI Tool
Once your dashboard wireframe is ready, use the BI Tool Export feature to send it directly to Power BI or Tableau for further analysis and enhancements. You can also download the dashboard as a PDF, PNG, or JPEG, embed it on a platform, or invite your team to collaborate.
Note: This is a Pro template. You’ll need a Pro subscription on Mokkup to use and customize this dashboard wireframe. Upgrade anytime to unlock full access.
Logistics Management Dashboard Example
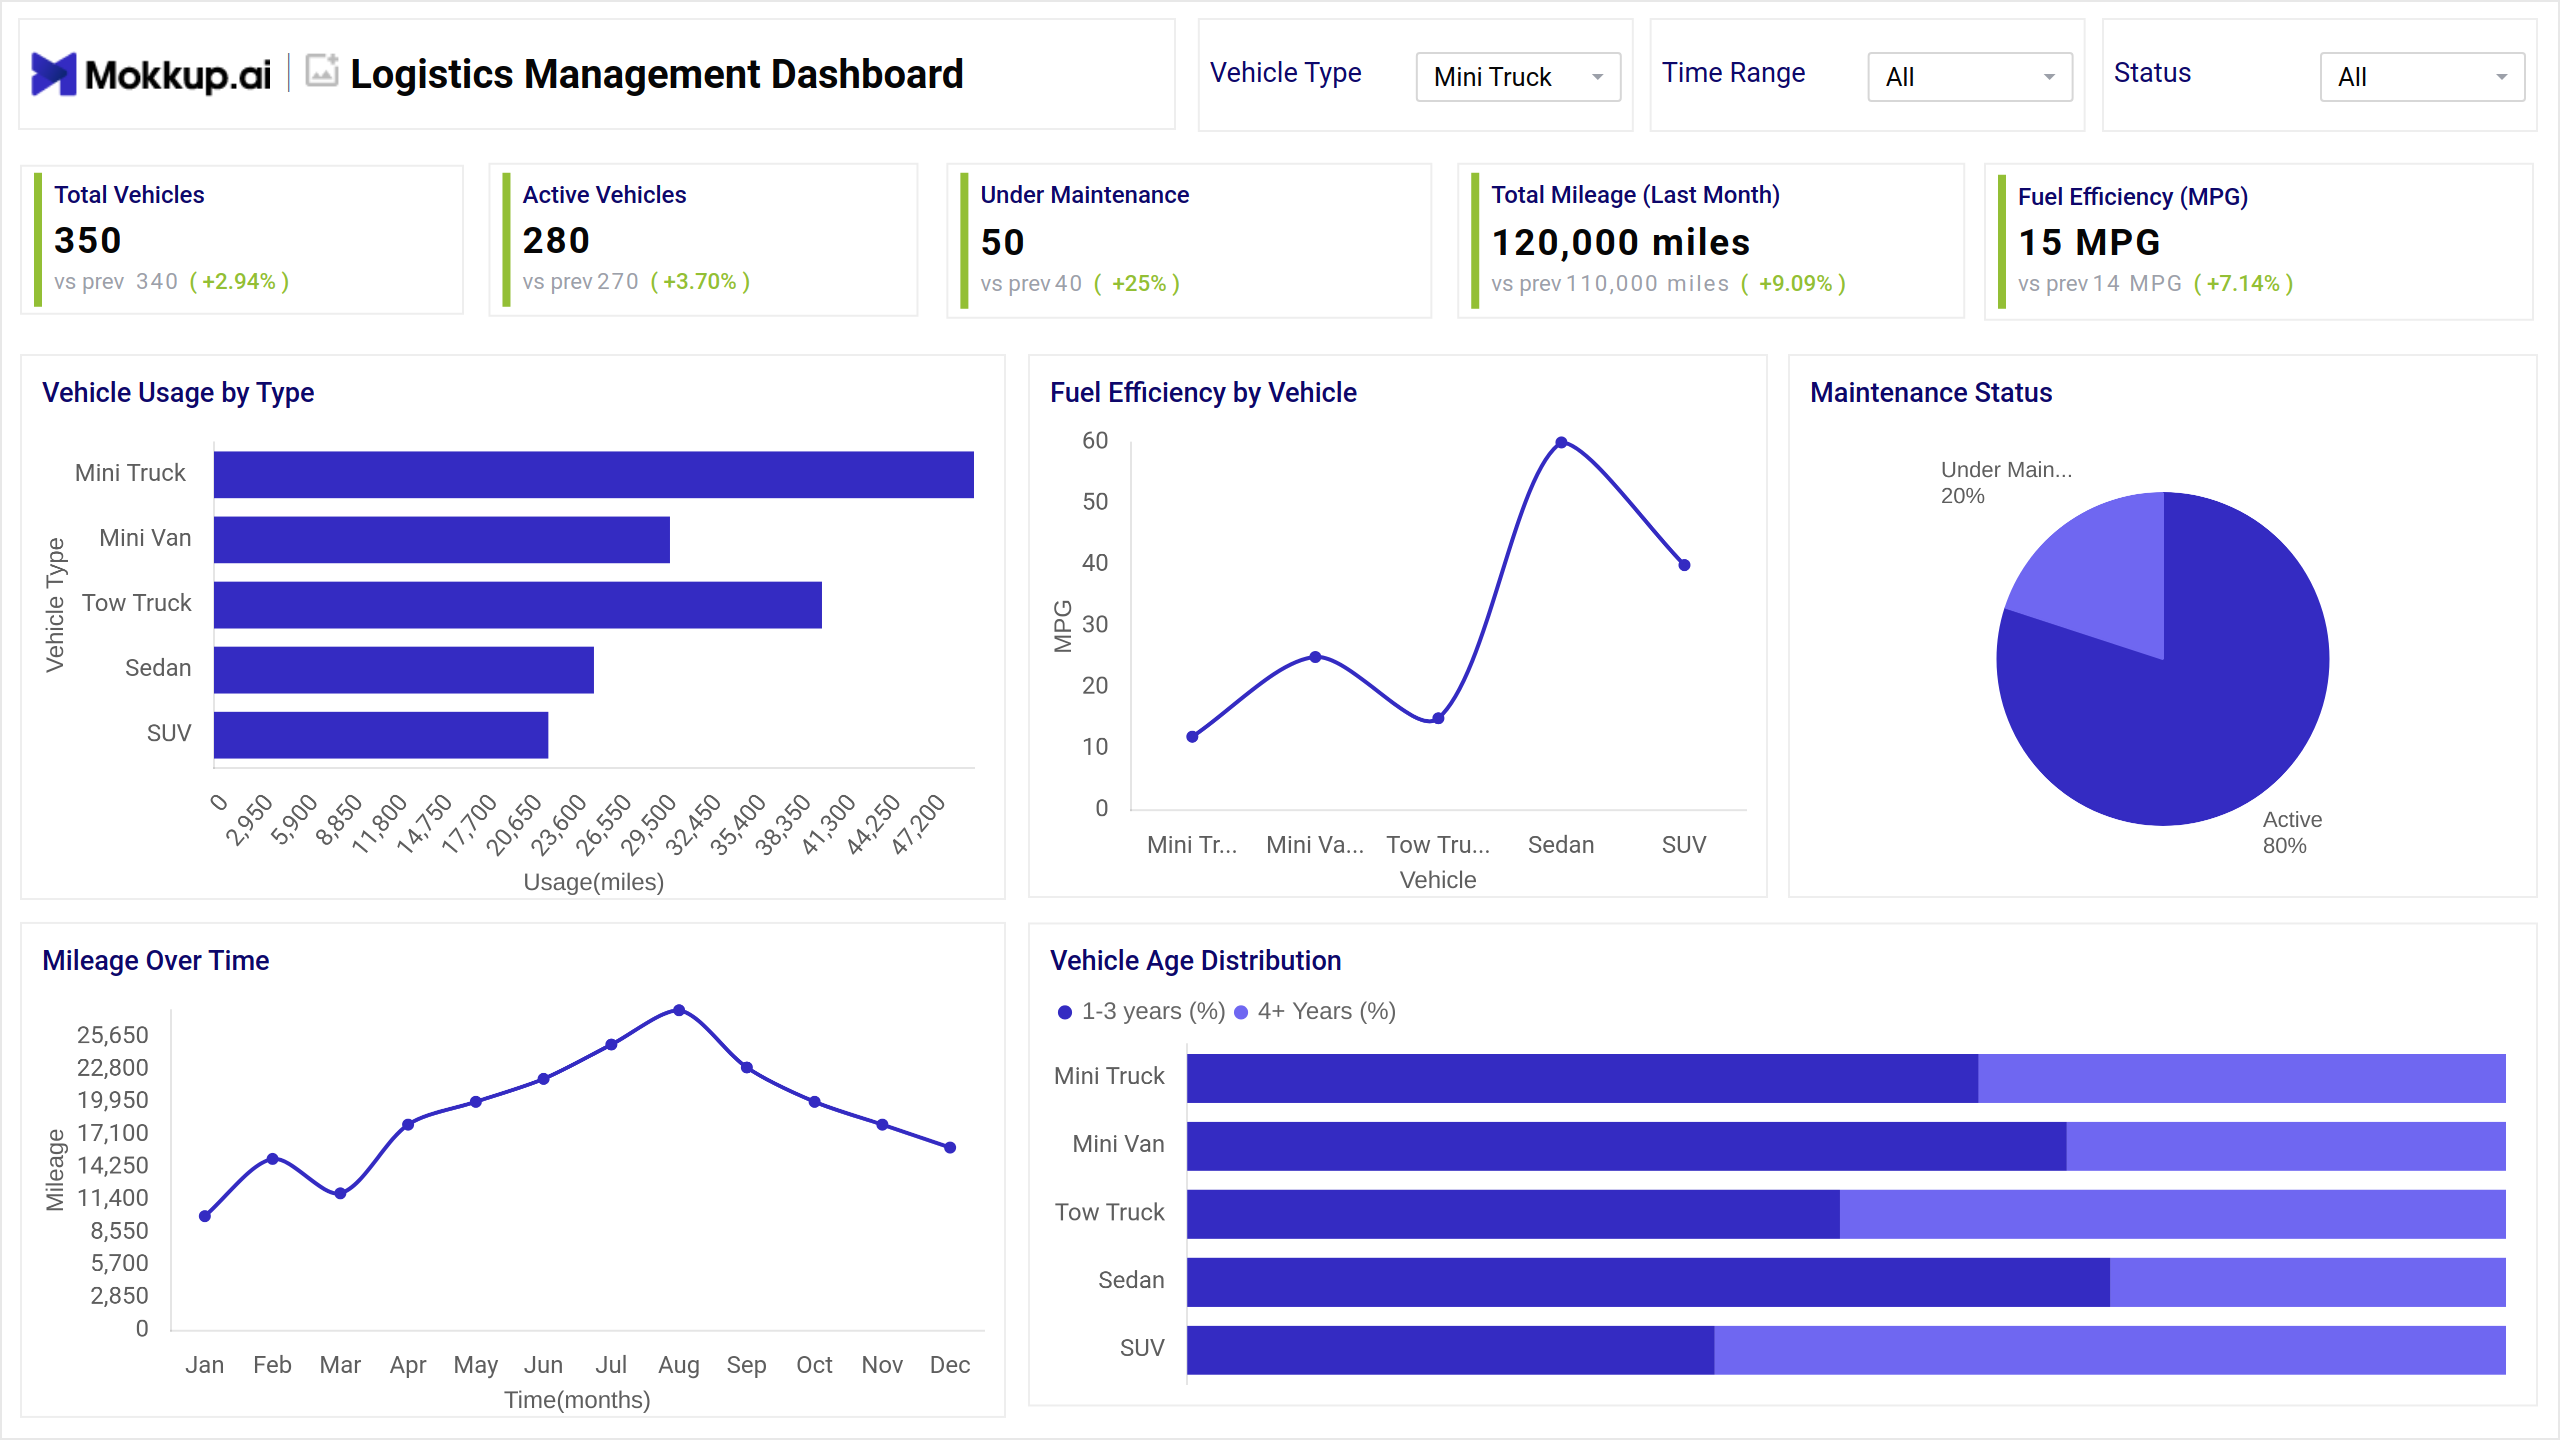
This Logistics Management Dashboard example presents an integrated view of fleet and performance metrics using a combination of KPI cards and charts. At the top, the dashboard highlights essential KPIs like Total Vehicles, Active Vehicles, Under Maintenance, Fuel Efficiency, and Total Mileage. These provide an instant snapshot of fleet health. Below that, bar charts display Vehicle Usage by Type, showing which categories log the highest mileage, while a line graph tracks Mileage Over Time, revealing seasonal trends and operational peaks.
Another line chart compares Fuel Efficiency by Vehicle Type, helping identify cost-heavy vehicles. A pie chart illustrates the Maintenance Status, breaking down active versus under-maintenance cars, and a stacked bar chart visualizes Vehicle Age Distribution to support replacement planning. Together, these visuals form a comprehensive Logistics Management Dashboard Template that indeed acts as a dashboard for warehouse and freight performance.
How to Analyze Data in Logistics Dashboards
Here’s how teams can use the dashboard to derive meaningful insights:
- Vehicle Usage by Type: Shows which vehicle categories contribute the most mileage and identifies high-demand fleet segments.
- Fuel Efficiency by Vehicle: Highlights MPG variations across vehicles to pinpoint units with excessive fuel consumption.
- Maintenance Status: Indicates the percentage of vehicles that are under maintenance to help reduce downtime.
- Mileage Over Time: Tracks monthly mileage trends to identify seasonal patterns or changing workload demands.
- Vehicle Age Distribution: Displays the mix of newer vs. older vehicles to guide replacement budgeting.
- KPI Period Comparison: Shows increases or decreases from previous periods to support trend-based decision-making.
- Fleet Activity Levels: Measures the number of vehicles that are active at any given moment to assess utilization efficiency.
- Vehicle Performance Segmentation: Groups vehicles by type or age to optimize task assignment and routing.
Benefits of Logistics Management Dashboards
- Real-Time Fleet Visibility: Provides instant insights into active vehicles, mileage, and operational status.
- Faster Decision-Making: Enables managers to act quickly by using accurate KPIs and trend indicators.
- Reduced Downtime: Tracks maintenance needs to schedule proactive servicing.
- Improved Fuel Efficiency: Identifies vehicles with low MPG for optimization or replacement.
- Enhanced Supply Chain Transparency: Connects warehouse, fleet, and freight data in one interface.
- Better Forecasting: Uses historical mileage and usage data to predict future demand.
- Optimized Freight Performance: Monitors vehicle output and efficiency to improve delivery timelines.
- Centralized Reporting: Consolidates scattered logistics data into one end-to-end logistics reporting dashboard.
KPIs to Track in Logistics Management Dashboards
- Total Vehicles: Shows the size of the fleet and helps evaluate capacity availability.
- Active Vehicles: Tracks the number of operational vehicles at a given time to measure utilization.
- Under Maintenance: Indicates workload on repair teams and potential availability issues.
- Total Mileage: Measures overall vehicle usage and workload intensity.
- Fuel Efficiency (MPG): Shows average fuel performance to manage operational costs.
- Vehicle Usage by Type: Reveals which vehicle categories drive the most activity.
- Maintenance Status: Breaks down active vs. non-operational vehicles to prevent bottlenecks.
- Mileage Over Time: Tracks monthly or yearly mileage patterns for planning.
- Vehicle Age Distribution: Highlights fleet aging trends to inform replacement scheduling.
- Freight Performance Metrics: Monitors load efficiency and on-time performance if integrated.
- Warehouse Activity Metrics: Tracks throughput, storage, or movement performance when included.
Frequently Asked Questions
Q1. How to create an effective logistics management dashboard?
Start by defining key objectives, selecting the most relevant KPIs, and organizing them into clear visualizations. Use reliable data sources and ensure the dashboard is easy to interpret for quick decision-making.
Q2. What KPIs are essential for supply chain monitoring?
Shipment tracking, delivery performance, inventory levels, fuel efficiency, and transportation costs.
Q3. Best metrics for tracking delivery performance?
On-time delivery rate, average delivery time, delays, and incident frequency.
Q4. How to optimize transportation and shipping operations?
Monitor fuel usage, route efficiency, vehicle maintenance, and driver performance to cut costs and improve timelines.
Q5. What features should logistics dashboards include?
Real-time tracking, vehicle and driver management, maintenance compliance, cost analysis, and performance trends.