
According to McKinsey’s Technology Trends Outlook 2025, companies face a “mandate to navigate rising complexity, scale emerging solutions, and build trust in a world where the lines between digital and physical … continue to blur.” In this environment, getting the structure and user flow of interfaces right is more critical than ever, and that’s where the wireframing process guide holds value. In this beginner wireframing tutorial, we’ll explain how to wireframe, show you how to create wireframes step by step, and share wireframe creation tips and wireframing best practices. We’ll explore how tools like Mokkup.ai simplify the wireframe design workflow for newcomers, while also comparing them with other platforms like Figma, Adobe XD, and Balsamiq so you can pick the best beginner wireframing guide for your needs.
Table of Contents
- Understanding the Wireframing Process
- Steps to Create Wireframes (Step-by-Step Tutorial)
- How to Create Dashboard Wireframes using Mokkup?
- Comparing Mokkup with Other Wireframing Tools
- Wireframing Best Practices and Tips
Understanding the Wireframing Process
A wireframe is the visual skeleton of a website, app, or dashboard. It defines where elements like buttons, menus, and content blocks will appear before design and development begin. The wireframing process guide helps teams map user journeys, validate layouts, and align design goals with functionality. Whether you’re working on a product interface or a business dashboard, understanding how to wireframe ensures your ideas translate into practical, user-focused designs.
Key Elements of the Wireframing Process
- Define the Objective: Start by understanding what the product or dashboard aims to achieve. A clear goal helps decide which features to prioritize and where to place them.
- Outline the User Flow: Map how users will move through screens or pages. A good wireframe visually represents this journey and highlights any possible roadblocks.
- Structure the Layout: Divide your screen into clear sections for navigation, content, and interaction. This step ensures logical placement and smooth usability.
- Add Interaction Cues: Even at a low-fidelity stage, indicate clickable areas, buttons, or form elements to simulate real user behavior.
- Gather Feedback Early: Share your draft wireframes with stakeholders or teammates before moving to high-fidelity design. It saves time and improves decision-making.
The wireframing process doesn’t just define structure; it bridges creativity and logic. Tools like Mokkup, Figma, and Adobe XD streamline this step, allowing teams to visualize the final product faster while adhering to wireframing best practices.
Steps to Create Wireframes (Step-by-Step Tutorial)
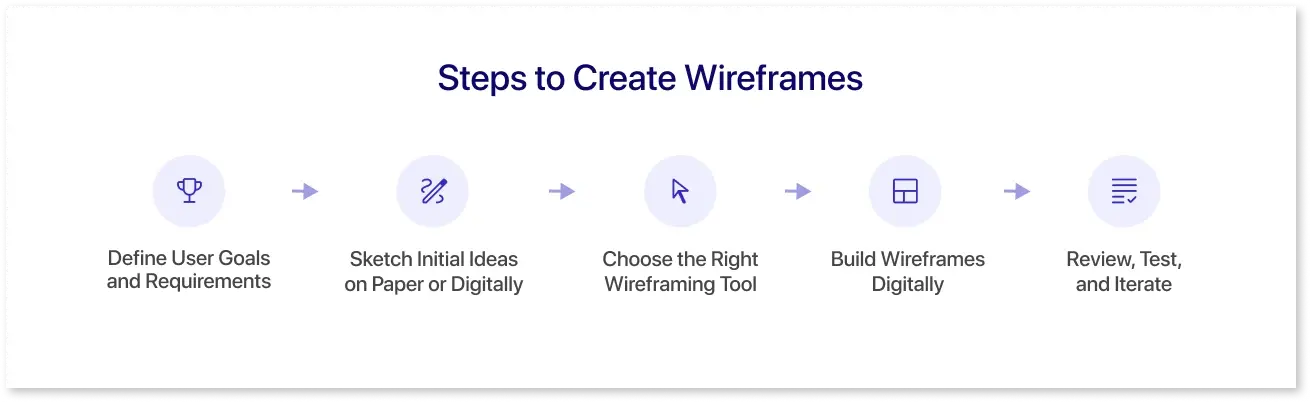
The wireframing process becomes easier when you follow a structured workflow. This section outlines how to wireframe effectively using a beginner-friendly wireframing guide approach. Whether you’re designing a product interface or dashboard, these steps ensure your layout is functional, consistent, and user-focused.
Step 1: Define User Goals and Requirements
Before creating any wireframe, identify the core purpose of your design. Who will use it? What problem will it solve? Collect inputs from product teams or clients and convert them into layout goals. This clarity ensures every section of your wireframe supports user intent.
Step 2: Sketch Initial Ideas on Paper or Digitally
Start with simple sketches to visualize different layout options. These early drafts don’t need a detailed focus on placement and structure. Sketching helps you decide the hierarchy of elements, such as headers, filters, charts, or buttons, before digitizing your design.
Step 3: Choose the Right Wireframing Tool
This is where tools like Mokkup, Figma, Balsamiq, and Adobe XD come in.
- Mokkup offers pre-built templates, real-time collaboration, and drag-and-drop elements, making it ideal for non-designers and teams creating dashboard or product wireframes quickly.
- Figma offers advanced collaboration and real-time editing for teams that require flexibility.
- Balsamiq focuses on low-fidelity mockups that help teams quickly brainstorm layout ideas.
- Adobe XD is preferred by UI designers who want detailed control over visuals.
Selecting the right tool depends on your workflow. Mokkup.ai works best when speed and simplicity are most important.
Step 4: Build Wireframes Digitally
Once you’ve chosen a tool, start creating the wireframe using templates or blank canvases. Arrange elements like text boxes, icons, images, and buttons. Use grid layouts to maintain consistency in alignment and spacing. With Mokkup.ai, you can drag and drop pre-made components to design faster without needing advanced design skills.
Step 5: Review, Test, and Iterate
Share your draft wireframes with your team for quick feedback. Tools like Mokkup and Figma make collaboration easy with commenting features. Make iterative changes based on feedback before finalizing the layout. Testing early helps ensure your design aligns with both user goals and business needs.
Following this workflow helps beginners create wireframes step by step while maintaining structure and usability. By applying these wireframe creation tips, you can refine your design ideas quickly and transition smoothly to high-fidelity prototypes.

How to Create Dashboard Wireframes using Mokkup?
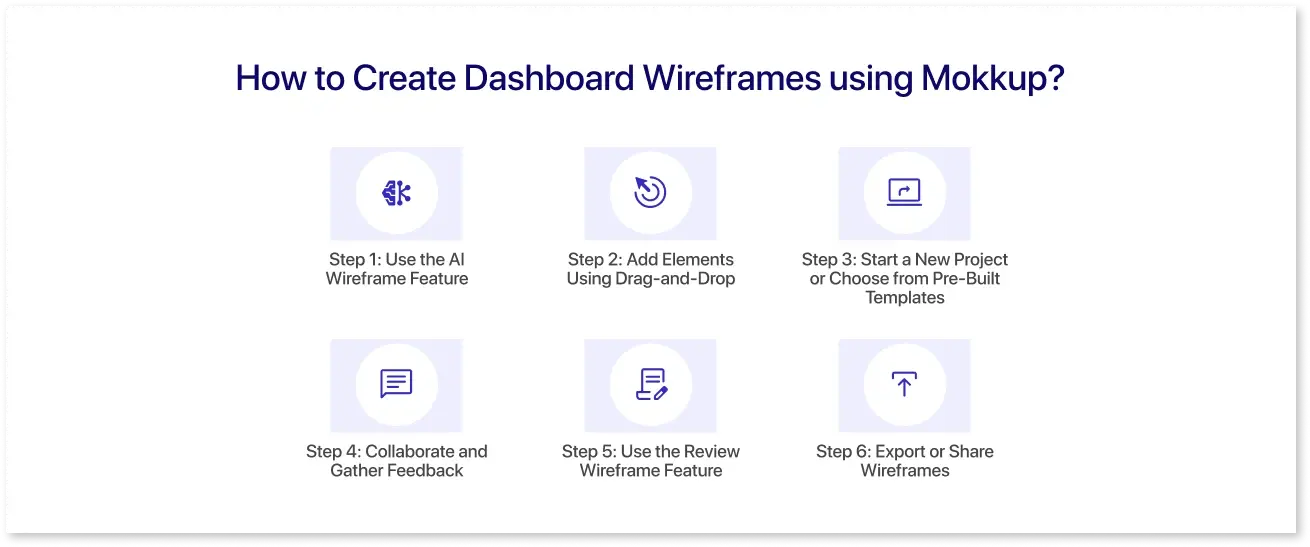
Mokkup.ai makes dashboard wireframing fast, structured, and accessible for anyone, even without design experience. With its AI-powered features and ready-to-use templates, you can visualize professional dashboard layouts within minutes. Here’s how to wireframe a dashboard using Mokkup, step by step.
Step 1: Use the AI Wireframe Feature
After signing in, navigate to the “Create with Mokkup AI” panel. Enter a short prompt such as “Create a sales performance dashboard layout” or “Design a project management wireframe with KPIs.”
Mokkup’s AI instantly generates a layout suggestion with relevant charts, tables, and cards. This feature helps beginners kickstart their wireframing process without starting from a blank screen.
Step 2: Add Elements Using Drag-and-Drop
Once your base layout is generated, refine it using Mokkup’s drag-and-drop library. You can easily add or replace components, such as KPI cards, charts, filters, or text boxes. To maintain brand consistency, apply themes and color palettes that align with your organization’s dashboard style. This step ensures visual clarity and maintains uniformity across all design elements.
Step 3: Start a New Project or Choose from Pre-Built Templates
Suppose you prefer manual control over AI generation. In that case, you can start a new project or choose from pre-built templates designed for various industries, such as finance, retail, logistics, or marketing. Each template includes predefined layouts that follow wireframing best practices, allowing you to focus on data structure and content flow rather than visual design.
Step 4: Collaborate and Gather Feedback
Mokkup.ai supports real-time collaboration, allowing teams to review wireframes together. Invite teammates or clients to comment directly within the project workspace. This feature allows designers, analysts, and managers to align early on layout decisions and avoid repeated revisions during the BI dashboard build phase.
Step 5: Use the Review Wireframe Feature
Once your layout is complete, select “Review my wireframe.” You can enter a prompt such as “Does this dashboard follow layout best practices?” or “Suggest improvements for KPI placement.”
The AI provides quick recommendations to enhance usability, spacing, and overall structure, ensuring your design meets professional standards.
Step 6: Export or Share Wireframes
After incorporating feedback, export or share the final wireframe with your team. Mokkup.ai provides multiple sharing options so stakeholders and developers can easily replicate the approved layout in Power BI, Tableau, or any preferred BI tool.
By combining AI assistance with manual customization, Mokkup helps users create wireframes step by step with accuracy and speed. It’s a practical solution for anyone seeking a simplified yet powerful wireframing process guide for dashboards.
Comparing Mokkup with Other Wireframing Tools
Choosing the right wireframing tool depends on your project type, team size, and workflow goals. While Mokkup.ai simplifies dashboard wireframing with AI features and pre-built templates, other tools, such as Figma, Balsamiq, and Adobe XD, also have their strengths. The table below compares key aspects to help you decide which tool best fits your wireframe design workflow.
|
Feature |
Mokkup |
Figma |
Balsamiq |
Adobe XD |
|
Primary Use |
Dashboard and BI wireframes |
UI/UX and app design |
Low-fidelity mockups |
High-fidelity prototypes |
|
Ease of Use |
Very easy; no design experience needed |
Moderate; design-oriented |
Simple, for brainstorming |
Moderate; requires design familiarity |
|
AI Features |
AI wireframe generation, layout review |
No AI wireframing (plugin-based only) |
None |
None |
|
Pre-Built Templates |
Industry-specific dashboard templates |
UI templates |
Basic layout templates |
UI templates |
|
Collaboration |
Real-time feedback and comments |
Real-time editing and version control |
Limited collaboration |
Shared projects and cloud sync |
|
Customization Options |
Limited to layout, size, and theme adjustments |
Full customization and plugin support |
Basic element styling |
Full visual customization |
|
Best For |
Beginners, analysts, and BI teams |
Designers and product teams |
Quick ideation sessions |
Detailed prototype creation |
|
Pricing |
Free plan available; premium for teams |
Free + Paid (Pro/Org tiers) |
Paid (single license) |
Free + Paid (Creative Cloud) |
If your goal is to create dashboard wireframes quickly without complex design steps, Mokkup.ai is the best choice. It automates much of the layout creation through AI and simplifies collaboration. Tools like Figma and Adobe XD are ideal for high-fidelity UI design, while Balsamiq works best for early-stage brainstorming.
Wireframing Best Practices and Tips
A good wireframe focuses on structure, usability, and collaboration. Follow these quick tips to improve your wireframing process:
- Keep it simple: Focus on layout and hierarchy before adding visuals.
- Stay consistent: Use grids and alignment tools to maintain balance across screens.
- Prioritize function: Design for usability, not decoration.
- Collect feedback early: Use Mokkup’s sharing features to review layouts with your team.
- Add notes: Include short annotations to explain data or interactions.
- Use AI reviews: Let Mokkup’s AI check your wireframe for layout or usability issues.
- Iterate before finalizing: Test your layout flow and make small adjustments as needed.
These wireframing best practices ensure your layouts remain clean, structured, and ready for seamless development.
Summing Up
Wireframing is a crucial step in turning ideas into structured, functional designs. It helps teams visualize layout, improve user flow, and identify issues before development begins. By following a clear wireframing process guide and applying best practices, designers and beginners alike can create layouts that strike a balance between usability, clarity, and purpose.
Frequently Asked Questions
Start by defining user goals, sketching rough layouts, and organizing the main elements such as headers, buttons, and content blocks. Then, use a wireframing tool to arrange components digitally and refine the structure based on feedback.
The typical workflow includes defining goals, outlining user flows, creating low-fidelity sketches, building digital wireframes, collecting feedback, and iterating until the structure aligns with usability standards.
A wireframe should include layout sections, navigation menus, buttons, input fields, and placeholder content. It should clearly represent the page structure and interaction flow without focusing on visuals or color.
The level of detail depends on the project stage. Early wireframes can be simple sketches, while later versions may include interaction cues, annotations, and layout specifications for developers.
Avoid adding too much visual detail too soon, skipping feedback sessions, or neglecting consistency across screens. Another common mistake is designing without clear user goals or ignoring alignment and spacing.
It depends on complexity. A simple dashboard wireframe can take a few hours, while multi-screen applications may require several days of iteration and feedback before finalization.
Prompt it. Wireframe it with Mokkup.ai.
