"Design is not just what it looks like and feels like. Design is how it works." - Steve Jobs
Dashboards are like your app’s face; they display valuable information to users and provide an easy way to interact with data. One of the first stages in creating a dashboard that truly performs is wireframing. The global wireframe software market is projected to grow from approximately USD 2.01 billion in 2025 to USD 5.5 billion by 2035, driven by increasing demand for intuitive and collaborative design tools.
Having the right wireframing tool at your disposal can make all the difference in this rapidly evolving digital landscape. In a rapidly evolving digital landscape, selecting from the wireframe best tools can help teams design, validate, and refine dashboards faster. This guide examines the top dashboard wireframing apps and platforms that are shaping design and prototyping in 2026.
Table of Contents
- What Kind of Wireframing Tool Should You Get?
- The 7 Best Wireframing Tools to Use in 2026
- How AI is Shaping Dashboard Design in 2026
What Kind of Wireframing Tool Should You Get?
Choosing the right wireframing tool plays a critical role in creating compelling dashboard design examples. It directly impacts team collaboration, workflow efficiency, and the speed at which ideas are transitioned from concept to execution. The right tool makes it easier to gather feedback, work closely with developers, and iterate on designs without friction. Features such as easy sharing, built-in communication, and version control help maintain alignment across teams and ensure a smooth design process.
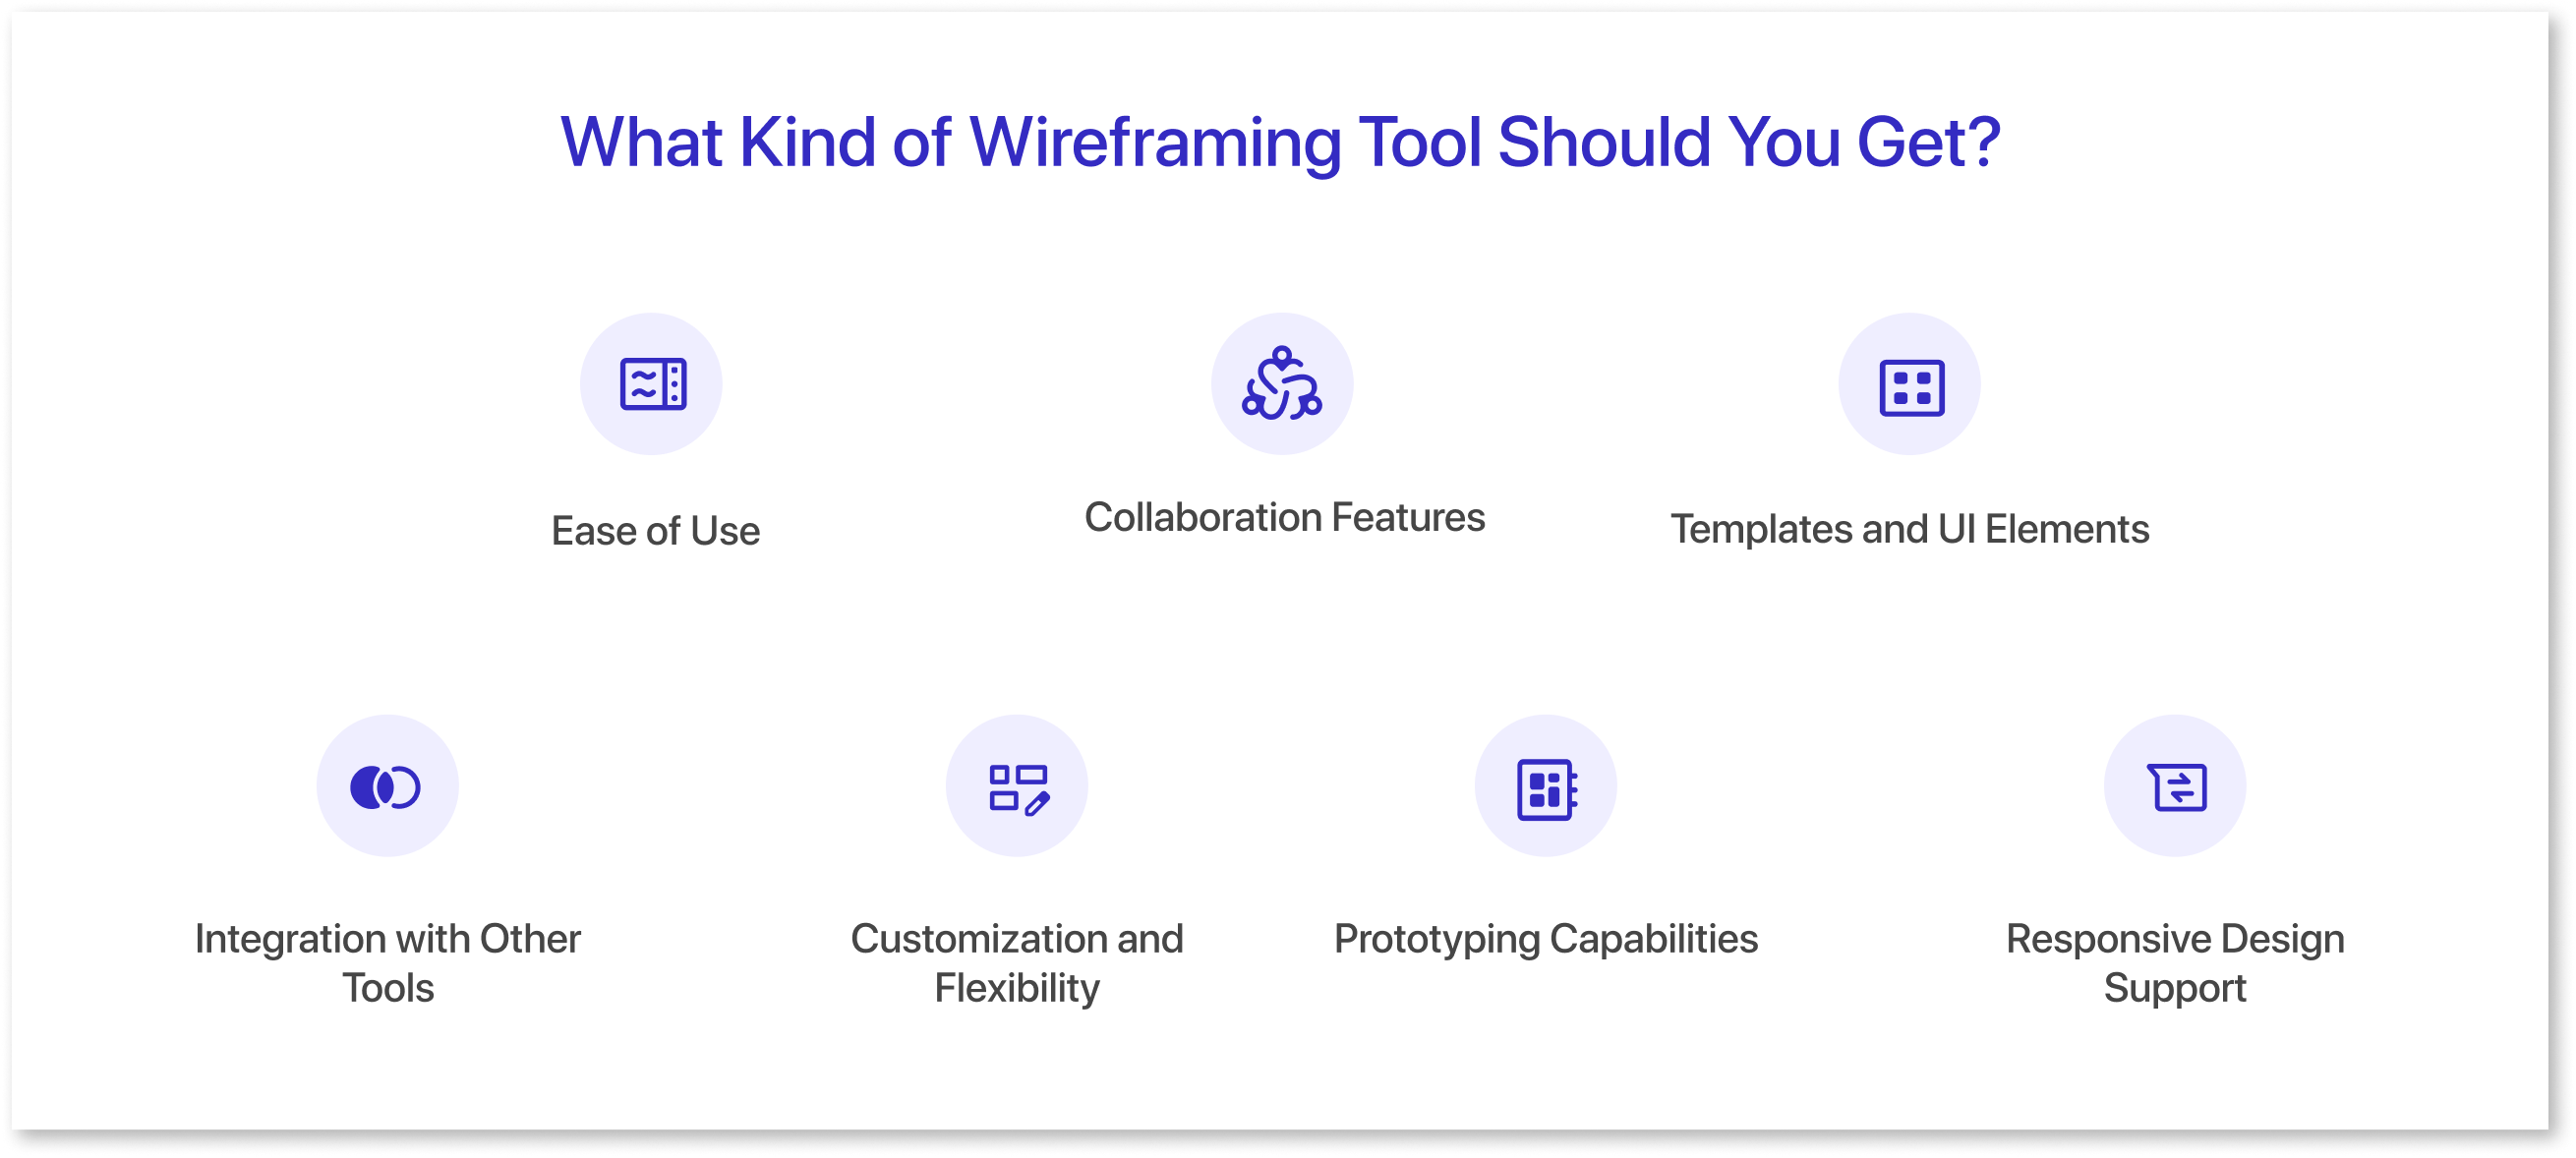
1. Ease of Use
Accessibility is essential when selecting a wireframing tool. A simple and intuitive interface enables designers to focus on their ideas rather than navigating complex software. Tools with a low learning curve help both experienced designers and non-designers get started quickly, improving adoption and collaboration across teams.
2. Collaboration Features
Modern dashboard design relies heavily on collaboration. Real-time editing and sharing enable teams to collaborate seamlessly, regardless of location. Commenting and feedback features help designers, developers, and stakeholders stay aligned, reducing misunderstandings and speeding up the approval process. This is especially important when designing dashboards for business intelligence, web, or mobile applications.
3. Templates and UI Elements
Reusable dashboard templates and UI components are key advantages of modern wireframing apps. Pre-built dashboard templates and UI components significantly reduce effort and ensure consistency across all projects. A good wireframing tool should offer ready-to-use filters, tables, and chart components to help teams design faster and maintain visual clarity.
4. Integration with Other Tools
A wireframing tool that integrates seamlessly with design, development, and analytics tools can significantly streamline workflows. Smooth handoffs between wireframes and development environments minimize rework and enable teams to move efficiently from design to implementation.
5. Customization and Flexibility
Customization is key when building dashboards for different use cases. The ability to adjust colors, fonts, and layouts helps maintain brand consistency across projects. Flexible wireframes also make it easier to adapt designs for different audiences and quickly incorporate feedback without having to start from scratch. Tools like Figma and Adobe XD support reusable components, styling controls, and interactive elements for more personalized designs.
6. Prototyping Capabilities
Prototyping allows teams to simulate real user interactions before development begins. Interactive prototypes help identify usability and data presentation issues early, gather meaningful user feedback, and align stakeholders through visual previews. This approach accelerates approvals and reduces development costs by identifying problems early. Advanced wireframe apps such as Adobe XD, Framer, and InVision offer realistic interactions and user journey mapping.
7. Responsive Design Support
With users accessing dashboards across multiple devices, responsive design is no longer optional. Wireframes must adapt to different screen sizes to deliver a consistent user experience on desktops, tablets, and smartphones. Responsive wireframing also supports better SEO, as search engines prioritize mobile-friendly and adaptable designs, improving visibility and traffic.
Ultimately, selecting the right wireframing tool ensures your dashboards are not only visually organized but also functional, collaborative, and adaptable to any project or device.

The 7 Best Wireframing Tools to Use in 2026
When selecting a wireframing tool, it is important to evaluate how effectively it supports dashboard layouts, collaboration, prototyping, and integration with your overall design or analytics ecosystem. The tools listed below represent some of the leading wireframing solutions in 2026, ranging from established design platforms to emerging AI-driven tools that accelerate ideation and layout development.
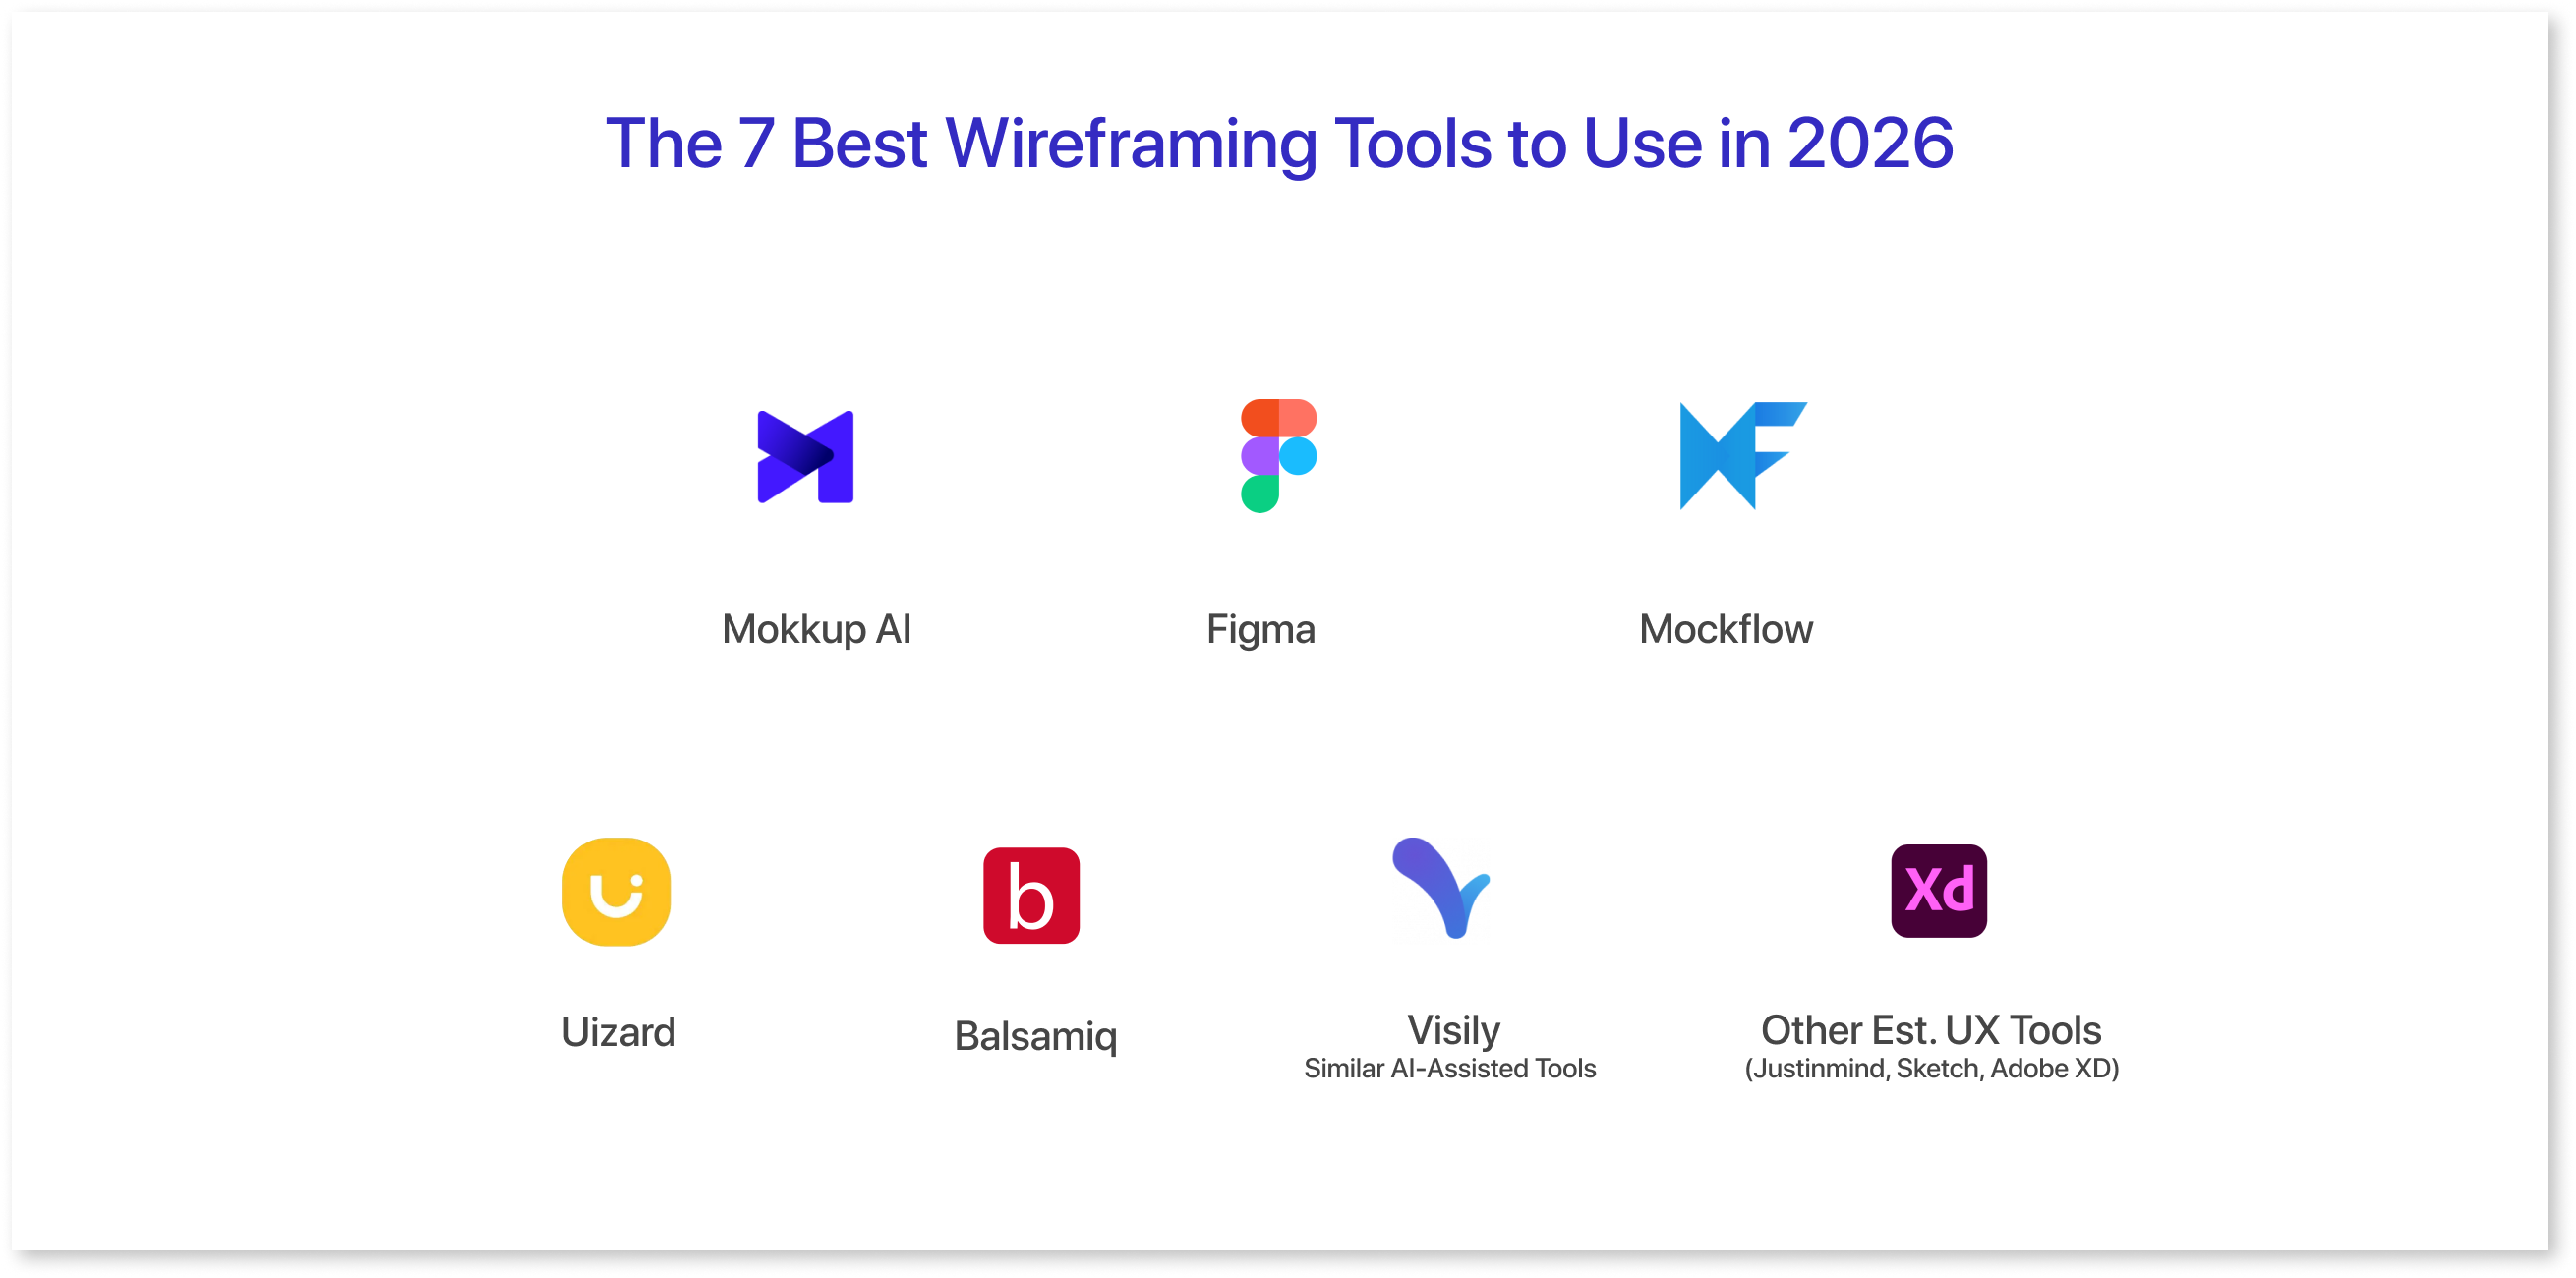
1. Mokkup.ai
Mokkup.ai remains practical if your primary goal is BI dashboard wireframing rather than general UI design. You can use natural language prompts to generate a layout and then adjust it using drag-and-drop. A key part of our workflow is exporting dashboard wireframes directly into Tableau or Power BI formats, which reduces the time spent on handoffs between planning and implementation.
2. Figma
Figma remains the leader in flexibility and collaboration. It isn’t BI-specific, but its component system and real-time editing make it easy to rough out dashboard frames, iterate with teammates, and keep a single source of truth as you refine. Plugins and community kits also help bridge the gap between general wireframes and dashboard patterns.
3. Mockflow
MockFlow has improved its AI support for dashboards and analytics wireframes. You can generate full-screen layouts with charts and layout suggestions from prompts, and then manually tweak the details. For whiteboarding and early sketched flows, it still works well, and it now fits better into planning phases that precede more detailed design work.
4. Uizard
We use Uizard when we need to go from rough ideas or even pen sketches into editable digital wireframes quickly. Its AI turns text or uploaded images into a layout you can refine, which is helpful in early ideation or when getting non-designers up to speed fast.
5. Balsamiq
For low-fidelity early-stage work, Balsamiq’s sketch-style wireframes still have value. It keeps stakeholders focused on structure and placement rather than visuals, which can help align expectations before moving into higher-fidelity tools or BI exports.
6. Visily/ Similar AI-Assisted Tools
Tools like Visily, which generate wireframes from text or templates, are worth exploring when you want a fast first draft. They aren’t as comprehensive as Figma or Mokkup for dashboards, but they accelerate brainstorming and early iterations, especially in cross-functional settings.
7. Other Established UX Tools (Justinmind, Sketch, Adobe XD)
Outside of these more specialized or AI-enhanced options, general UX wireframing tools, such as Justinmind, Sketch, or Adobe XD, are still used in teams where detailed prototypes or interaction flows are crucial. They’re broader than dashboard-specific tools, so we pick them when the focus is on full UI workflows rather than just layout frames.
What has changed in 2026 is the extent to which AI influences the early stages of the process. Prompt-to-layout and intelligent suggestions are no longer novelties; they’re expected parts of a wireframing toolkit. That said, we still mix tools based on fidelity needs, team skills, and where the work is going next (e.g., BI export, prototype, or full UI design).
How AI is Shaping Dashboard Design in 2026
Artificial intelligence is revolutionizing dashboard design, making wireframing faster, smarter, and more user-focused. AI-driven tools can generate wireframes from text prompts, sketches, or screenshots, helping teams move from concept to prototype in a fraction of the time compared to traditional methods.
Key ways AI is transforming dashboard wireframing include:
- Automated Layout Generation: AI can create complete dashboard layouts based on simple inputs, suggesting relevant chart types, KPIs, and component placements. With Mokkup’s Create with AI feature, teams can generate structured dashboard wireframes using natural language prompts, speeding up early-stage design.
- Design Optimization: AI suggests improved visual hierarchy, spacing, and component organization based on common dashboard design patterns, helping teams create clearer and more intuitive layouts.
- Usability Insights: Mokkup’s AI-powered wireframe review helps surface usability gaps, including layout clutter, missing elements, or unclear data hierarchy, enabling more user-friendly dashboards before development.
- Faster Iteration: By combining AI-generated layouts and AI-powered wireframe reviews, Mokkup reduces back-and-forth during design reviews, allowing teams to iterate quickly and align stakeholders before development begins.
- Seamless BI Integration: Mokkup’s AI-driven wireframes can be exported directly to Power BI or Tableau formats, significantly reducing the time required for handoffs between wireframing and BI development.
By using AI, teams can concentrate on strategic decision-making rather than making manual layout adjustments. In 2026, AI is no longer just a supportive tool; it is becoming a core part of the dashboard wireframing workflow, helping teams deliver smarter, faster, and more effective dashboards.
Final Thoughts
Choosing the right wireframing tool in 2026 can significantly impact the efficiency, usability, and visual appeal of your dashboards and applications. Whether using low-fidelity sketches, AI-assisted layouts, or interactive prototypes, the ideal tool should align with your team’s workflow and project goals.
A great wireframing tool makes it easy for everyone, designers, developers, analysts, and stakeholders, to contribute, iterate, and align on the vision. By selecting the right platform, you can streamline feedback cycles, reduce rework, and accelerate the journey from concept to production-ready dashboards. Ultimately, the success of your dashboards begins with a wireframe that is intuitive, adaptable, and tailored to your users’ needs.
Frequently Asked Questions
The best wireframing tool for dashboards depends on your needs, but top options in 2026 include Mokkup.ai. It offers ready-to-use dashboard templates, drag-and-drop features, and seamless collaboration for faster design.
Yes, you can wireframe dashboards without coding using no-code dashboard wireframing tools. They provide simple interfaces and pre-built elements to visually design dashboard layouts.
Yes, several free dashboard wireframing tools, such as Mokkup.ai, offer basic templates and features. They are ideal for startups, small teams, or anyone testing dashboard design before upgrading to paid versions.
Wireframing is important because it helps plan the dashboard layout, KPIs, and user experience before development. This ensures dashboards are user-friendly, functional, and aligned with business goals.
To create a dashboard wireframe, start by defining your KPIs. Then, use a wireframing tool like Mokkup to arrange charts, tables, and filters. Most tools offer drag-and-drop features and templates to speed up the process.
Prompt it. Wireframe it with Mokkup.ai.
