Data dashboards have evolved beyond simple charts and static displays. Today, understanding data dashboard trends is critical as businesses adopt AI-powered dashboards, real-time dashboards, and predictive analytics dashboards to monitor performance, identify issues, and make faster, data-driven decisions.
In 2026, data dashboards will be smarter, more automated, and easier to use. Advances in AI, real-time data processing, and user experience design are influencing how dashboards are produced and used in enterprises.
Table of Contents
- What Are Data Dashboards?
- What’s New in Data Dashboards in 2026
- Key Data Dashboard Trends to Watch in 2026
- How to Prepare for These Dashboard Trends
What Are Data Dashboards?
A data dashboard is a visual interface that combines key metrics, reports, and data elements into a single view. It enables users to track performance, analyze trends, and understand what is happening across various parts of an organization.
Finance, marketing, operations, product development, and leadership teams often use dashboards. Instead of sorting through spreadsheets or reports, users can use dashboards to get a clear, timely picture of what matters most.
What’s New in Data Dashboards in 2026
Data dashboards in 2026 are shifting from passive reporting tools to active decision-support systems. Instead of relying on users to manually explore data, modern dashboards are designed to surface insights, explain changes, and support faster action across teams.
Key changes shaping dashboards this year include:
- AI-driven insights that automatically identify patterns, anomalies, and trends.
- Predictive analytics dashboards are increasingly integrated for forecasting and planning
- Real-time dashboards that update automatically without delays
- Smarter automation in dashboard creation, layout, and chart selection.
- Personalized views based on user role, goals, and usage behavior.
This shift is already well underway. Around 40% of dashboards are now integrated with AI features for predictive insights, highlighting how quickly intelligence is becoming a standard expectation rather than an advanced capability. As a result, dashboards in 2026 are expected to be more proactive, intuitive, and closely aligned with how teams make decisions.
Key Data Dashboard Trends to Watch in 2026
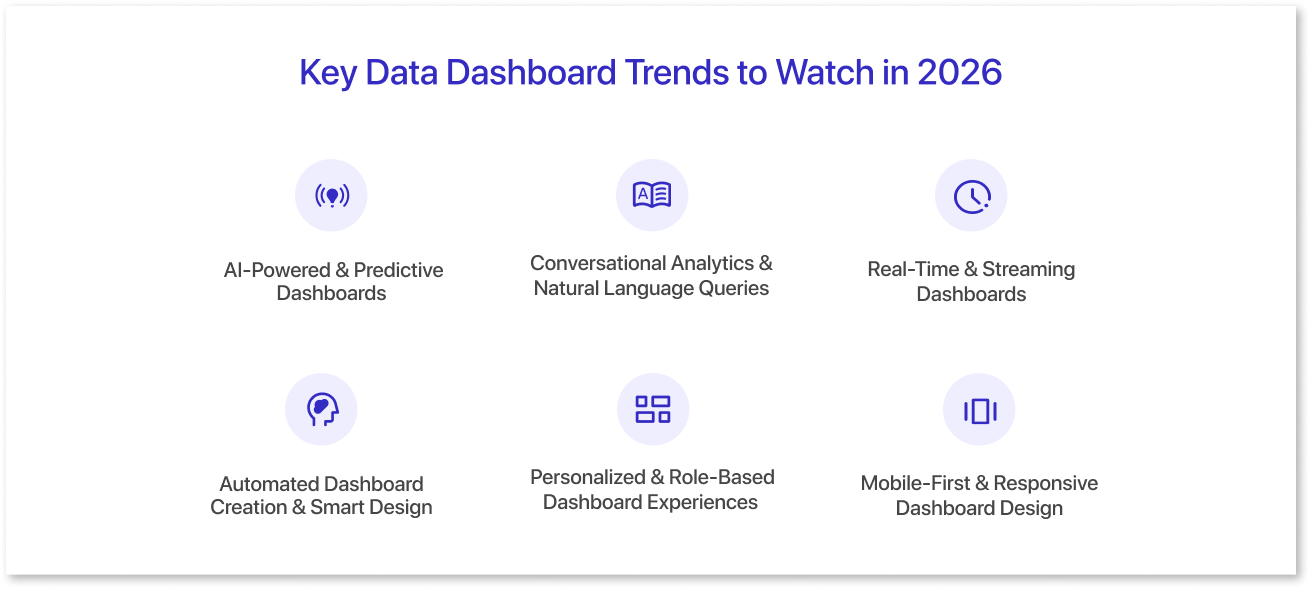
As dashboards evolve, numerous factors are influencing how businesses design, build, and use them in 2026. These trends indicate a move toward smarter analytics, faster access to insights, and experiences that adapt to user demands rather than requiring users to adapt to the data.
1. AI-Powered and Predictive Dashboards:
AI-powered dashboards are becoming central to modern analytics. Instead of focusing only on historical performance, these dashboards help teams anticipate outcomes and act faster. Predictive analytics dashboards use machine learning to highlight what is likely to happen next and where attention is needed.
Key capabilities driving this trend are:
- Predictive metrics that forecast future performance based on historical patterns.
- Automated anomaly detection that flags unusual changes without manual monitoring.
- Insight prioritization that surfaces the most relevant trends first.
- Recommended actions based on data patterns and business context.
As AI becomes more fully integrated into analytics tools, predictive dashboards minimize data analysis time while enhancing confidence when making decisions. In 2026, this trend will assist teams in transitioning from reactive reporting to proactive planning, making dashboards more strategic and actionable.
2. Conversational Analytics and Natural Language Queries:
Conversational analytics is changing how users interact with dashboards. Instead of navigating filters, dropdowns, and complex menus, users can now ask questions in plain language and receive quick visual responses. This makes dashboards more accessible, especially for non-technical users.
Key developments in this area include:
- Natural language queries that allow users to ask questions using everyday terms.
- Instant visual responses are generated automatically from user queries.
- Reduced dependency on manual filters and complex configurations.
- AI-powered wireframing tools like Mokkup.ai, which offer a Create with AI feature to generate dashboard wireframes from simple prompts.
- Broader adoption across teams beyond analysts and data specialists.
By lowering the learning curve, conversational analytics is helping more users engage with data confidently. In 2026, dashboards that support natural language interaction are improving adoption rates and ensuring insights are available to a wider range of decision-makers.

3. Real-Time and Streaming Dashboards:
Real-time dashboards are becoming even more important as businesses operate in faster and more dynamic environments. Instead of depending on periodic data refreshes, teams now expect dashboards to reflect what is happening as it happens, enabling quicker responses to changes and issues.
Key aspects of this trend include:
- Live data updates powered by streaming data pipelines.
- Immediate visibility into operational, financial, and customer metrics.
- Faster issue detection for performance drops or system anomalies.
- Stronger support for time-sensitive decisions across teams.
As real-time access becomes the norm, streaming dashboards benefit organizations in transitioning from delayed reporting to continuous monitoring.
4. Automated Dashboard Creation and Smart Design:
Dashboard creation is becoming faster and more efficient due to automation. By 2026, AI-assisted technologies will enable users to create dashboards with minimal manual work by proposing layouts, picking the appropriate chart types, and arranging metrics based on context and goals.
The key developments influencing this trend include:
- Dashboard layouts are developed automatically based on the data format and use case.
- Intelligent chart recommendations that align metrics with relevant visuals.
- Reduced setup time from raw data to useful dashboards.
- decreased reliance on technical expertise for dashboard building.
By simplifying the design process, automated dashboard production makes analytics more accessible to enterprises. In 2026, smart design skills will allow teams to focus on insights and outcomes rather than dashboard setup and formatting.
5. Personalized and Role-Based Dashboard Experiences:
As more teams rely on dashboards, personalization is becoming essential. In 2026, dashboards are designed to adapt to different users, ensuring that each role sees the most relevant metrics without unnecessary clutter.
Key features driving this trend include:
- Role-based views tailored to job functions and responsibilities.
- Customizable layouts based on individual preferences.
- Dynamic content that adjusts to user behavior and usage patterns.
- Focused KPIs aligned with team and business goals.
- Improved clarity by reducing information overload.
By delivering more relevant views, personalized dashboards are helping users focus on what matters most. In 2026, this approach is improving usability and driving stronger engagement across teams.
6. Mobile-First and Responsive Dashboard Design:
With more users accessing data on the go, mobile-first dashboard design is no longer an option. In 2026, dashboards are being built to deliver a consistent and usable experience across desktops, tablets, and smartphones.
Key elements of this trend include:
- Responsive layouts that adjust to different screen sizes.
- Touch-friendly interactions for mobile and tablet users.
- Simplified visual design for smaller screens.
- Consistent performance across devices.
- Improved accessibility for remote and hybrid teams.
By prioritizing mobile usability, dashboards in 2026 ensure that insights are always available, regardless of where users are working from.
How to Prepare for These Dashboard Trends
Preparing for modern dashboard trends in 2026 requires a balance between technology, design, and user needs. Teams should focus on building dashboards that are flexible, intelligent, and easy to adopt across the organization.
Key steps to consider include:
- Investing in AI-ready analytics tools that support predictive insights.
- Designing dashboards around users and roles, not just data.
- Prioritizing real-time and scalable data infrastructure.
- Embedding dashboards into everyday workflows.
- Continuously testing and improving dashboard usability.
By planning with these priorities in mind, organizations can ensure their dashboards remain relevant and effective as analytics expectations continue to evolve.
Conclusion
Data dashboards in 2026 are no longer just reporting tools. They are becoming intelligent, real-time, and deeply integrated into business workflows. From AI-powered dashboards to real-time dashboards and predictive analytics dashboards, modern dashboards guide users toward action, not just information.
Organizations that adapt to these data dashboard trends will respond faster, scale efficiently, and turn data into meaningful insights. Focusing on usability, automation, and insight-driven design is key to building dashboards that deliver real value.
Frequently Asked Questions
In 2026, data dashboards are used to monitor performance, track real-time metrics, and support faster decision-making. They help teams move beyond static reports by providing predictive insights, automated alerts, and role-based views.
Traditional dashboards focus mainly on historical data, while AI-powered dashboards analyze patterns, predict outcomes, and highlight anomalies automatically. This reduces manual analysis and helps teams act proactively instead of reactively.
Not always. Many modern dashboard tools offer automated design, smart chart recommendations, and conversational analytics. These features make it easier for non-technical users to create and use dashboards effectively.
Prompt it. Wireframe it with Mokkup.ai.
