
In the world of marketing, understanding how well our plans are working is super important. But sometimes, the reports we get need to match what we need. That's where the "Marketing Reporting Gap" comes in – it's the difference between what we expect from reports and what we actually get. This blog will explore why this gap happens, how it affects our decisions, and what we can do about it. From wanting clear insights to dealing with messy data and slow reporting, we'll uncover why this gap exists and how businesses can fix it.
Table of Contents
- Understanding the Marketing Reporting Gap
- Challenges in Marketing Measurement
- How to Bridge this Gap by Using Mokkup.ai
- Other Technology and Tools for Bridging the Gap
Understanding the Marketing Reporting Gap
The marketing reporting gap refers to the disparity between the data available to marketers and their ability to interpret and utilize that data to inform decision-making effectively. It happens when we want market reports to show us everything we need to know, be quick to give us information, match our big goals, fit everyone's needs, and tell us what to do next. But often, reports have too much data, take too long, don’t match our goals, are the same for everyone, and don’t give clear advice.
To fix this gap, we need to make reporting simpler and better. We can use tools to collect data faster and show it in ways everyone can understand. We also need to talk more with our teams and leaders about what we need from reports. By working together, we can make reports that help us do better in marketing.
Let’s analyze the gap between expectation and reality.
The Expectation
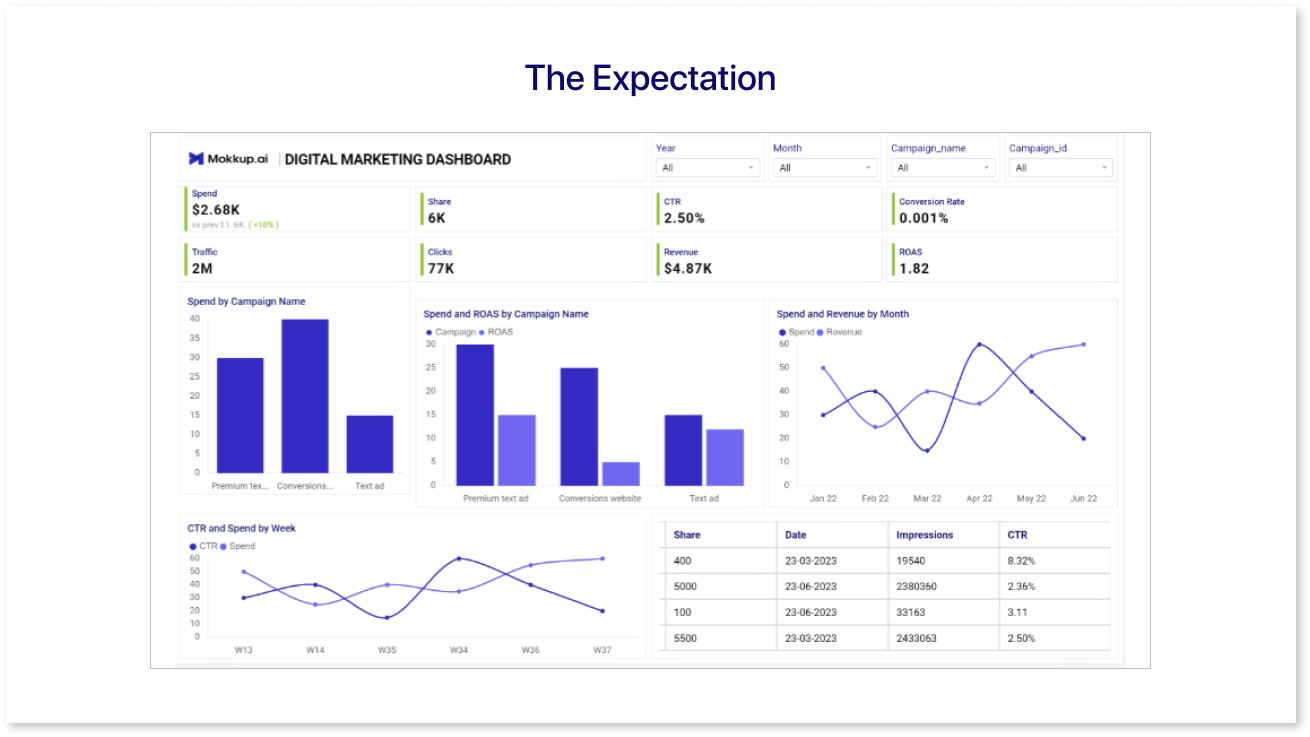
Marketing teams expect that data teams will provide comprehensive dashboards, consolidating all data across brands and categories into one easily accessible platform. The hope is that these dashboards will offer both high-level overviews and in-depth analyses, eliminating the need for cumbersome spreadsheets.
The Reality
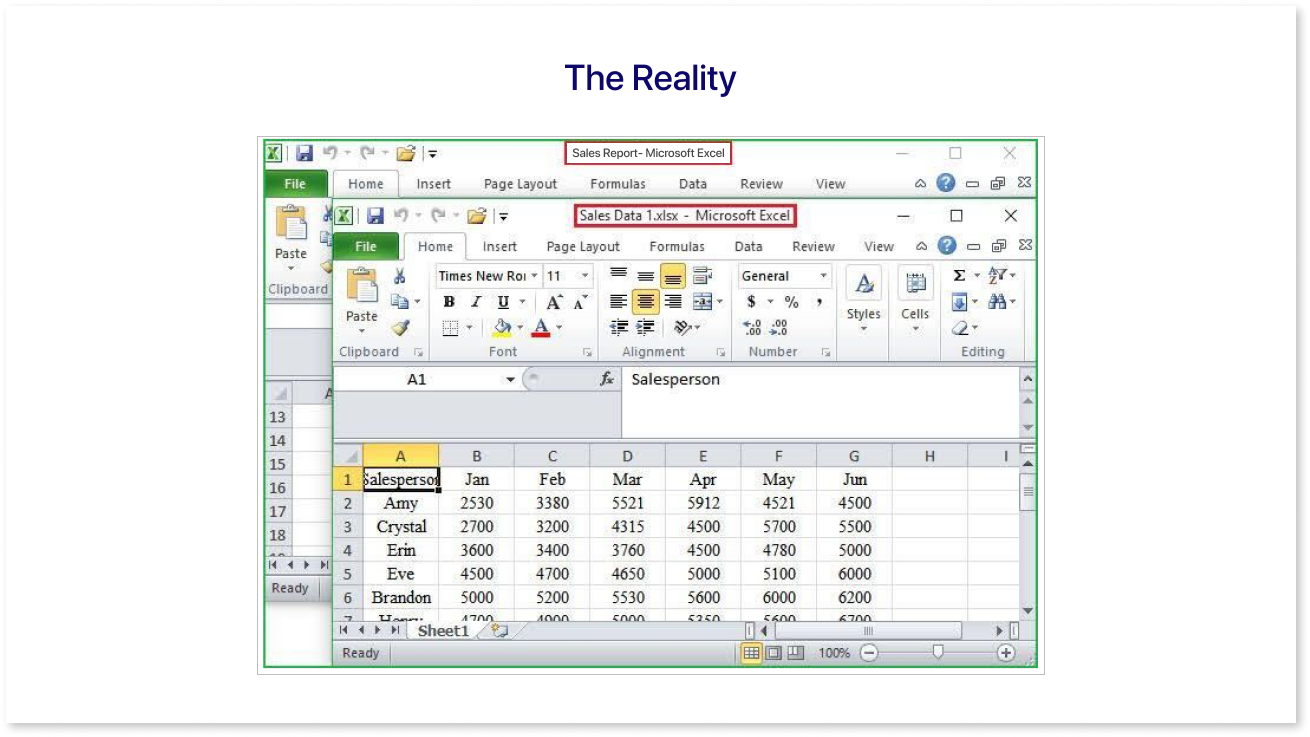
However, this expectation often falls short. Despite efforts to create consolidated dashboards, data fragmentation and inconsistencies persist. High-level dashboards may lack the depth required for thorough analysis, while reliance on spreadsheets remains prevalent due to data gaps and accessibility issues. This discrepancy highlights the challenges in accurately conveying what is needed vs dashboards that are developed.
Challenges in Marketing Measurement
Marketing teams face numerous challenges when it comes to measuring their efforts effectively. These challenges include data fragmentation across various platforms, difficulty attributing outcomes to specific marketing activities, and the lack of standardized metrics for comprehensively evaluating performance. From social media channels to email marketing platforms and website analytics tools, the dispersion of data across disparate systems creates a fragmented landscape that impedes the seamless aggregation and analysis of key performance indicators. This fragmentation complicates the process of accessing relevant data and hampers the ability to derive actionable insights that inform strategic decision-making.
Why do Marketing Teams Keep Going to Spreadsheets?
Despite the availability of sophisticated analytics tools, many marketing teams still rely heavily on spreadsheets for data analysis and reporting. This reliance stems from several factors, including team members' familiarity and comfort level with this traditional method.
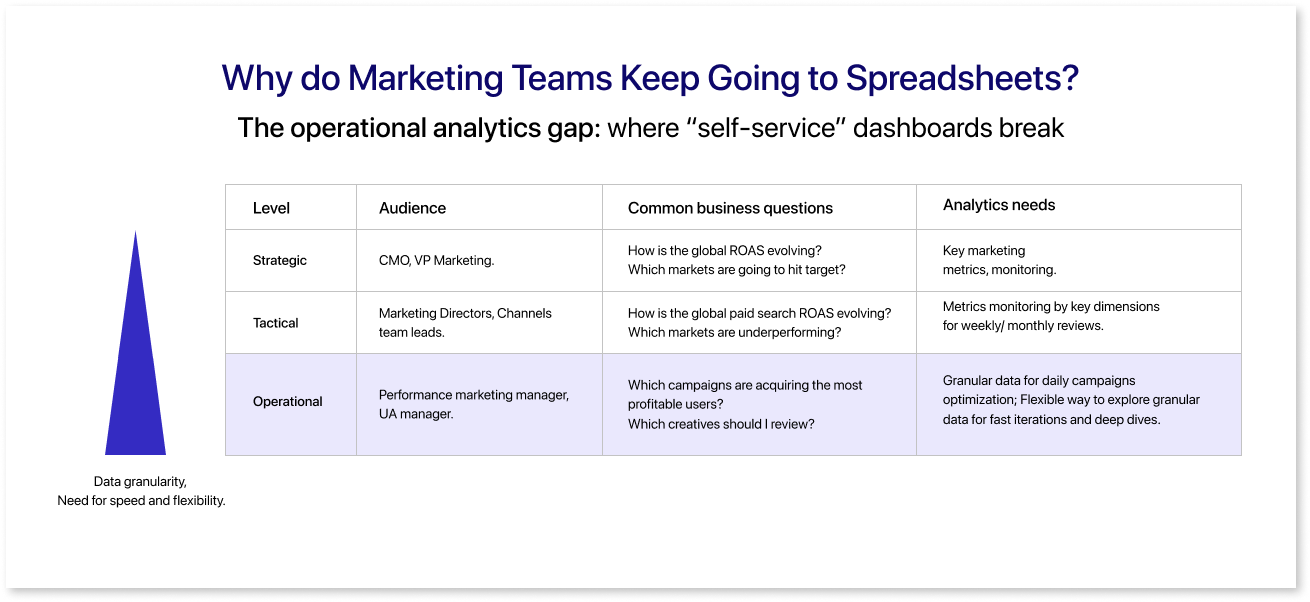
Furthermore, spreadsheets offer unparalleled data manipulation and analysis capabilities, empowering marketing teams to manipulate, normalize, sort, and filter data easily. Additionally, they facilitate the creation of pivot tables for in-depth drill-down analysis. With these features, marketers can efficiently tailor their analyses to specific needs and preferences, ensuring reports are customized to align with unique requirements and objectives. This flexibility extends to data visualization, enabling teams to present insights in a format that is easily digestible and actionable for stakeholders.
How This Gap Leads to Missed Opportunities
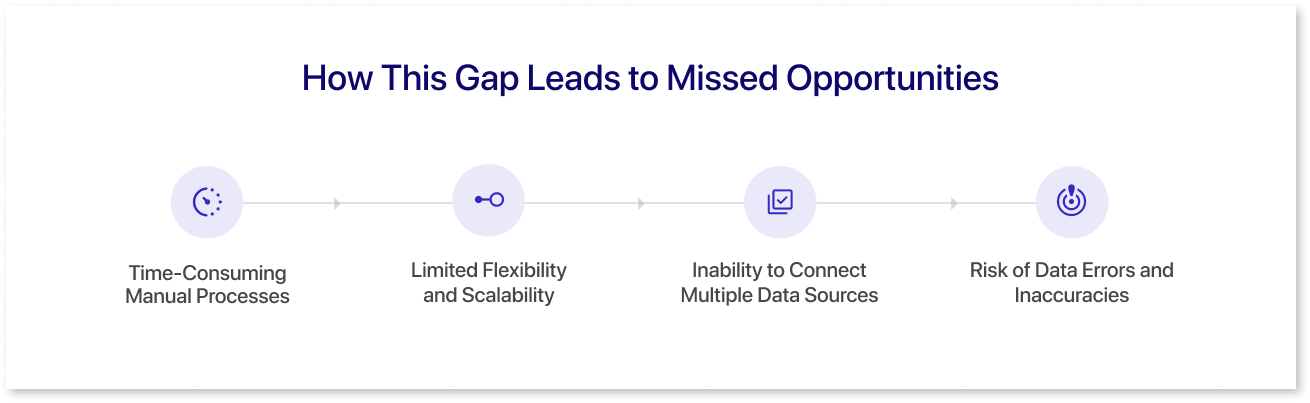
The persistent use of spreadsheets in marketing performance measurement creates a significant gap between the desired state of comprehensive, real-time analytics and the reality of fragmented, manual processes. This gap results in missed opportunities for timely decision-making, inefficient allocation of resources, and an inability to capitalize on emerging trends or opportunities. Furthermore, it hampers the ability of marketing teams to demonstrate the true impact of their efforts and justify investments to key stakeholders.
Spreadsheets are inherently limited in their ability to provide real-time insights and updates. Some of the reasons are:
- Time-Consuming Manual Processes: Building and maintaining marketing reports in spreadsheets often involves manual data entry and manipulation. Marketers spend significant time gathering data from various sources, copying and pasting it into spreadsheets, and manipulating it for analysis. This manual process is time-consuming and prone to errors, leading to delays in generating insights and taking action.
- Limited Flexibility and Scalability: Spreadsheets have limitations in handling large datasets and complex analyses. As marketing campaigns grow in scale and complexity, spreadsheets may need help to accommodate the volume of data or perform advanced calculations. This lack of flexibility and scalability hampers marketers' ability to conduct in-depth analysis and derive meaningful insights from their data.
- Inability to Connect Multiple Data Sources: Marketing data is often scattered across multiple platforms and systems, including CRM software, social media channels, email marketing tools, and website analytics platforms. Spreadsheets typically cannot directly connect to these disparate data sources, requiring manual data export/import processes or third-party integrations. This fragmented approach makes obtaining a unified view of marketing performance and customer behavior challenging.
- Risk of Data Errors and Inaccuracies: Spreadsheets are susceptible to human errors, such as typos, formula mistakes, and accidental data deletions. These errors can compromise the integrity of marketing reports and lead to incorrect conclusions or decisions. Additionally, spreadsheets need to have built-in validation checks and audit trails, making it difficult to identify and rectify errors in a timely manner.
To mitigate the negative impact of spreadsheets on marketing reporting, organizations should consider investing in dedicated marketing analytics platforms or business intelligence tools. These tools offer advanced data integration capabilities, automated reporting workflows, and robust analytics features that streamline the process of data analysis and visualization. While each marketing tool provides its own analytics in some way, marketing dashboards are the only way to combine everything seamlessly.
How to Bridge this Gap by Using Mokkup.ai
Mokkup.ai is a cloud-based dashboard wireframing tool that revolutionizes the design process. With over 150 customizable templates and 20 drag-and-drop elements, crafting stunning dashboard wireframes has never been easier. It allows marketers to directly communicate with developers to get the insights they truly need to run a successful marketing campaign.
We offer templates specifically designed to educate marketing professionals on industry-standard Key Performance Indicators (KPIs). Let's delve into each template and explore its use case:
1. Customer Journey
- This template provides a comprehensive overview of the customer journey, from initial awareness to conversion and retention.
- Use Case: A marketing manager can track key touchpoints along the customer journey, such as total conversions, ROI, average daily users, etc, to identify opportunities for optimization and personalization.
2. Website Health
- Monitor the health and performance of your website with this template, which includes metrics such as traffic sources, page views, bounce rate, conversion rate, etc.
- Use Case: A digital marketer can assess the effectiveness of different marketing channels in driving traffic to the website and identify areas for improvement in user experience and content strategy.
3. Webinar Analysis
- Evaluate the success of your webinars by analyzing metrics such as registration rate, attendance rate, engagement levels, etc.
- Use Case: A webinar organizer can track the impact of promotional efforts, content relevance, and speaker performance to refine future webinar strategies and maximize ROI.
4. Social Media Analysis
- Gain insights into your social media performance across various platforms, including reach, engagement, follower growth, and sentiment analysis.
- Use Case: A social media manager can identify top-performing content, optimal posting times, and audience demographics to optimize social media marketing campaigns and drive brand awareness and engagement.
5. Email Marketing Analysis
- Measure the effectiveness of your email marketing campaigns by tracking metrics such as open rate, click-through rate, conversion rate, and unsubscribe rate.
- Use Case: An email marketer can segment email lists, A/B test subject lines and content, and analyze campaign performance to enhance email deliverability and drive customer engagement and conversions.
By using these templates, marketers can have a starting point for understanding important metrics to track and what suits their business. They can tweak these templates and share the wireframe with the BI developer to get an actual tailored dashboard with their data integrated.
Other Technology and Tools for Bridging the Gap
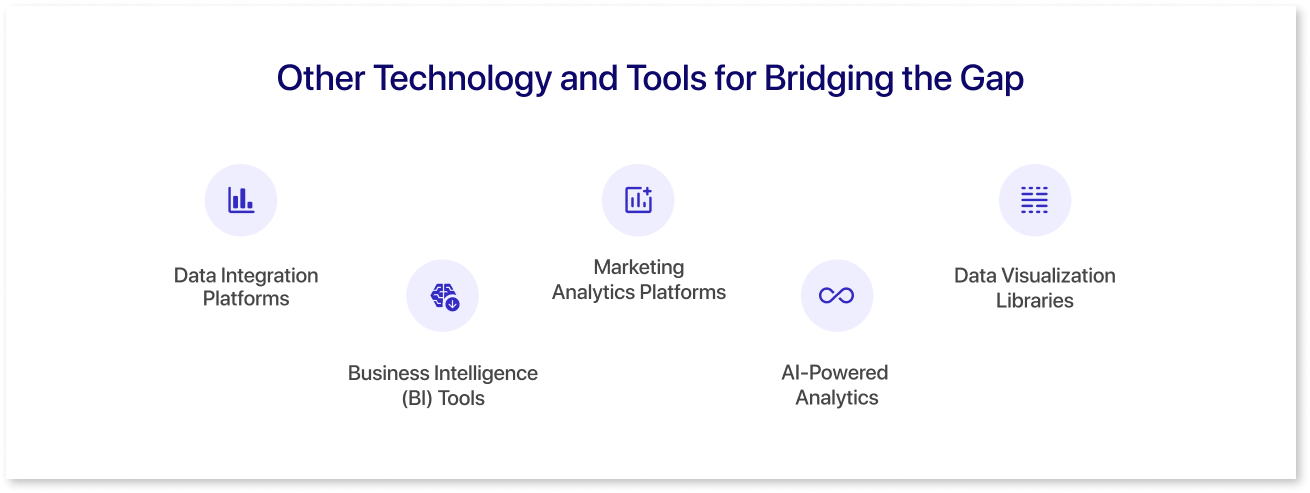
Bridging the marketing reporting gap often involves leveraging a combination of technologies and tools to streamline data collection, analysis, and presentation. Here's how various tools and technologies can be utilized, including Mokkup.ai:
- Data Integration Platforms: Use platforms like Zapier or Integromat to connect marketing data sources such as Google Analytics, Facebook Ads, and email marketing platforms. These platforms allow you to automate data collection and transfer between different tools.
- Business Intelligence (BI) Tools: BI tools like Tableau, Power BI, or Google Data Studio enable you to visualize and analyze marketing data effectively. These tools allow the creation of BI dashboards, making tracking key metrics and performance indicators easier.
- Marketing Analytics Platforms: Platforms like Adobe Analytics or HubSpot Analytics provide in-depth insights into marketing campaigns, website traffic, and customer behavior. They offer features such as cohort analysis, attribution modeling, and predictive analytics to help marketers make data-driven decisions.
- AI-Powered Analytics: Utilize AI-powered analytics tools like Google Analytics Smart Goals or IBM Watson Analytics to gain deeper insights from your marketing data. These tools use machine learning algorithms to identify large datasets' patterns, trends, and anomalies, enabling marketers to optimize their strategies accordingly.
- Data Visualization Libraries: Utilize powerful data visualization libraries like D3.js and Chart.js and innovative tools like ChartGPT to create interactive and visually captivating charts and graphs for your marketing reports. These libraries and tools provide extensive customization options and support various data formats, simplifying the communication of intricate insights in an engaging manner.
Integrating these technologies and reporting tools into your marketing reporting process can bridge the gap between data collection and actionable insights, empowering your team to make informed decisions and drive better results.
Conclusion
In conclusion, bridging the marketing reporting gap is crucial for organizations striving to make data-driven decisions and optimize their marketing efforts effectively. By implementing best practices such as defining clear objectives, leveraging automation tools, fostering collaboration, and ensuring data accuracy, businesses can overcome challenges in reporting and unlock valuable insights from their marketing data. As technology continues to evolve, the future of marketing reporting holds promise with real-time analytics, AI-powered insights, personalized reporting, and enhanced data visualization techniques. Closing the reporting gap facilitates better team communication and alignment and empowers organizations to stay agile, adaptive, and competitive in today's dynamic marketplace.
Prompt it. Wireframe it with Mokkup.ai.
