
What is an Instagram Analytics Dashboard?
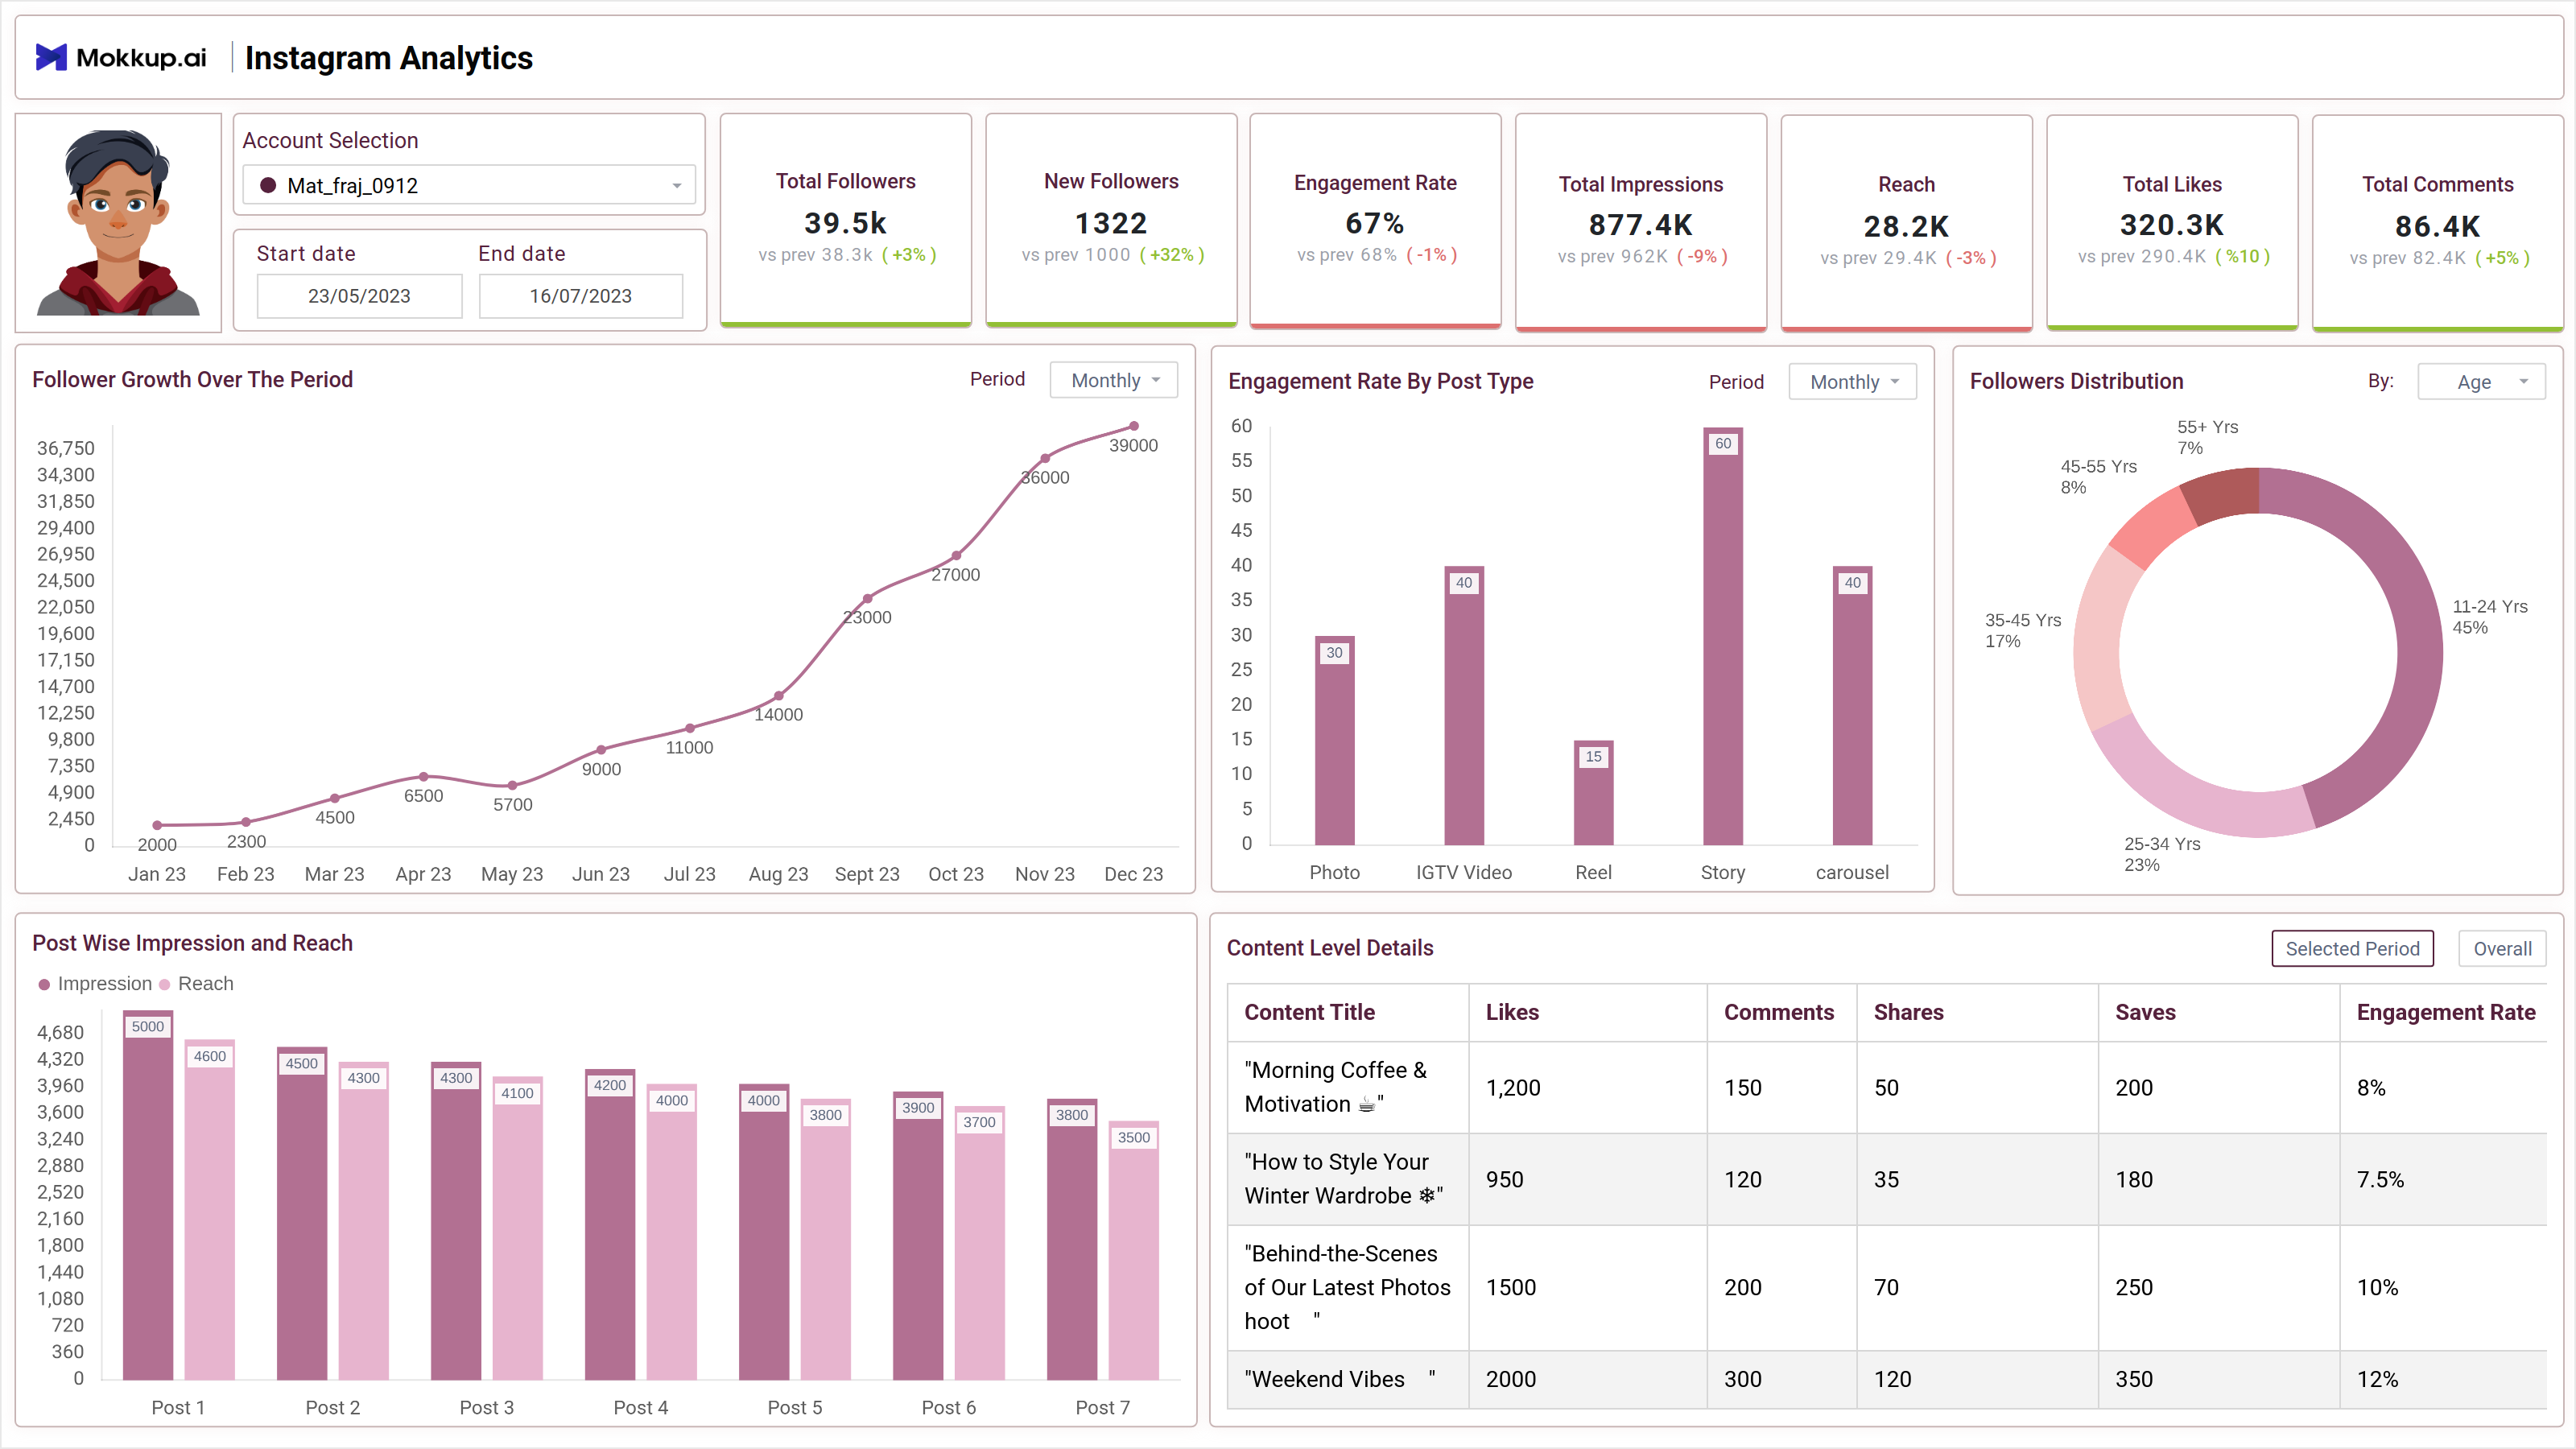
The Instagram Analytics dashboard template provides insights into Instagram account performance, audience engagement, and content effectiveness. It helps track follower trends, engagement metrics, and post-level analytics, enabling data-driven content strategies.
Instagram Analytics Dashboard Example
The Instagram Analytics Dashboard wireframe offers a complete view of account performance, content engagement, and audience insights. Built for social media marketers and content creators, this dashboard template makes tracking follower growth easy, analyzing post effectiveness, and refining content strategy using real-time metrics and visualizations.
How to Analyze Data in Instagram Analytics Dashboards
Focus on key performance metrics and content performance to effectively analyze data in the Instagram Analytics Dashboard. The dashboard wireframe provides insights that help you make data-driven decisions to optimize engagement and content strategy.
- Performance Overview: Gain a snapshot of essential metrics such as followers, impressions, reach, likes, and comments. Visualizations allow you to track growth trends and compare engagement across different post types or audience demographics.
- Content and Interaction Deep Dive: Dive into individual post performance by applying filters for content type and title. Analyze engagement peaks and identify top-performing posts based on interaction metrics.
Other Key Highlights:
- Seamlessly switch between accounts and time ranges using built-in filters.
- Compare impressions vs. reach to evaluate content visibility.
- Optimize your posting schedule with insights from the engagement heatmap.
- Enhance your Instagram story strategy with detailed interaction metrics.
How to Create an Instagram Analytics Dashboard
You don’t need to build your report from scratch—just start with a ready-to-use sample Instagram analytics dashboard template from Mokkup. Add in your data and export it however you like. Here’s how to do it:
1. Create or Log in to Your Mokkup Account
Start by signing up on Mokkup.ai using your email. Already have an account? Just log in, and you’re good to go.
2. Choose and Customize Your Dashboard Template
Find the Automotive maintenance report dashboard in the Templates section. Use the drag-and-drop editor to adjust KPIs, edit filters, or add elements based on your data.
3. Export to Your BI Tool
Once your dashboard wireframe is ready, use the BI Tool Export feature to send it directly to Power BI or Tableau for further analysis and enhancements. You can also download the dashboard as a PDF, PNG, or JPEG, embed it on a platform, or invite your team to collaborate.
Note: This is a Pro template. To use and customize this dashboard wireframe, you’ll need a Pro subscription on Mokkup. Upgrade anytime to unlock full access.
Benefits of Instagram Analytics Dashboards
Instagram Analytics Dashboards help users understand how their content is performing and how their audience is engaging. With clear visuals and real-time data, these dashboards make it easier to shape more innovative content strategies:
- Track follower growth and audience demographics easily
- Identify top-performing posts and content types
- Monitor engagement metrics like likes, comments, and shares
- Understand the best times to post using time-based heatmaps
- Measure reach and impressions to assess content visibility
- Improve campaign decisions with post-level performance insights
These dashboards take the guesswork out of Instagram strategy. With real-time insights, you can post smarter, engage better, and grow faster.
KPIs to Track in Instagram Analytics Dashboards
To understand what’s working on Instagram, tracking the right KPIs is key. These metrics help measure account performance, audience engagement, and content effectiveness.
Here are the KPIs you can track:
- Follower Growth Over Time: Tracks follower growth with a drop-down to select a time range.
- Engagement Rate by Post Type: Compares engagement across post types (Photo, IGTV, Reel, Story) with a drop-down for period selection.
- Follower Distribution: Displays follower demographics with a drop-down to filter by age, gender, location, device type, or language.
- Top Performing Posts: Lists posts ranked by different engagement metrics.
- Content Type Performance & Share: Compares engagement across content types with a drop-down for metric selection.
Frequently Asked Questions
Q1. How do Instagram Analytics Dashboards help track account performance?
They provide key metrics like followers, engagement rate, impressions, and reach, allowing you to monitor growth trends and evaluate content effectiveness.
Q2. Can I analyze specific posts and their performance?
Yes, the dashboard wireframe allows you to filter by content type and post title to drill down into individual post performance, helping you identify top performers and engagement patterns.