The marketing funnel maps out consumers' path, directing them from first becoming aware of you through making a purchase to completion. Organizations can impact customers by studying the marketing plan, which boosts sales, customer loyalty, and brand recognition. Effective marketing tactics require a thorough understanding of the customer journeys.
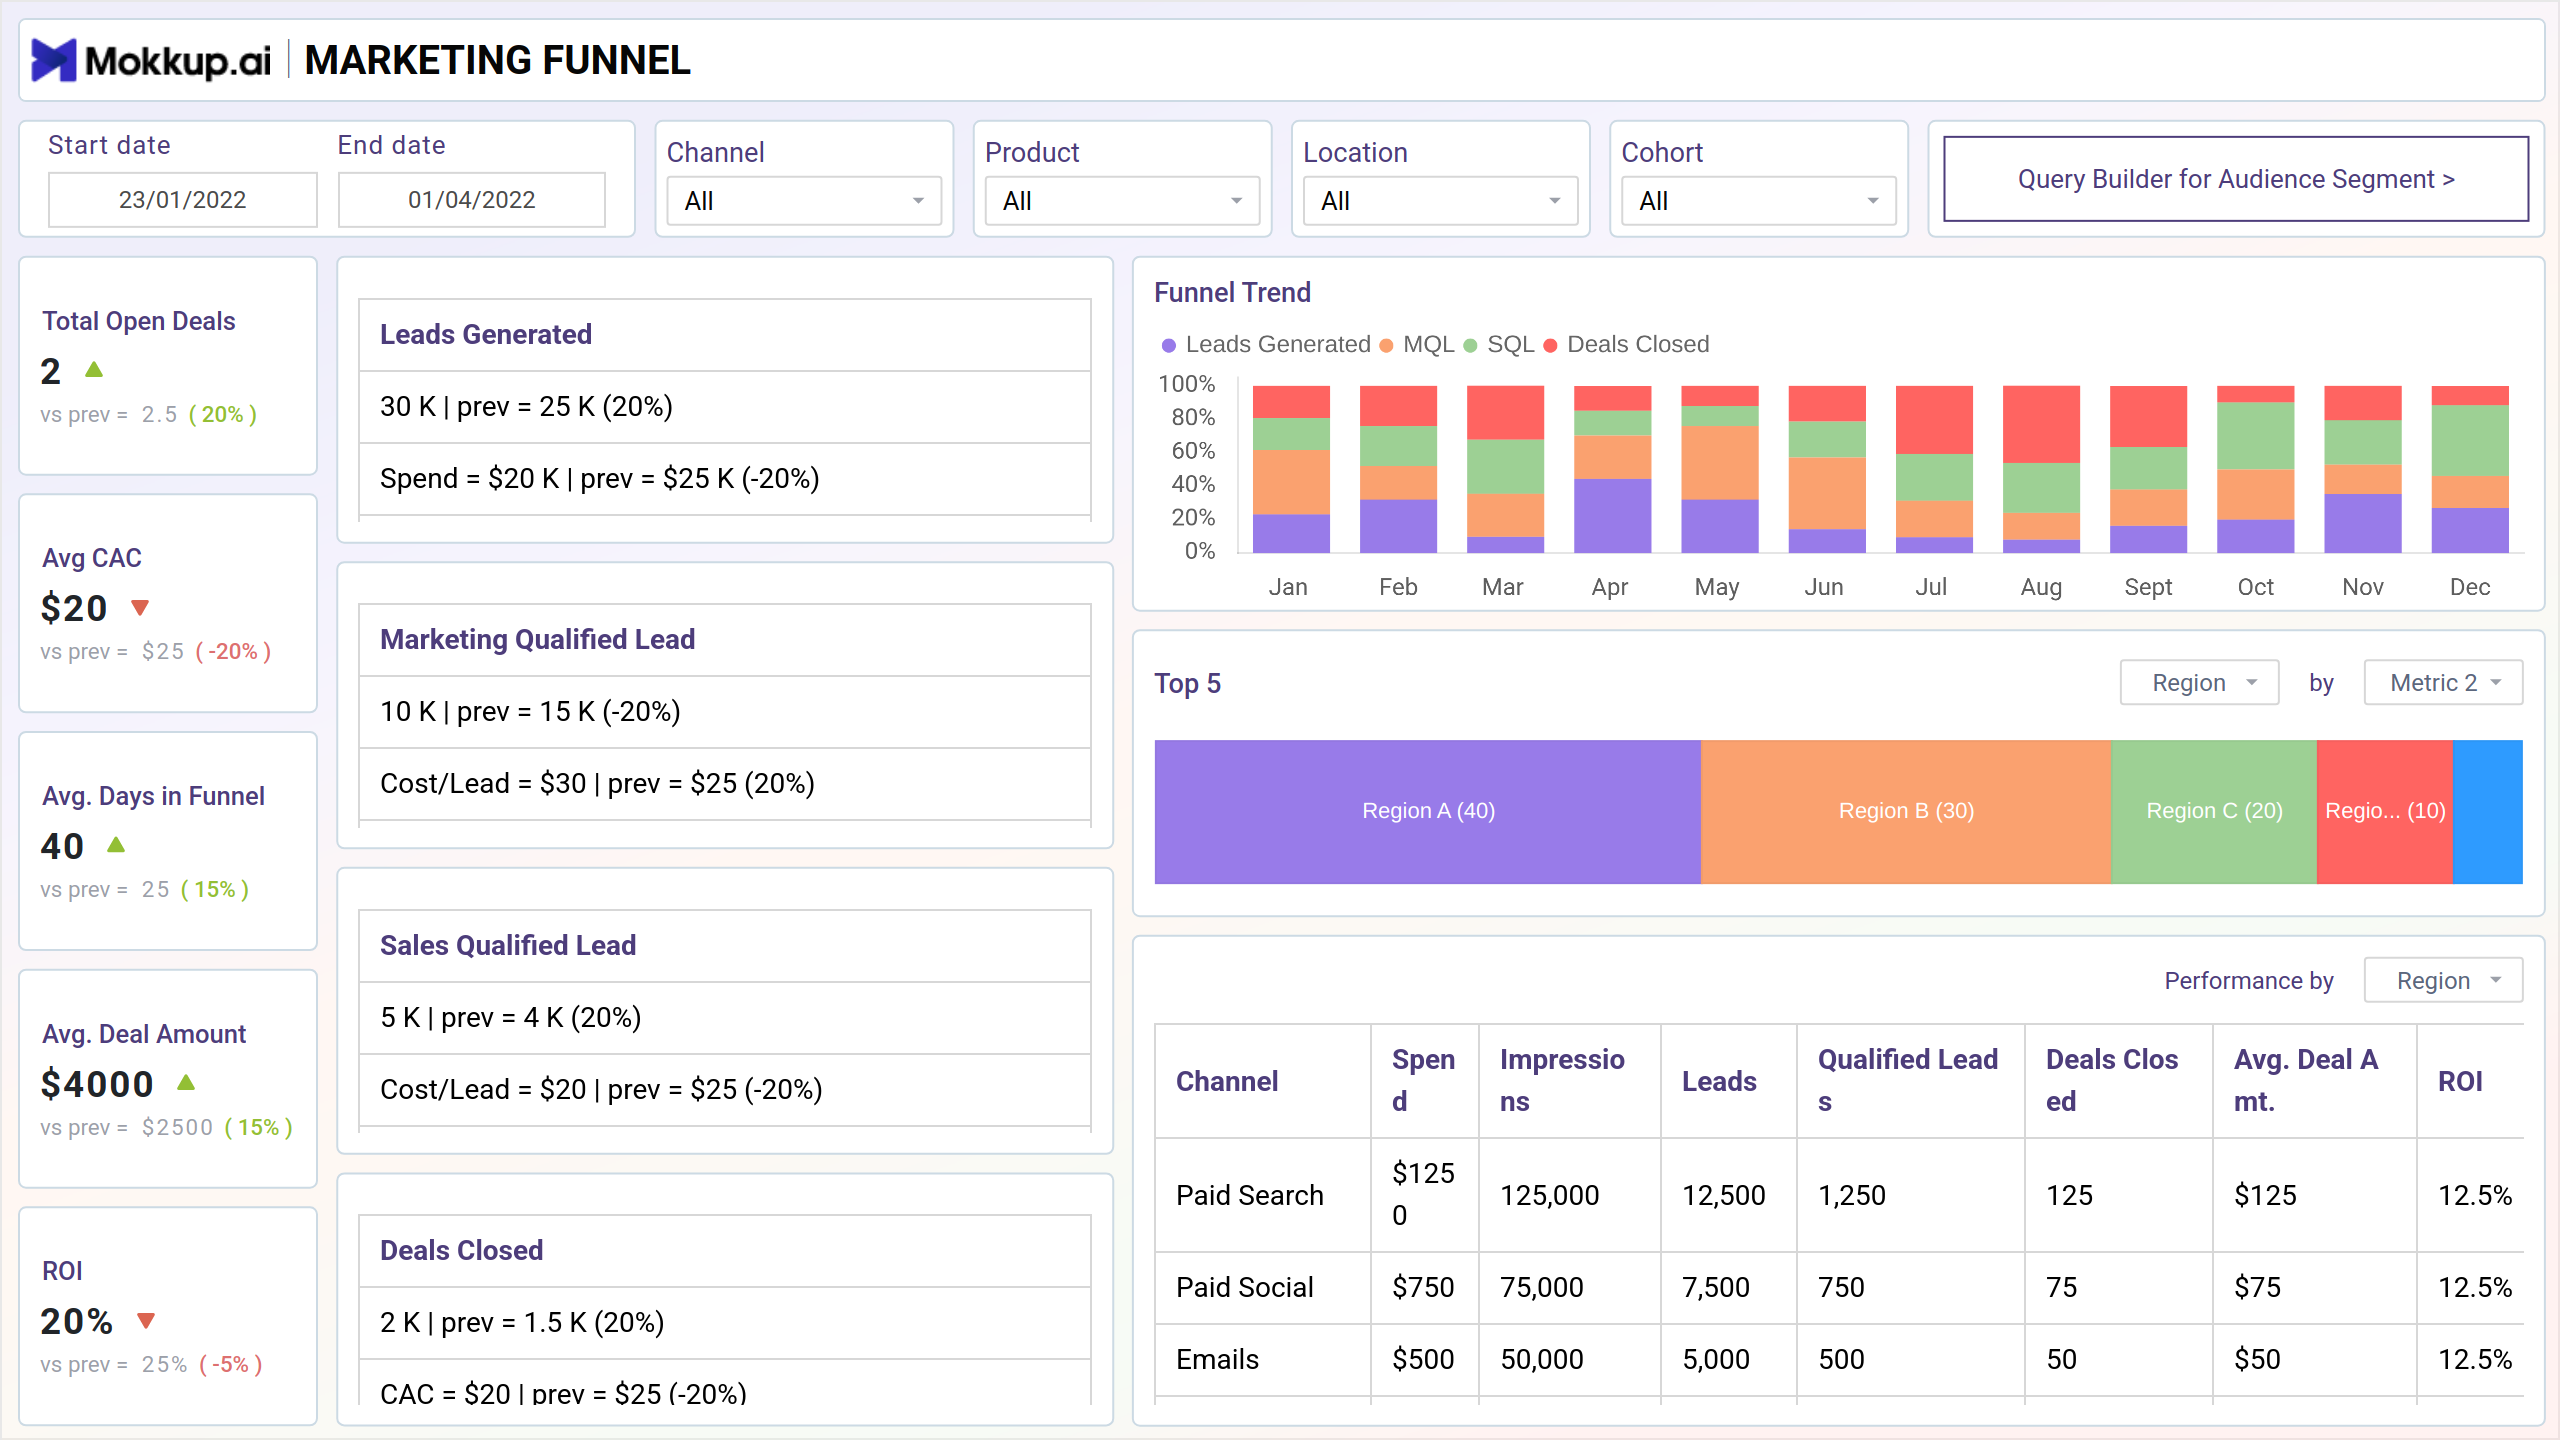
Screen 1: Executive Summary
This screen offers a high-level customer journey overview at different funnel stages.
Key Terms to consider:
- Leads Generated - Quantifies the total number of leads generated through marketing efforts.
- Marketing Qualified Lead - Identifies leads that meet the criteria for marketing efforts.
- Sales Qualified Lead - Identifies leads that meet the criteria for sales engagement.
- Deals Closed - Represents the number of deals successfully closed by the sales team.
- ROI - Calculates the return on investment, indicating the profitability of marketing efforts.
- Avg. Deal Amount - Provides the average value of closed deals, aiding in revenue forecasting.
- Avg. CAC - Calculates the average customer acquisition cost, essential for assessing marketing efficiency.
- Funnel Trend - Analyzes the trend in leads or opportunities moving through the sales funnel over time.
Screen 2: Comparison View
This screen helps compare performance among Channels, Regions, Products, and Cohorts.
Key Terms to consider:
- Cohort - Groups customers based on shared characteristics, enabling targeted analysis of their behavior.
- Query Builder for Audience Segment - Facilitates the creation of specific audience segments for targeted marketing efforts.
- Avg. Days in Funnel - Provides the average number of days it takes for leads to move through the sales funnel.
Screen 3: Funnel Performance
Evaluate the effectiveness of each funnel section.
Key Terms to consider:
- Channel Performance By Spend - Analyzes the performance of marketing channels based on the amount spent.
- Channel Performance By Goals Completed - Measures the success of marketing channels in achieving specific goals.
- Avg. CLTV - Calculates the average customer lifetime value, providing insights into long-term revenue potential.
- Retention % - Indicates the percentage of customers retained over a given period.
- Upgrade % - Measures the percentage of customers upgrading or purchasing additional products/services.
- Avg. AOV - Represents the average order value, helping gauge revenue per transaction.
- Avg. CTR - Calculates the average click-through rate, indicating engagement with marketing materials.
Screen 4: Sales Performance
This screen mainly analyzes the sales team's performance.
Key Terms to consider:
- Sales Team Performance - Evaluates the effectiveness of the sales team in achieving targets and closing deals.
- Unqualified Leads - Identifies leads that do not meet the criteria for sales qualification.
- Avg. Retention rate - Represents the average percentage of customers retained over a specific period.
Dashboard Template Insights
Metrics across various screens, such as leads generated, ROI, and sales team performance, provide a comprehensive understanding for effective marketing strategies. Leveraging modern machine learning and statistical analysis allows businesses to forecast results, set goals, and optimize their marketing funnel for success.
Conclusion
Organizations can identify concealed patterns, developments, and seasonalities in past information using modern machine learning algorithms. This makes it possible to forecast future results, set goals, and calculate marketing costs for lead creation.
The sales team's conversion obstacles and difficulties are revealed by examining funnel components. With this knowledge, marketing managers and salespeople can make the necessary adjustments to increase sales, improve the funnel, and develop more successful marketing plans. Utilizing innovation and statistical analysis allows businesses to maximize the effectiveness of their marketing funnel and achieve success.