What is a Social Media Engagement Report Dashboard?
A Social Media Engagement Report Dashboard template that shows how people interact with your social media content. It monitors likes, comments, shares, clicks, and follower growth across different platforms.
Instead of checking each social media account separately, this dashboard brings all the key data into one place, making it easy to evaluate what's working, what's not, and how your audience reacts to your postings. It enables marketers and teams to improve their content strategy and increase engagement.
Social Media Dashboard Example
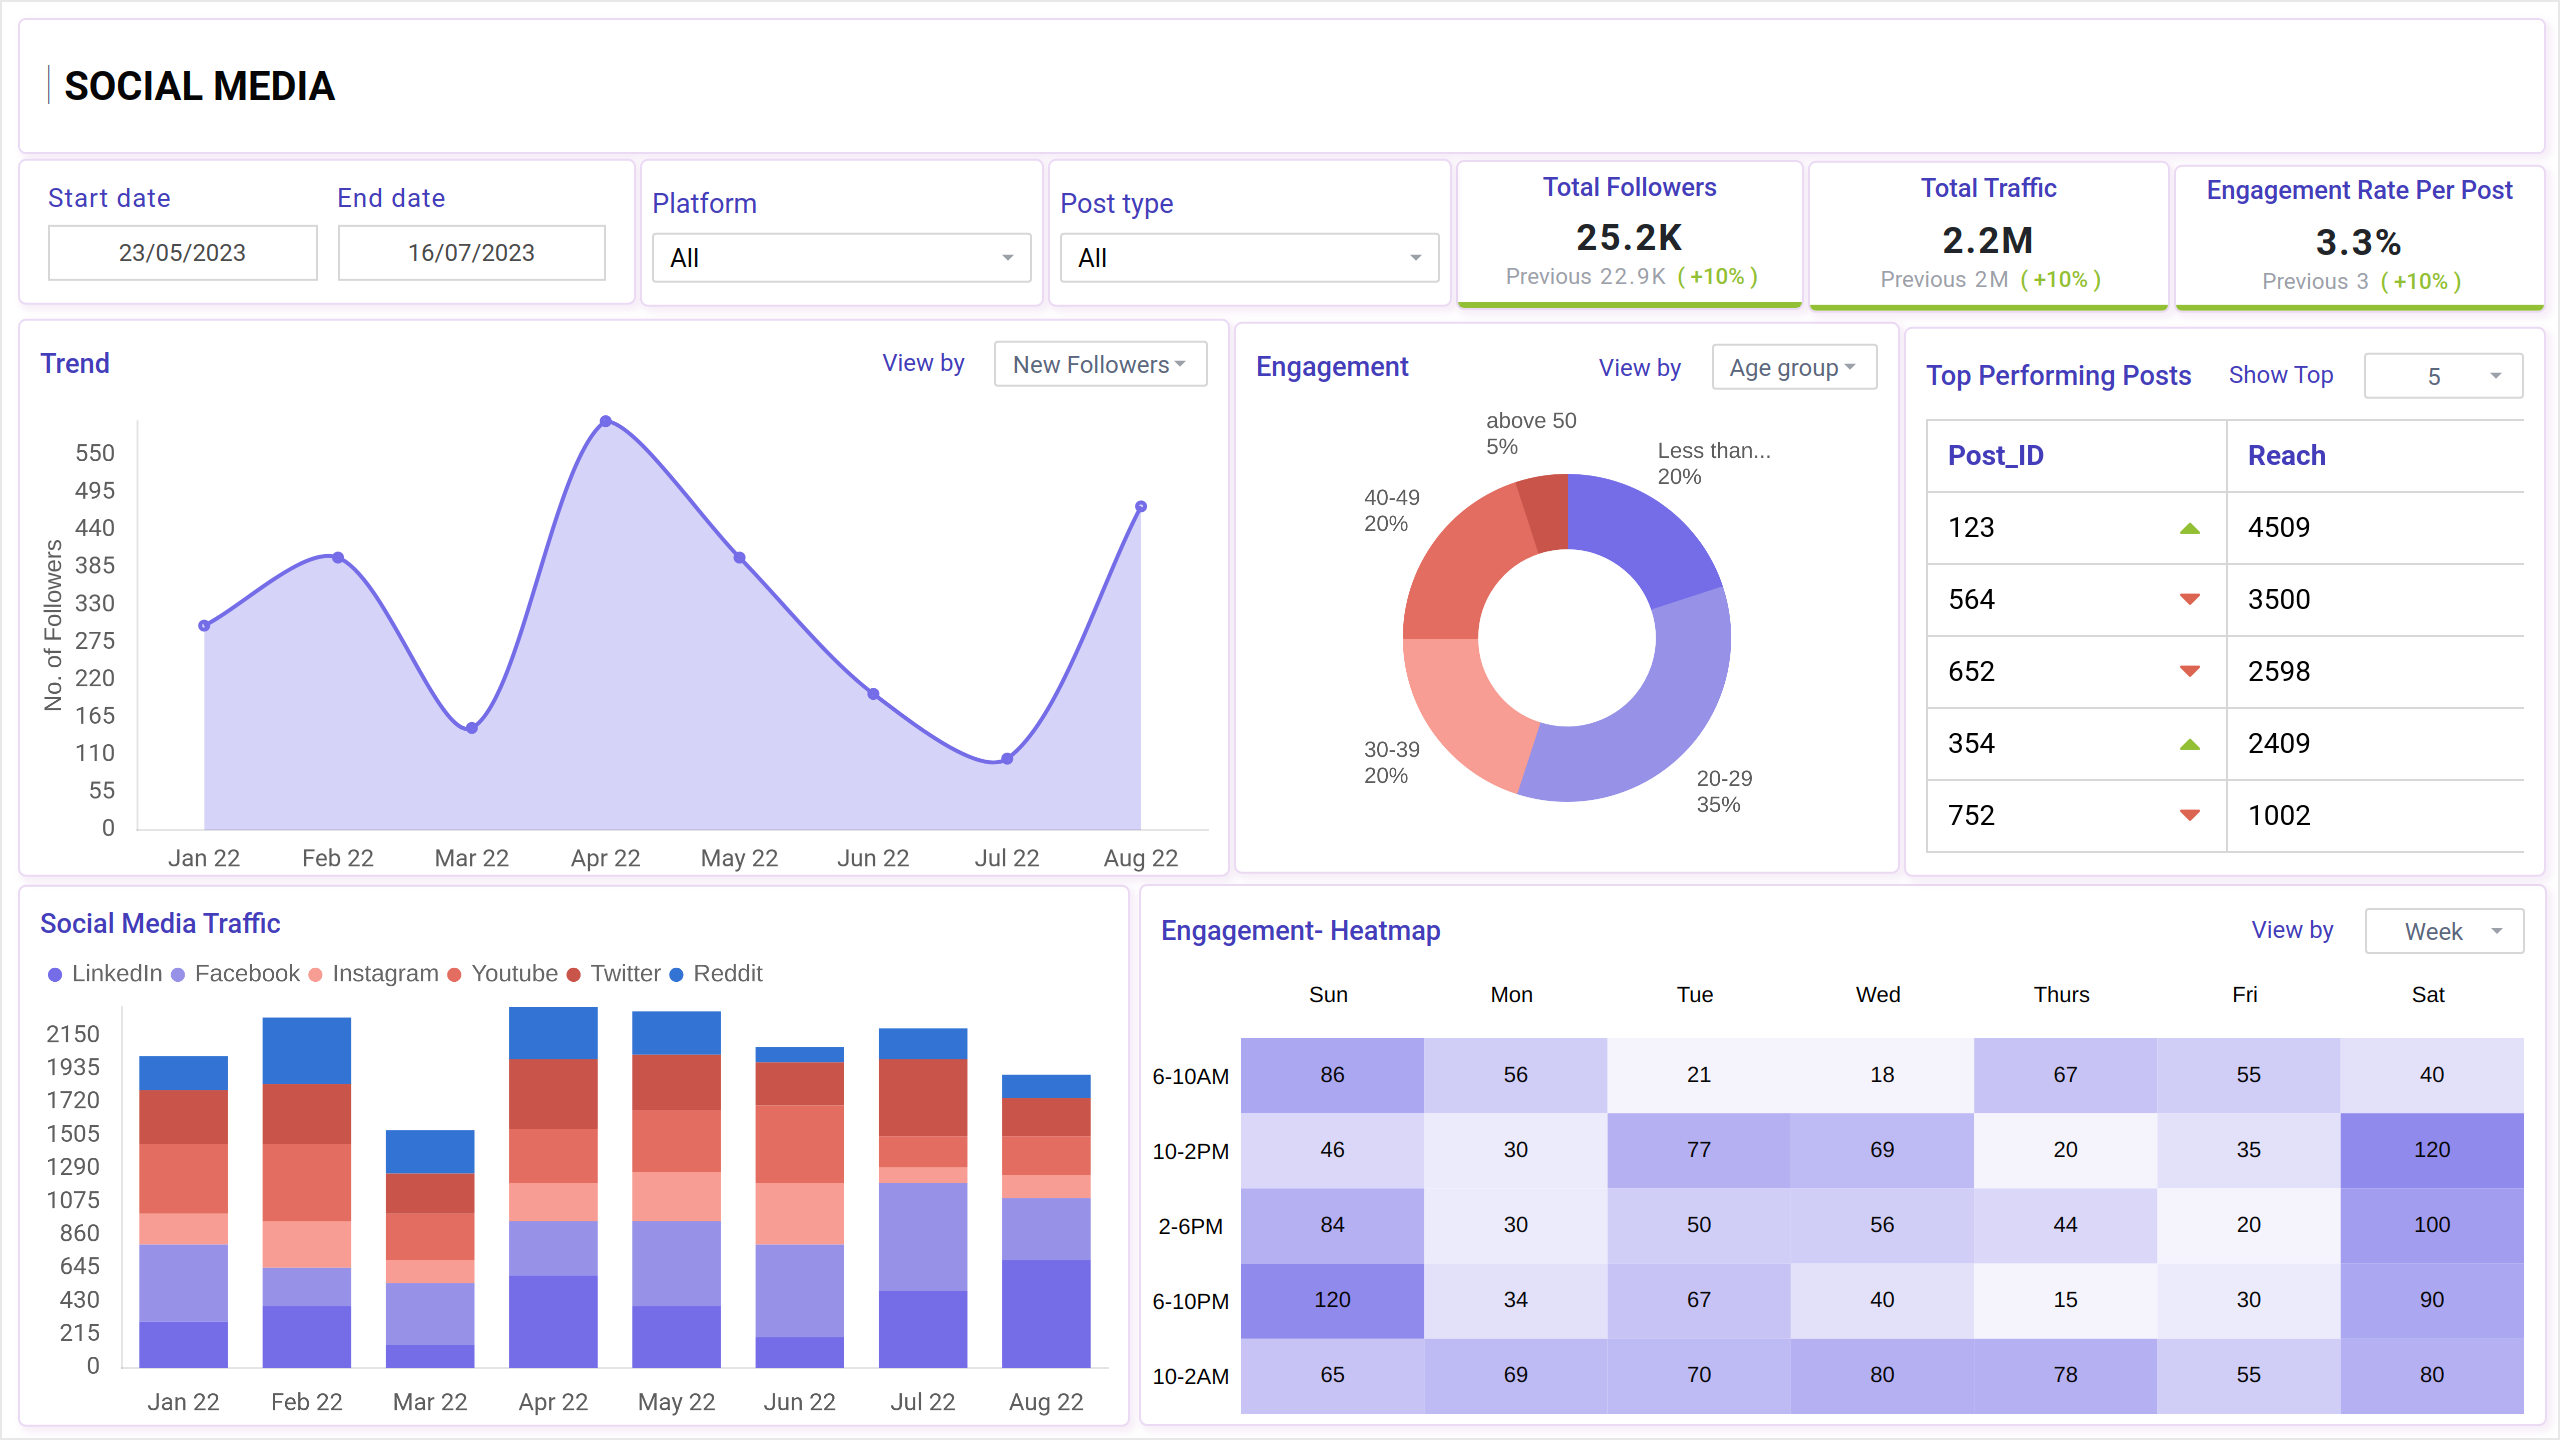
The Social Media Engagement Dashboard wireframe is designed to combine key performance metrics from platforms like Instagram, Facebook, Twitter, and LinkedIn in one clear layout. Built for marketing, content, and analytics teams, this template easily helps get engagement reports, top-performing posts, follower growth, and audience activity trends.
The layout can be tailored to fit specific reporting needs with customizable filters for platforms, post types, time ranges, and campaign names.
How to Analyze Data in Social Media Engagement Dashboards
Analyzing the social media engagement dashboard wireframe allows you to translate numbers into valuable insights. It's all about identifying what works, what doesn't, and where you can improve. Here is how to start:
- Examine Overall Engagement Trends: Begin by examining overall likes, comments, shares, and engagement rate to determine how your audience is reacting over time.
- Compare Platform Performance: Check which social sites generate the most traffic and engagement—this will help you focus your efforts.
- Identify Top-Performing Content: Examine the posts with the highest engagement to determine your audience's preferred content.
- Examine Audience Behavior: Tailor your posting strategy based on variables such as active time, follower demographics, and device usage.
- Track Campaign Results: Analyze how specific campaigns performed across channels regarding reach, clicks, and conversions.
- Monitor Sentiment: Check comment sentiment to see how your audience feels about the post or brand.
- Look for Patterns and Spikes: Identify unexpected spikes or reductions in data to determine what triggered them—new content, time of publishing, or trending topics.
By constantly analyzing this data, you can fine-tune your approach, develop engaging content, and achieve greater outcomes across your social media channels.
How to Create a Social Media Engagement Dashboard
You don’t need to build your report from scratch—just start with a ready-to-use sample Social Media Engagement template from Mokkup. Add in your data and export it however you like. Here’s how to do it:
1. Create or Log in to Your Mokkup Account
Start by signing up on Mokkup.ai using your email. Already have an account? Just log in, and you’re good to go.
2. Choose and Customize Your Dashboard Template
Find the Social Media Engagement Report dashboard template in the Templates section. Use the drag-and-drop editor to adjust KPIs, edit filters, or add elements based on your data.
3. Export to Your BI Tool
Once your dashboard wireframe is ready, use the BI Tool Export feature to send it directly to Power BI or Tableau for further analysis and enhancements. You can also download the dashboard as a PDF, PNG, or JPEG, embed it on a platform, or invite your team to collaborate.
Note: This is a Pro template. To use and customize this dashboard wireframe, you’ll need a Pro subscription on Mokkup. Upgrade anytime to unlock full access.
Benefits of Social Media Engagement Dashboards
Social media analysis lets teams track and understand how consumers interact with their content. These dashboards provide a comprehensive performance perspective by combining data from numerous platforms, allowing teams to make faster, more informed decisions. Here are some key benefits:
- Centralized Data View: This view aggregates engagement metrics from all platforms, eliminating the need to switch between apps or reports.
- Better Content Strategy: Helps identify which posts are performing best and what types of content drive the most interaction.
- Audience Insights: Provides details about follower demographics, peak activity times, and engagement patterns.
- Performance Trends: Demonstrates how engagement changes over time, assisting teams in identifying what works and what needs to be improved.
- Time-Saving Reports: Automatically generates reports with clear visuals, making sharing results with stakeholders or clients easy.
- Informed Decision-Making: Enables data-driven content development, ad spending, and overall social media strategy.
These dashboards not only save time but also clarify social media performance. Turning raw data into actionable insights, they help teams stay focused on what truly drives engagement.
KPIs to Track in Social Media Engagement Dashboards
Tracking the right KPIs in your social media engagement dashboard wireframe helps you measure success, understand your audience, and improve your content strategy.
Here are some essential KPIs to include:
- Engagement Rate: Measures the total engagement (likes, comments, shares, etc.) divided by total followers or impressions.
- Likes, Comments, and Shares: Basic interaction metrics show how users react to your content.
- Click-Through Rate (CTR): Measures the number of people who clicked on your post links, providing insight into content effectiveness.
- Follower Growth: Tracks how your follower count increases or decreases over time.
- Impressions and Reach: Impressions show how often your content is seen; reach indicates how many unique users saw it.
- Top Performing Posts: Highlights posts with the highest engagement, helping replicate successful content.
- Video Views and Completion Rate: Useful for tracking content performance and audience retention.
- Hashtag Performance: Measures engagement and reach generated from branded or campaign-specific hashtags.
- Audience Demographics: Provides insights into your followers’ age, gender, location, and interests.
- Sentiment Analysis: Tracks comments' positive, negative, or neutral tones to understand audience perception.
These KPIs give a complete picture of how your content is performing and where you can improve to boost engagement and grow your online presence.
Frequently Asked Questions
1. Why should I use a social media engagement dashboard?
A social media engagement dashboard helps you see all your essential metrics, likes, shares, comments, and clicks in one place. It saves time and makes understanding what’s working and needs improvement easier.
2. How often should I check my engagement dashboard?
It’s good to check your dashboard regularly, at least once weekly. This helps you spot trends early, adjust your content quickly, and keep your social media strategy on track.