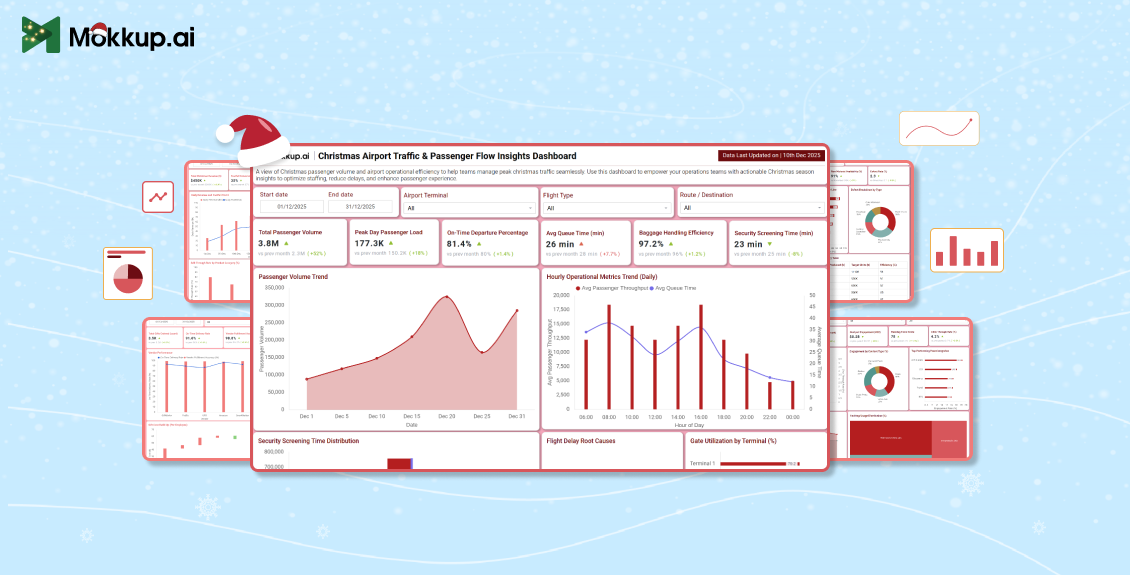
The holiday season is one of the busiest times of the year for businesses. Christmas campaigns go live, customer activity increases, and teams are expected to make fast decisions with little room for error. At the same time, data starts flowing in from multiple channels, making it harder to track performance clearly.
In fact, online holiday sales reached a record $241 billion during the 2024 holiday season, with spending up nearly 9 percent year-over-year as consumers leaned heavily on digital channels for their purchases.
This is where dashboards become essential. A well-designed business dashboard consolidates critical metrics in one place, enabling teams to monitor progress, identify issues early, and respond promptly. During the holiday rush, when speed and clarity matter most, dashboards are not only helpful but also necessary for efficient holiday analytics and decision-making.
Table of Contents
- Why Does the Holiday Season Create a Surge in Data?
- Why is Faster Decision-Making Critical During the Holiday Season?
- Why Do Cross-Functional Teams Need One Clear View of Performance During Christmas?
- Tracking the Right Seasonal KPIs During the Holiday Season
- 5 Christmas Dashboard Template Examples to Get You Started
- Why Ready-Made Dashboard Templates Save Valuable Time During Christmas
Why Does the Holiday Season Create a Surge in Data?
The holiday season drives a sharp increase in customer activity across digital channels. Website traffic increases, marketing campaigns run at a higher intensity, and sales volumes peak within a short timeframe. As a result, teams are required to monitor significantly more data than usual, often in real-time.
Relying on scattered reports or manual tracking becomes inefficient during this period. Metrics such as daily sales performance, campaign response rates, inventory levels, and customer engagement change rapidly and require constant attention. Dashboards enhance data visualization, making it easier to track performance without needing to switch between tools.
With data volumes growing rapidly and decisions needing to be made quickly, dashboards provide the clarity teams need to stay focused and in control throughout the holiday season.
Why is Faster Decision-Making Critical During the Holiday Season?
The Christmas or holiday season leaves little room for delay. Sales peaks can happen within hours, campaigns may need quick adjustments, and inventory issues must be addressed before they impact customers. In such a fast-moving environment, waiting for end-of-day reports or manual updates can lead to missed opportunities.
Dashboards provide teams with real-time visibility into key metrics, enabling them to respond promptly to changes as they occur. Whether it is a sudden spike in demand, a drop in conversion rates, or a campaign that is outperforming expectations, dashboards help decision-makers act with confidence.
By turning live data into clear insights, dashboards enable faster and more informed decisions. This speed becomes a significant advantage during the Christmas rush, when timing has a direct impact on results.
Faster decisions are only effective when everyone is working with the same data, which is why shared visibility becomes equally essential during the holiday rush.
Why Do Cross-Functional Teams Need One Clear View of Performance During Christmas?
During the holiday season, teams across marketing, sales, product, and operations collaborate to manage the increased demand. Each team depends on accurate and timely data to make decisions, but using different reports or tools can quickly lead to confusion and misalignment.
Business dashboards provide a unified view of data, presenting key metrics such as:
- Sales performance and revenue trends
- Marketing campaign results and channel performance
- Customer traffic and engagement metrics
- Inventory levels and fulfillment status
When all teams rely on a single dashboard, collaboration becomes smoother and decision-making becomes faster. A shared source of truth helps reduce back-and-forth discussions, ensures consistency in reporting, and keeps teams focused on achieving their Christmas goals.

Tracking the Right Seasonal KPIs During the Holiday Season
Performance during the holiday season varies significantly from that of regular business periods. Customer behavior becomes more time-sensitive, demand peaks within short windows, and campaign performance can shift quickly. To stay responsive, teams need visibility into seasonal KPIs that reflect Christmas-specific activity and buying patterns.
Dashboards help teams track key seasonal metrics such as:
- Engagement Rate: Measures how actively customers interact with Christmas campaigns across channels during peak periods.
- Conversion Rate: Tracks how effectively seasonal traffic turns into purchases, especially during limited-time offers and promotions.
- Average Order Value (AOV): Highlights changes in basket size driven by gifting behavior and holiday bundles.
- Sales Velocity: Monitors how quickly products sell during high-demand Christmas windows.
- Inventory Availability: Shows real-time stock levels to prevent stockouts during peak shopping days.
- Traffic Growth Rate: Captures spikes in website or store visits as Christmas campaigns go live.
By keeping these seasonal KPIs visible in a single dashboard, teams can identify trends early and make informed adjustments in a timely manner. This structured view of Christmas metrics supports faster decisions and more confident performance management throughout the holiday season.
5 Christmas Dashboard Template Examples to Get You Started
Getting dashboards ready during the Christmas season should not slow down your teams. With Mokkup.ai’s prebuilt Christmas dashboard templates, you can quickly create structured, visually clear dashboards without starting from scratch. These templates are designed to help teams focus on the right metrics while saving time during the holiday rush.
Below are three Christmas dashboard template examples available on Mokkup that you can easily customize to match your data, use case, and stakeholders.
1. Corporate Gifting Insights & Vendor Performance Dashboard Template:
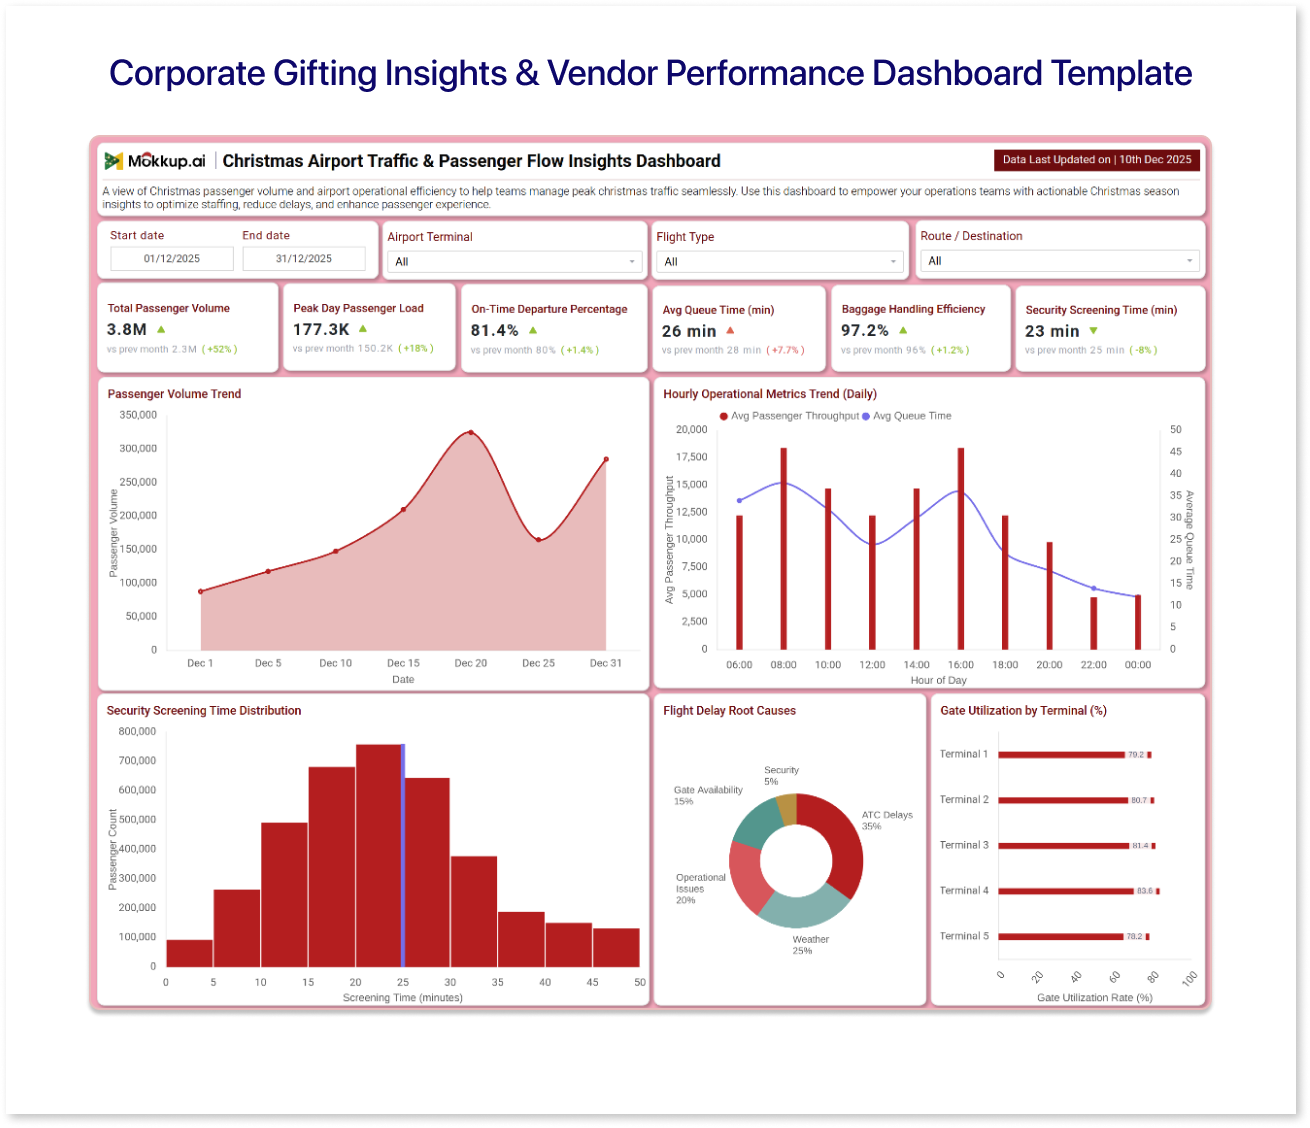
The Corporate Gifting Insights & Vendor Performance Dashboard template is designed to give teams a clear and organized view of vendor performance in one place. It helps track key operational metrics and compare vendors easily, making it more straightforward to monitor progress and identify areas for improvement.
This dashboard wireframe can be quickly customized to fit different business needs and is well-suited for planning, reviews, and stakeholder discussions.
2. Christmas Retail Performance Command Center Dashboard:
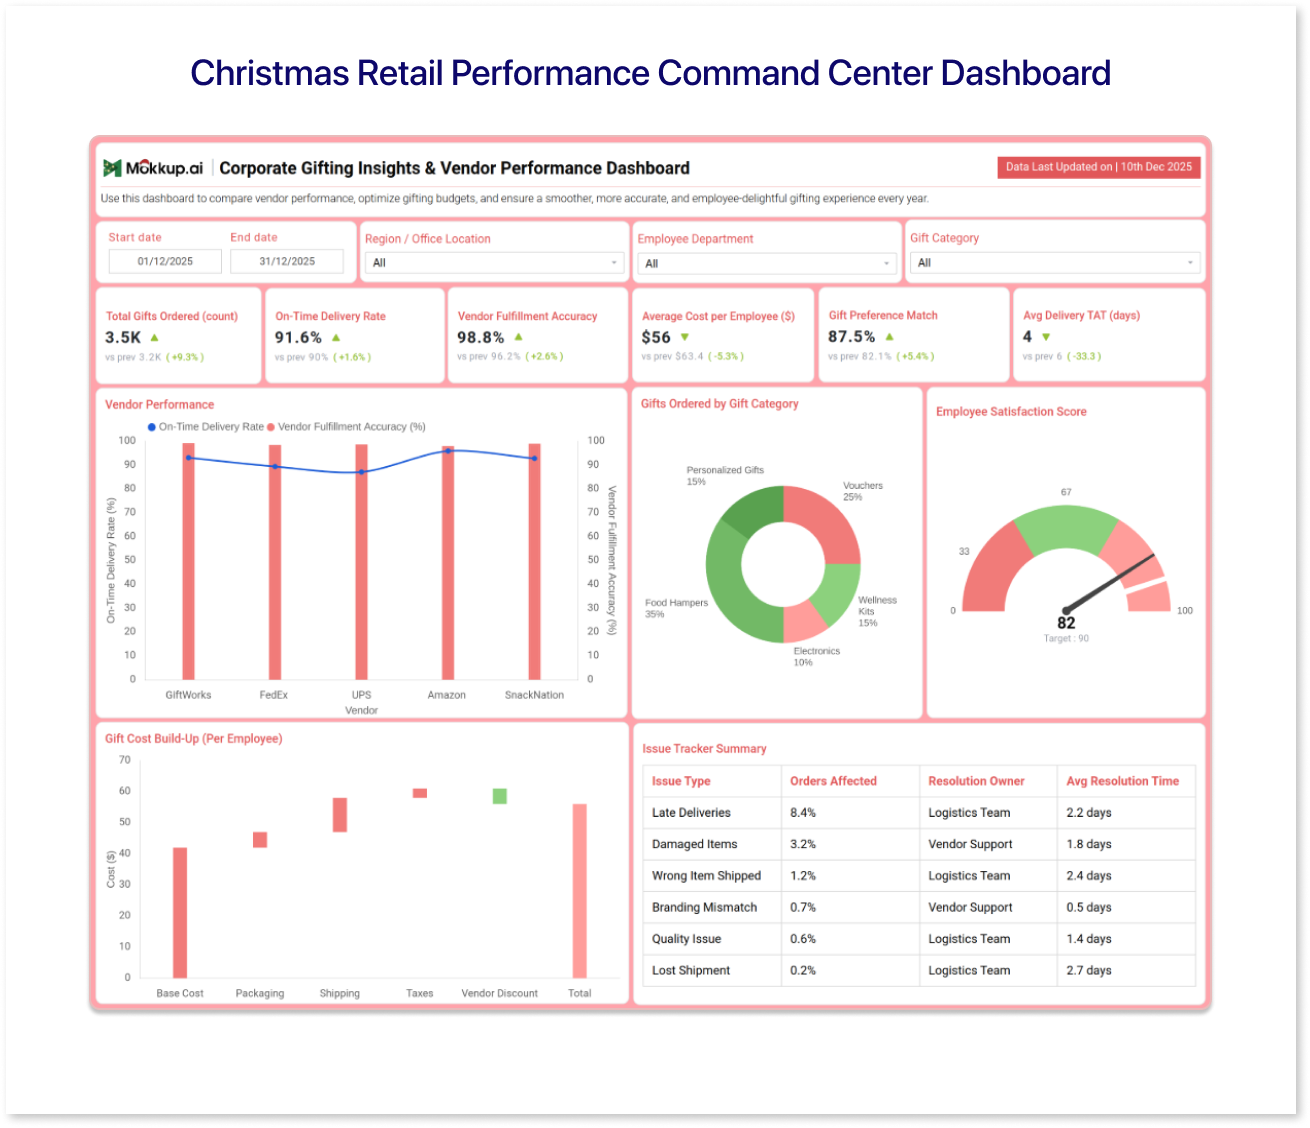
The Christmas Retail Performance Command Center Dashboard template is designed to give teams a centralized view of retail performance during the holiday season. It brings together key metrics such as sales trends, customer activity, and inventory status to help teams monitor performance at a glance.
This dashboard wireframe facilitates quick decision-making during peak periods by enabling easier tracking of what is working, identifying issues early, and maintaining control over retail operations throughout the Christmas season.
3. Christmas Social Media Campaign Impact Dashboard Template:
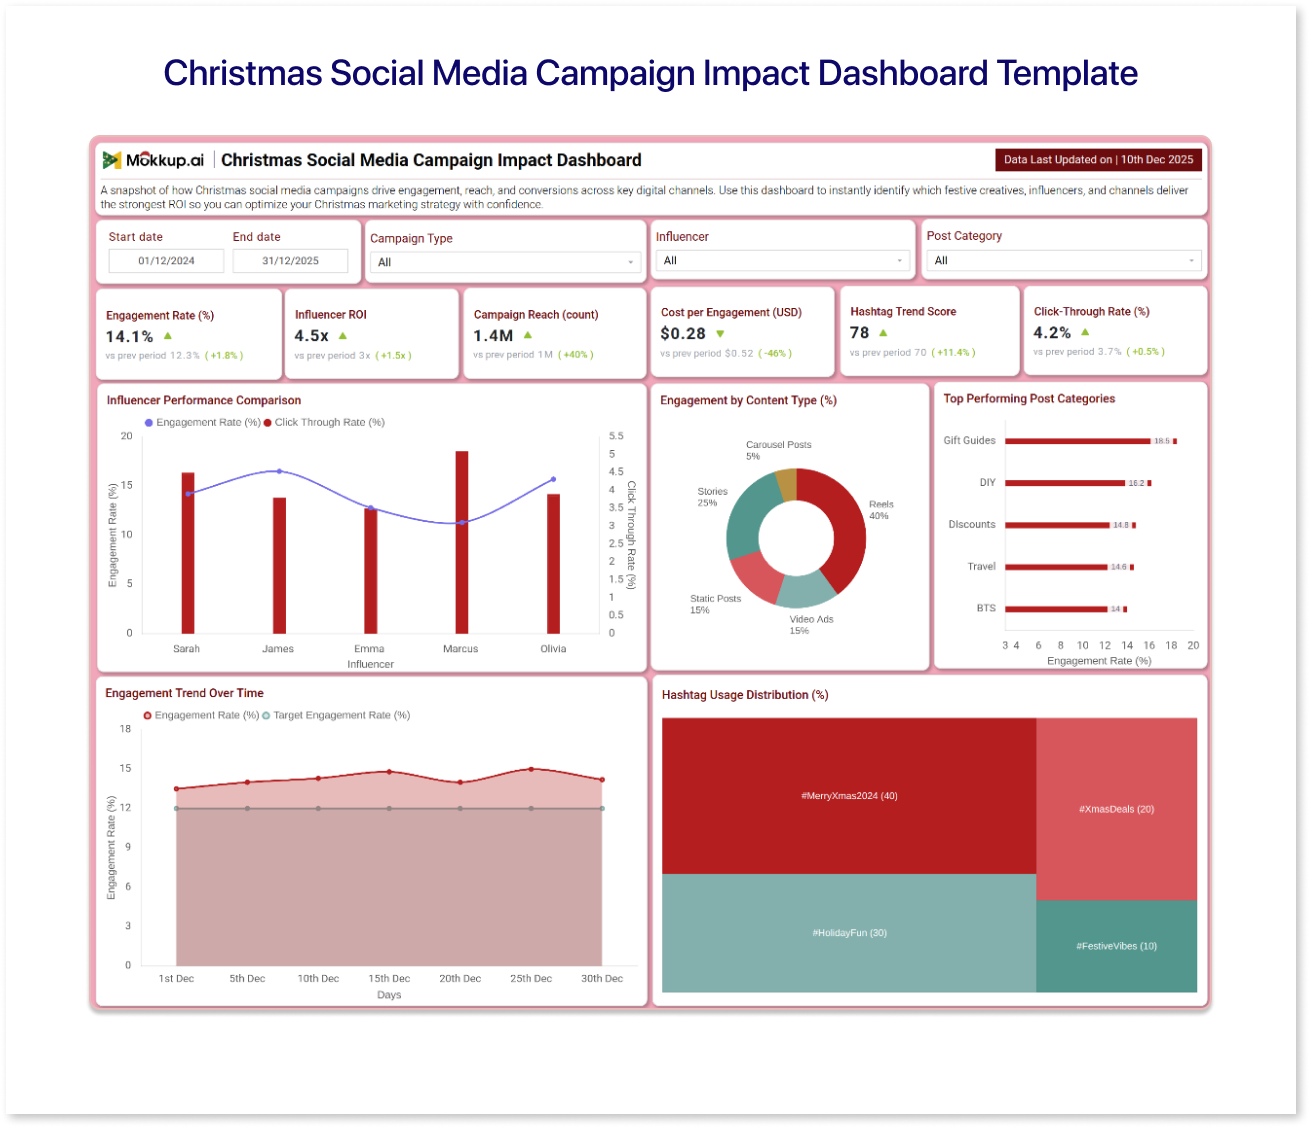
The Christmas Social Media Campaign Impact Dashboard template enables teams to track and analyze the performance of holiday social media campaigns in one centralized location. It brings together key engagement and reach metrics, making it easier to understand how Christmas campaigns are performing across platforms.
This dashboard wireframe is helpful for monitoring campaign impact, identifying high-performing content, and making timely adjustments during the fast-paced Christmas marketing period.
4. North Pole Christmas Manufacturing Output Dashboard:
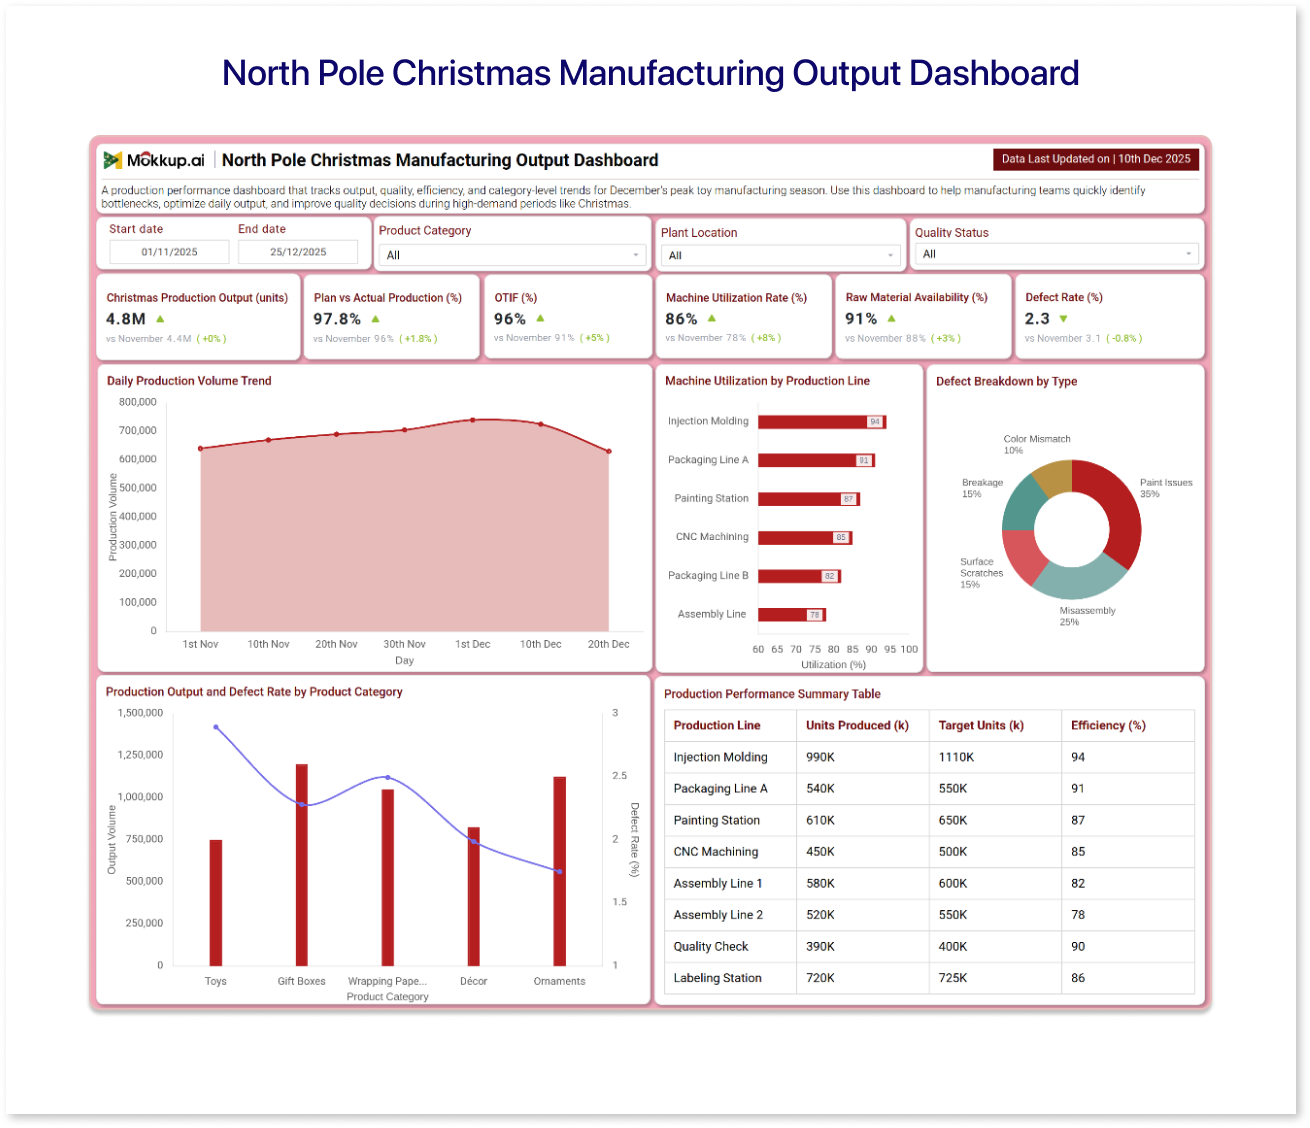
The North Pole Christmas Manufacturing Output Dashboard template is designed to track production performance during the Christmas season. It provides visibility into output levels, efficiency, and operational progress, helping teams monitor manufacturing activity at a glance.
The dashboard wireframe facilitates better planning and oversight by enabling easier identification of production trends, early detection of bottlenecks, and maintaining manufacturing operations on track during peak holiday demand.
5. Christmas Airport Traffic & Passenger Flow Insights Dashboard
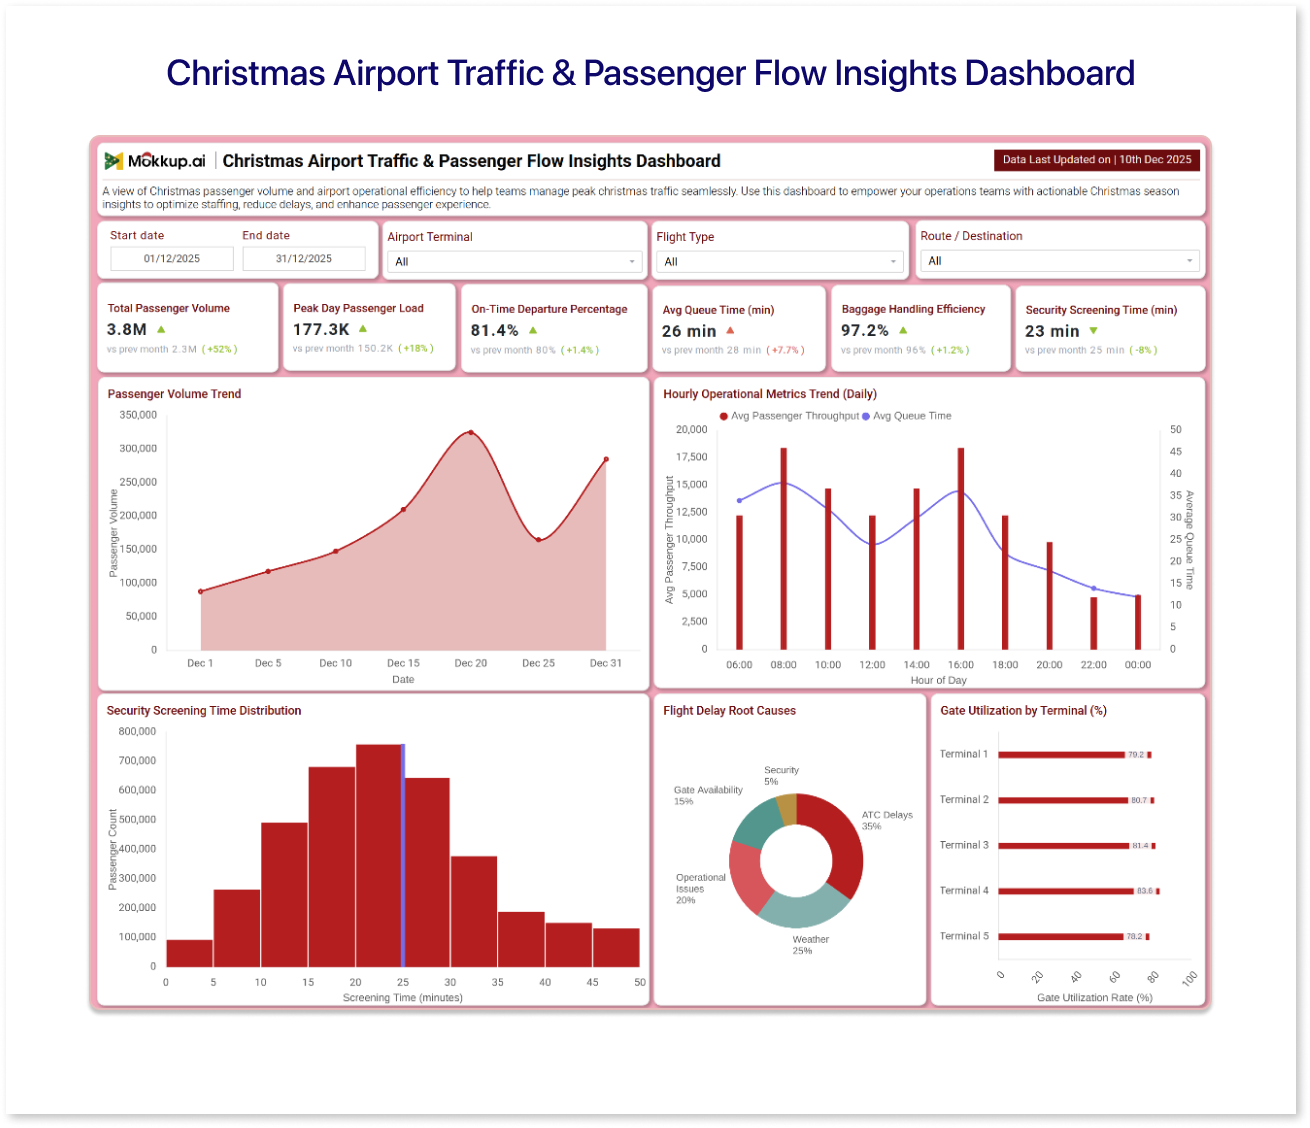
The Christmas Airport Traffic & Passenger Flow Insights Dashboard template provides a comprehensive view of passenger activity and traffic patterns during the holiday travel season. It brings together key metrics, such as arrivals, departures, congestion points, and flow trends, to help teams effectively monitor airport operations.
It is helpful for planning, resource allocation, and improving passenger experience by making it easier to spot trends and address issues during the busiest travel period of the year.
Together, these Christmas dashboard templates on Mokkup help teams visualize seasonal performance more quickly and effectively. By starting with ready-made layouts, teams can focus on insights and actions rather than spending time on dashboard design during the holiday rush.
Why Ready-Made Dashboard Templates Save Valuable Time During Christmas
The Christmas season moves quickly, leaving little room for long design or iteration cycles. Teams are often required to respond to changing data, align with stakeholders, and deliver insights on tight timelines. Designing dashboards from scratch during this period can slow progress and create unnecessary friction.
Ready-made dashboard templates help teams get started immediately with structured layouts and clearly defined sections. Instead of focusing on design decisions, teams can spend their time customizing metrics, reviewing insights, and taking action. This approach helps maintain speed and consistency, even when workloads are at their highest.
By using pre-built templates during the Christmas season, teams can reduce effort, avoid delays, and maintain their focus on delivering results when it matters most.
Conclusion
The Christmas season demands faster decisions, better coordination, and clear visibility into performance. With increased activity across channels and tighter timelines, having structured dashboards in place helps teams stay focused and respond with confidence.
Tools like Mokkup support this by making it easier to plan, visualize, and communicate key metrics during the holiday rush. With the availability of holiday dashboard templates, teams can get started quickly and adapt dashboards to their needs without unnecessary complexity.
As the festive season approaches, the right dashboards can make all the difference in staying organized, aligned, and ready for what comes next.
Frequently Asked Questions
Christmas dashboard templates are pre-designed dashboard layouts created to track seasonal metrics such as sales performance, campaign impact, customer activity, and operational readiness during the holiday period.
Christmas dashboards are useful for teams across marketing, sales, operations, and leadership who need clear visibility into performance and faster decision-making during the busy holiday season.
Yes. Most Christmas dashboard templates are designed to be flexible, allowing teams to customize metrics, layouts, and visuals based on their specific data sources and business goals.
Prompt it. Wireframe it with Mokkup.ai.
