
What is a North Pole Christmas Manufacturing Output Dashboard?
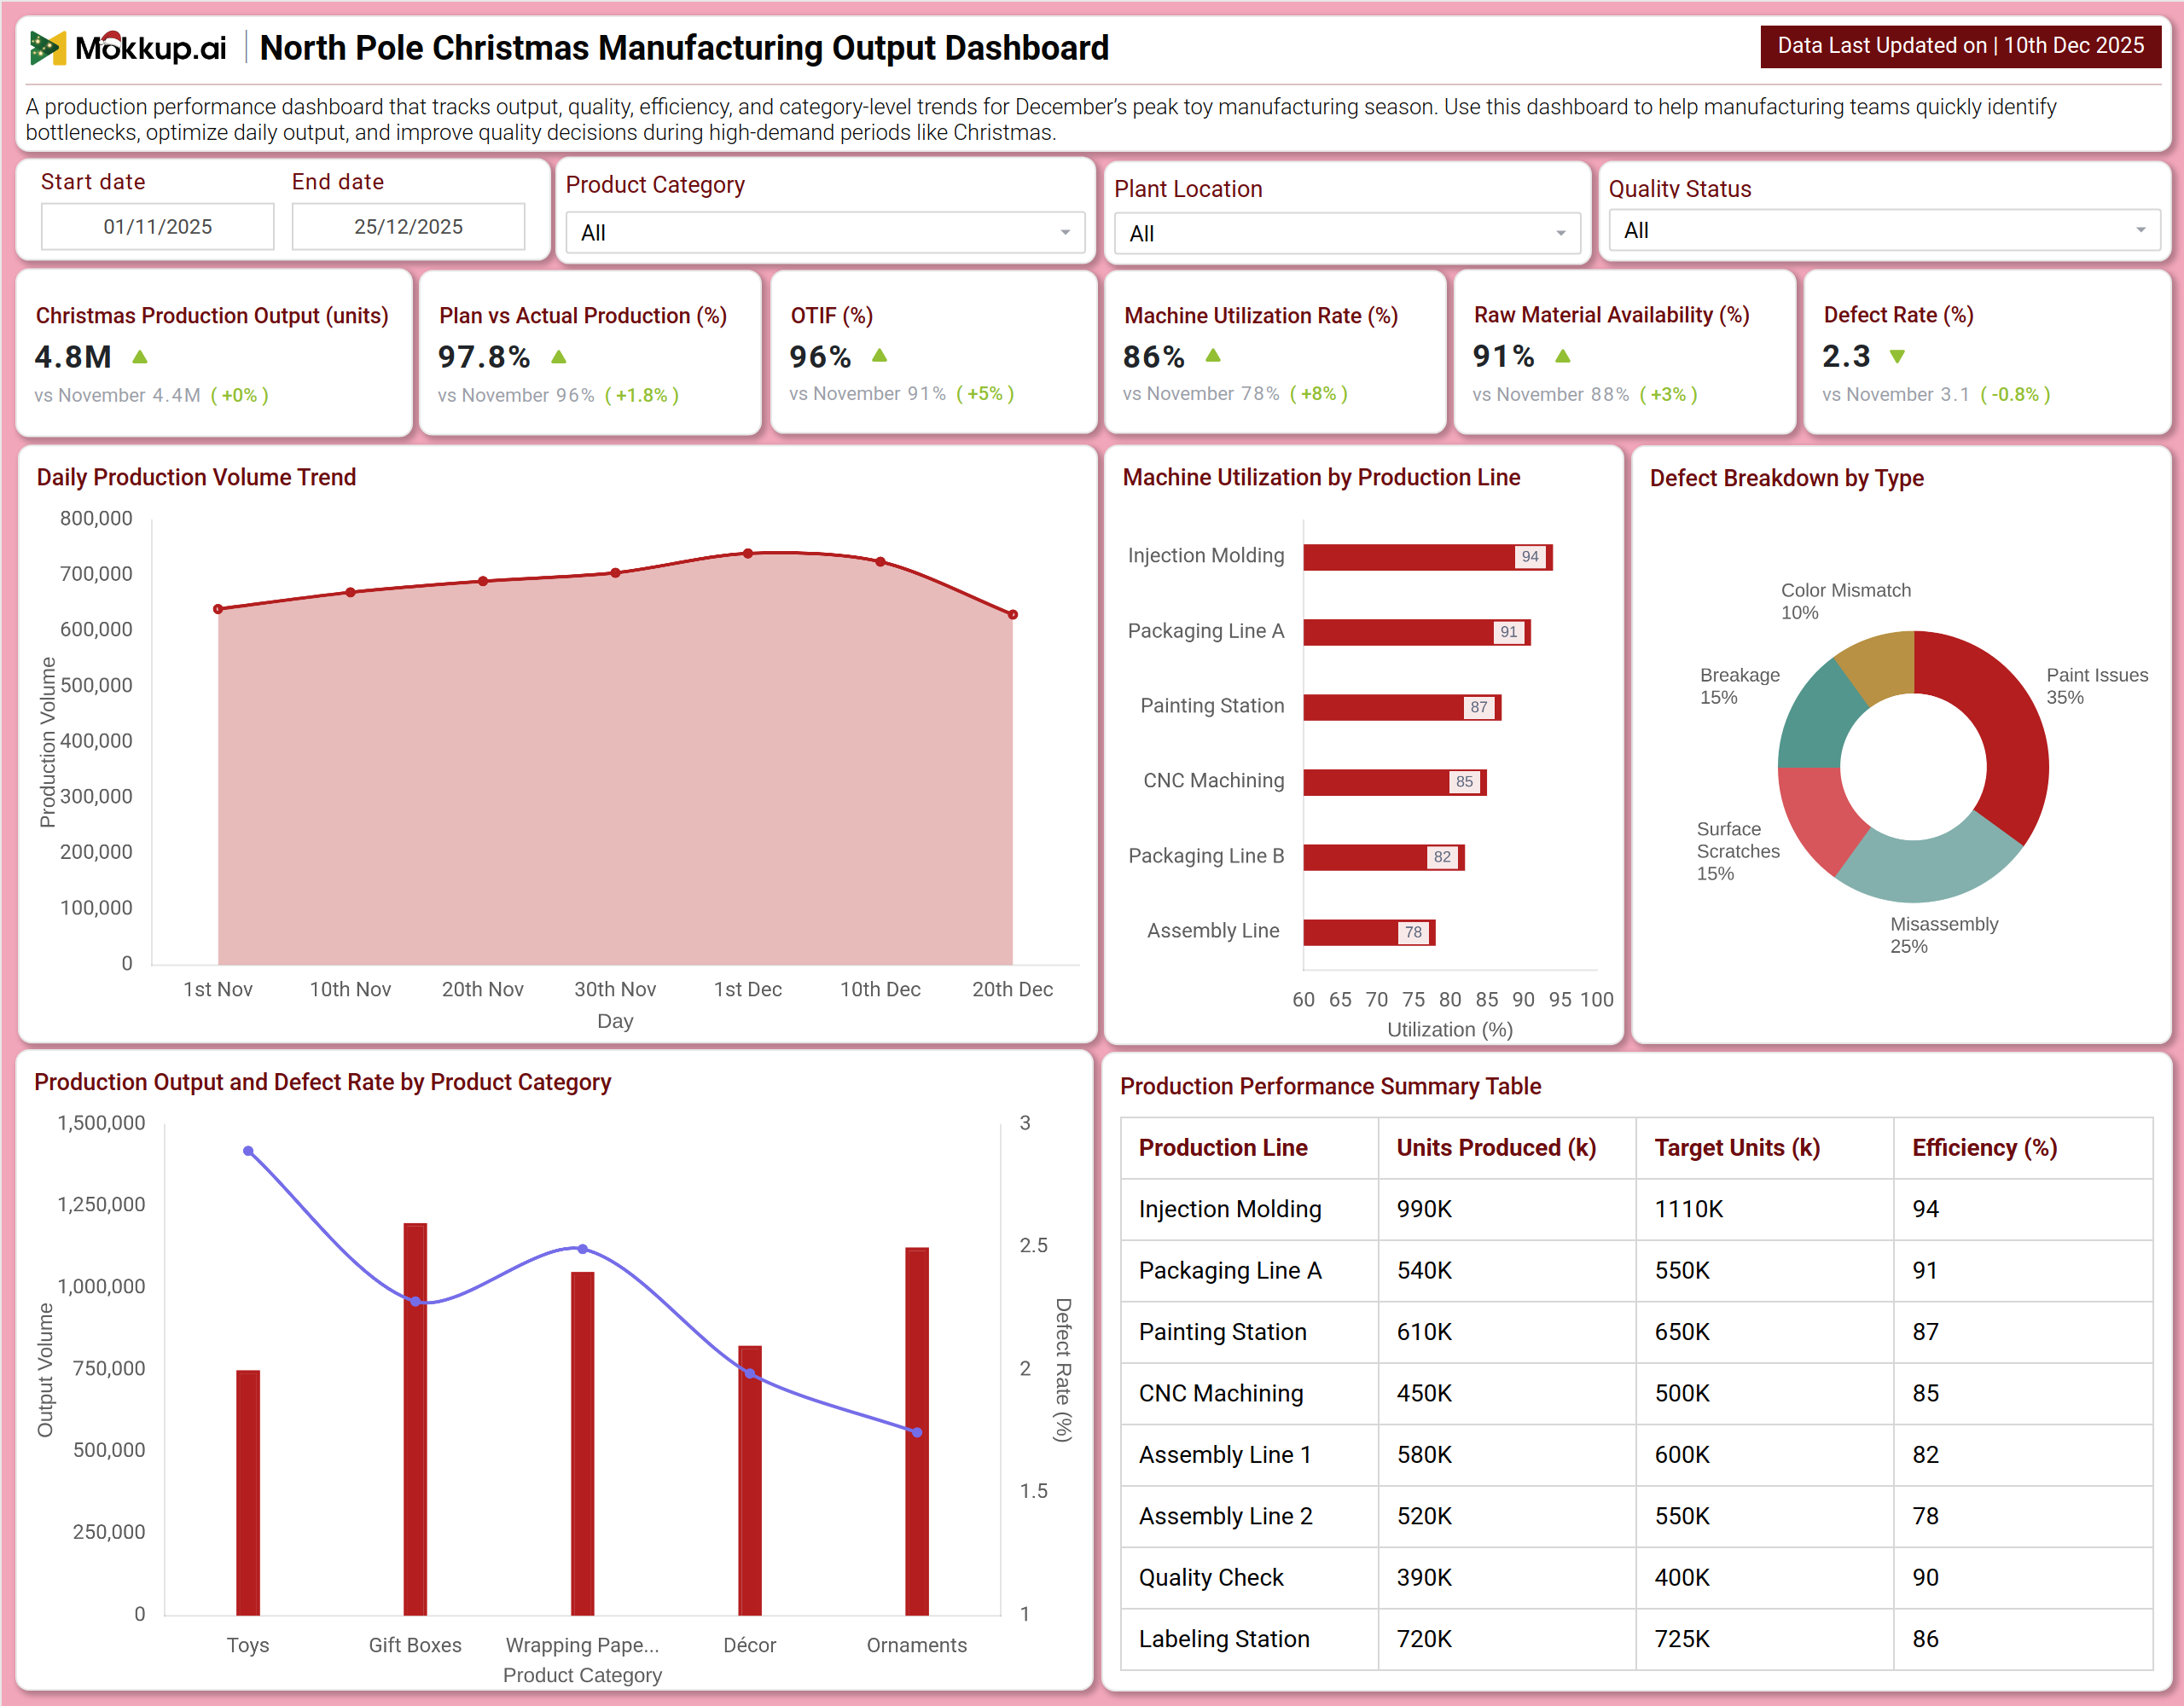
A North Pole Christmas Manufacturing Output Dashboard is an operational intelligence tool designed to monitor and optimize production performance during the peak holiday manufacturing season. It consolidates key metrics such as total output, on-time fulfillment (OTF), machine utilization, and defect rates into a single visual platform. By integrating Christmas production efficiency tracking, holiday manufacturing quality control, and festive season output analytics, the dashboard enables manufacturing teams to identify bottlenecks, ensure raw material availability, and maintain high-quality standards during periods of high demand. The dashboard acts as a central command center for tracking daily production trends, analyzing line efficiency, and pinpointing defect causes to meet critical Christmas deadlines.
How to Create a North Pole Christmas Manufacturing Output Dashboard
You don’t need to build your report from scratch—just start with a ready-to-use dashboard template from Mokkup. Add in your data and export it however you like. Here’s how to do it:
1. Create or Log in to Your Mokkup Account
Start by signing up on Mokkup.ai using your email. If you already have an account, just log in, and you’ll be good to go.
2. Choose and Customize Your Dashboard Template
Find the North Pole Christmas Manufacturing Output Dashboard template in the Templates section. Use the drag-and-drop editor to adjust KPIs, edit filters, or add elements based on your data.
3. Export to Your BI Tool
Once your dashboard wireframe is ready, use the BI Tool Export feature to send it directly to Power BI or Tableau for further analysis and enhancements. You can also download the dashboard as a PDF, PNG, or JPEG, embed it on a platform, or invite your team to collaborate.
Note: This is a Pro template. You’ll need a Pro subscription on Mokkup to use and customize this dashboard wireframe. Upgrade anytime to unlock full access.
North Pole Christmas Manufacturing Output Dashboard Example
You can create a North Pole Christmas Manufacturing Output Dashboard that brings together volume, efficiency, and quality metrics into a unified view. A typical dashboard includes a Production Overview section, where users can track Christmas Production Output, plan vs. actual adherence, and On-Time Fulfillment (OTF). Visual charts, such as the Daily Production Volume Trend and Machine Utilization by Production Line, reveal throughput patterns and resource allocation. The Efficiency & Quality Analysis section builds on this by displaying a Defect Breakdown by Type, a combined view of Production Output and Defect Rate by Product Category, and a detailed Production Performance Summary Table. Together, these modules provide crucial operational visibility during the festive season, enabling supervisors to strike a balance between speed and quality and keep every production line running at peak efficiency.
How to Analyze Data in the North Pole Christmas Manufacturing Output Dashboard
Here is how you can analyze data from this dashboard:
- Monitor Christmas Production Output: Measure the total number of units manufactured and compare them against seasonal production targets to understand overall performance.
- Track Plan vs. Actual Production: Assess how closely daily production aligns with scheduled plans to identify delays, inefficiencies, or overperformance.
- Analyze On-Time Fulfillment (OTF): Review the percentage of manufacturing orders completed by their scheduled finish dates to gauge timeliness and delivery reliability.
- Review Machine Utilization Rate: Ensure production machines are used efficiently without overloading, thereby helping to maintain balanced workloads.
- Measure Raw Material Availability: Identify potential supply shortages early to prevent production delays or stoppages during peak seasons.
- Observe Defect Rate: Monitor overall product quality to determine the effectiveness of quality control processes.
- Study Daily Production Volume Trend: Find patterns, peak days, and slowdowns in manufacturing output to anticipate capacity needs.
- Examine Machine Utilization by Line: Spot underperforming or over-utilized production lines that may require maintenance, balancing, or optimization.
- Investigate Defect Breakdown by Type: Understand the root causes of quality issues, such as misassembly or breakage, to implement corrective actions.
- Evaluate Production Performance Summary: Compare each production line’s efficiency and output against individual targets to identify strengths and areas for improvement.
Benefits of Nthe orth Pole Christmas Manufacturing Output Dashboard
The following are the benefits of using this dashboard:
- Centralized visibility into critical manufacturing metrics: Gain a complete view of production health during the holiday season’s most demanding period.
- Effective Christmas production efficiency tracking: Maximize manufacturing output while staying aligned with tight seasonal deadlines.
- Better decision-making through quality insights: Utilize precise analytics to minimize defects and enhance overall product quality.
- Enhanced festive-season capacity planning: Make informed decisions on resource allocation and workforce management with accurate seasonal output analytics.
- Increased operational throughput: Identify production bottlenecks in real time and resolve them quickly to maintain smooth operations.
- Stronger peak-season KPI performance: Monitor volume, timeliness, efficiency, and quality in one integrated dashboard for better control.
- Reduced manual reporting efforts: Automate tracking of plant-floor performance data to save time and increase accuracy.
- Improved resource optimization: Track machine utilization and raw material availability to prevent downtime and maintain continuous production.
KPIs to Track in North Pole Christmas Manufacturing Output Dashboard
Here are some of the peak season manufacturing KPIs that can be tracked by using this dashboard:
- Christmas Production Output (units): The total number of finished goods produced during the holiday manufacturing period.
- Plan vs Actual Production (%): The percentage ratio of actual units produced compared to the planned production schedule.
- On-Time Fulfillment - OTF (%): The percentage of production orders completed and ready for shipment by their due date.
- Machine Utilization Rate (%): The percentage of available machine time that is actively used for production.
- Raw Material Availability (%): The percentage of time required for raw materials to be in stock and available for production use.
- Defect Rate (%): The percentage of manufactured units that fail to meet quality standards.
- Production Line Efficiency (%): The ratio of actual output to standard output for a specific production line or station.
- Daily Output Target Attainment: The measure of whether daily production goals were met, exceeded, or missed.
Frequently Asked Questions
1. What is the purpose of this manufacturing dashboard?
It helps production managers, plant supervisors, and operations directors monitor and optimize the entire manufacturing process to ensure maximum output, efficiency, and quality during the peak Christmas production season.
2. Can the dashboard identify which machine is causing the slowdown in production?
Yes. The Machine Utilization by Production Line chart visually compares utilization rates, highlighting lines that are underperforming or at risk of overuse.
3. Does it show if we are on track to meet production goals?
Yes. The Plan vs Actual Production metric and the Daily Production Volume Trend clearly show performance against scheduled targets.
4. Who uses this dashboard?
Plant Managers, Production Supervisors, Operations Directors, Quality Assurance Managers, and Supply Chain Planners.