
Having satisfied and loyal customers is like creating a beautiful sculpture from a block of stone. Just as an artist carefully shapes the stone to make a masterpiece, a company puts in a lot of effort to make its customers happy. Each happy customer becomes a shining example of the company's hard work, adding to its success and making more people trust what it offers. That is what Customer Retention is, and it can completely transform the game for your business.
The key ingredient that converts one-time customers into devoted customers is all about customer retention. It's essential to building lasting bonds with your customers and, as a result, guaranteeing the long-term success of your company. But how do you quantify this intriguing metric and discover what keeps consumers coming back? Well, it's not rocket science; let's understand the process throughout.
The major part of Customer Retention is understanding the metrics. Analyzing and tracking the right numbers can give you valuable insights into your customer's behavior, preferences, and difficulties they might be going through. This information gives you the power to adjust your tactics, provide top-notch customer service, and encourage repeat business.
Table of Content
- What is Customer Retention Dashboard wireframe?
- What are the main types of Customer Retention Metrics?
- Key Performance Indicators for SaaS Business
- How Can Mokkup Benefit you with its SaaS Customer Retention Dashboard?
What is Customer Retention Dashboard Wireframe?
A customer retention dashboard wireframe is a graphic representation of the layout and structure of a comprehensive tool used to measure and monitor important customer-centric data, with a particular focus on customer retention. This wireframe provides the basics for developing a robust and user-friendly dashboard that offers in-the-moment information about the state of a business and its prospects for development.
Customer-centricity has emerged as a key concern for businesses across a range of industries. It is an important factor that shouldn't be overlooked, whether the business is a B2B SaaS firm or a B2C online store. This dashboard wireframe acts as a strategic roadmap, helping to assess and improve customer retention efforts, ultimately saving time and money.
The Dashboard wireframe includes:
- Retention rate
- Churn rates
- Monthly recurring revenue (MRR) growth
- Net retention
- Customer loyalty metrics
- Account health
A net retention rate of 100% or above is the target for a well-organized customer retention dashboard wireframe, signifying customer satisfaction and long-term success. In order to reduce churn and promote long-lasting customer connections, it acts as a collaborative tool, encouraging teams to work together to achieve successful techniques like customer onboarding and training.
What are the main types of Customer Retention Metrics?
Understanding how to assess customer retention is important for keeping consumers satisfied and customer acquisition. In order to assess the state of a company's customer relationship, three primary categories of customer retention indicators must be considered. Let's explore these metrics in simple terms:
Churn Rate: Consider your customers to be guests and the churn rate to be the individuals who depart the party early. The number of consumers that quit the gathering, or in this example, the company, each month is measured by the churn rate.

It's similar to keeping track of visitors who say goodbye and leave the room. In order to keep customers satisfied while motivating them to stick around longer, something may need to be addressed if the turnover rate is high.
Customer Lifetime Value (CLV): Customer Lifetime Value can be compared to a friendship that develops over time. It's similar to being aware of how much a friend spends when you get out with them over time.
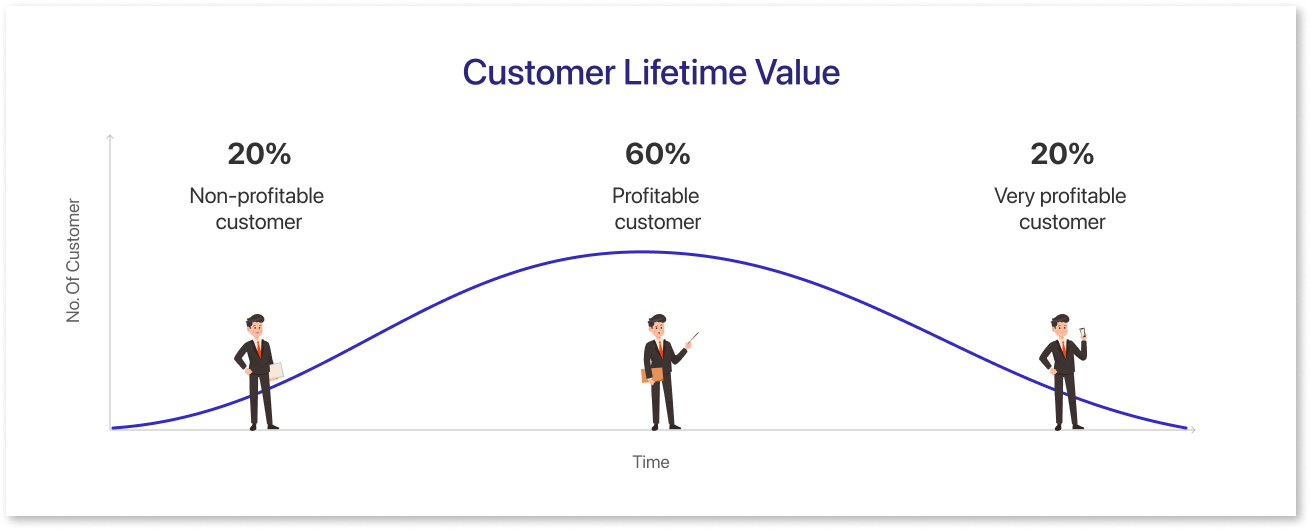
The total amount spent by a consumer over the course of their whole association with the company is measured as customer lifetime value. Businesses can utilize this statistic to determine how important their consumers are and how much they ultimately contribute to their long-term success.
Customer Engagement: Customer engagement is like keeping track of how frequently a friend calls or visits your home. In terms of business, it all comes down to examining how frequently customers utilize the company's goods or services.
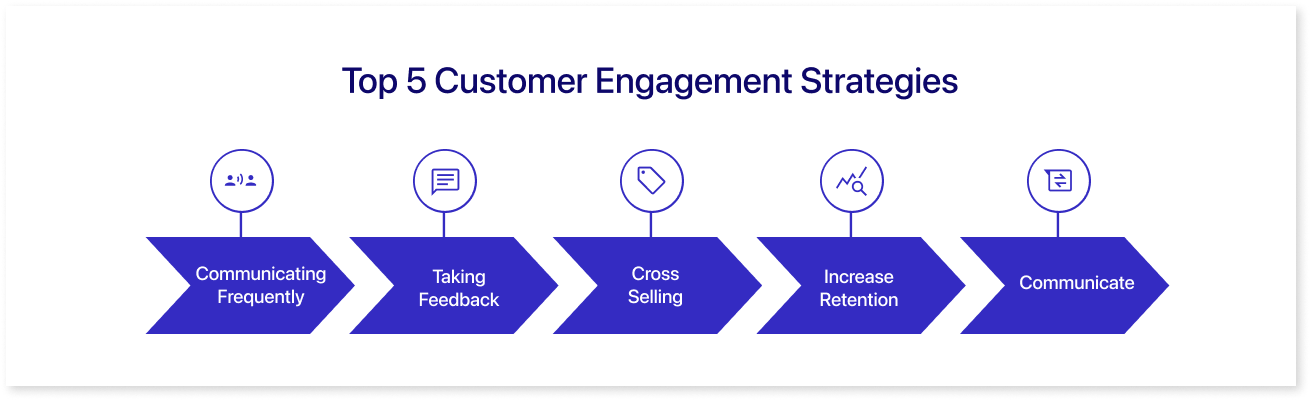
Businesses like seeing consumers actively utilize their goods or services, just like you enjoy hearing from your friends. High customer involvement often indicates that clients are content with the service they are receiving.
Key Performance Indicators for SaaS Business
Being at the top of your game in comparison to your rivals is essential, and customer retention kpi, or key performance indicators, may hold the secret to success. How? Well, these important KPIs serve as a compass for SaaS organizations, pointing them in the direction of success and development.
Let's dive deeper into the relevance of the three kpi for customer retention that any SaaS firm has to pay heed to:
Net Customer Retention Rate: Imagine playing your favorite game and wanting to keep everyone interested and coming back for more amusement? How many customers continue to be devoted to and interested in your service over time is exactly what your net customer retention rate indicates. It's similar to keeping track of how many players remain around and engaged.
The good news for your company is that a high net customer retention rate means that customers value your service and are likely to continue using it.
Formula: Net Customer Retention Rate = ((CE - CN) / CS) * 100
Where:
- CE = Number of Customers at the End of the Period
- CN = Number of New Customers Acquired During the Period
- CS = Number of Customers at the Start of the Period
Multiply the result by 100 to express the Net Customer Retention Rate as a percentage.
Monthly Recurring Revenue (MRR) Growth Rate: Imagine a vault filled with gold and money that gets bigger every month. The MRR growth rate quantifies the pace of expansion of your revenue stream. It's comparable to keeping tabs on how much cash enters your company each month.
A good MRR growth rate indicates that more money is coming in, which will provide your company with the financial stability it needs to operate successfully.
Formula: MRR Growth Rate = ((EMRR - SMRR) / SMRR) * 100
Where:
- EMRR = Ending Monthly Recurring Revenue
- SMRR = Starting Monthly Recurring Revenue
Multiply the result by 100 to express the MRR Growth Rate as a percentage.
Net Promoter Score: Metrics for customer loyalty track the number of customers quitting your service each month. Businesses seek to lower customer loyalty numbers in order to retain valued consumers, much like you'd like to keep players interested in your game.
A low rate indicates that fewer customers are departing, which is excellent news for your SaaS company's long-term growth.
Formula: NPS = (% Promoters) - (% Detractors)
Where:
- % Promoters = Percentage of respondents who are Promoters (Scoring 9-10)
- % Detractors = Percentage of respondents who are Detractors (Scoring 0-6)
NPS is a measure of customer loyalty and satisfaction, ranging from -100 to +100. The higher the NPS, the more positive the sentiment among customers.
To learn more about the KPIs for SaaS Business, click here.
How can Mokkup benefit you with its SaaS Customer Retention Dashboard?
As important as acquiring new clients is customer retention. Just like you must tend to your garden to keep it flourishing, businesses must place a high priority on satisfying current customers. They can arrange and guarantee your happiness with the aid of a dashboard, creating enduring relationships. Here are a few distinguishing features that set Mokkup's Customer Retention Dashboard apart from the competition.
Key Points:
- 80% of a company's profits come from existing customers, not new ones.
- The dashboard helps companies provide support, tailored emails, and enticing upgrades.
- "Retention" is about how many customers stay, like friends who keep in touch.
- "MRR" is the money a company expects monthly.
- Companies must focus on existing customers to avoid losing them and spending more on new ones.
- By understanding why some customers leave, companies can improve and avoid similar mistakes.
- Keeping customers' content ensures steady growth and revenue.
It's equally important to keep customers as it is to bring in new ones. Companies should prioritize customer retention since their income streams follow the Pareto Rule of Vilfredo Pareto (an Italian economist), which states that 20% of current customers will generate 80% of future revenues.
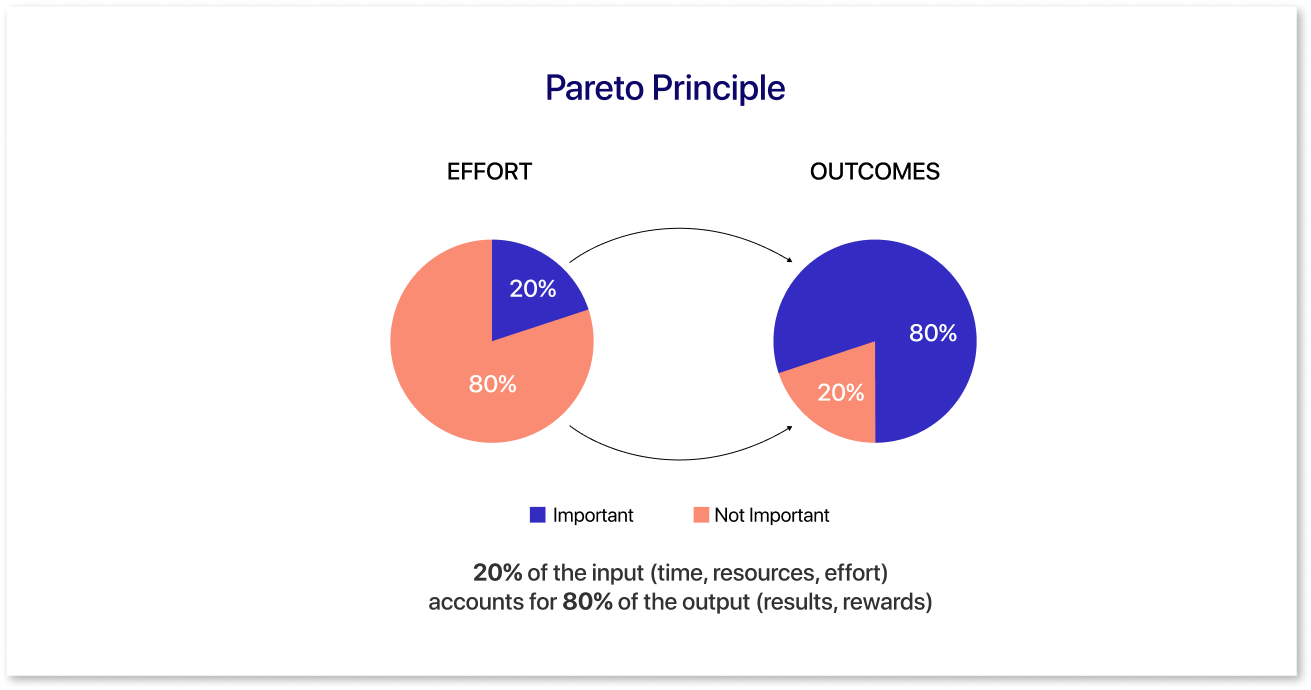
Any company, no matter how big or small, can set up reliable frameworks to look after and serve current customers using this dashboard wireframe. Long-lasting connections can be developed through programs like customer service, tailored email marketing, and promoting plan upgrades.
Therefore, in order to succeed in the churn and retention cycles, it is important to give existing customer retention priority over gaining new customers. As you add more customers, you run the risk of losing money if the retention strategy is improper.
The opposite of the churn rate is the customer retention rate. Given that acquiring new consumers might cost up to seven times as much as keeping existing ones, it only works with current customers. Developing effective customer loyalty strategies may benefit from comparing turnover and retention rates. Upselling may be a successful customer retention technique and can be monitored for increased income from satisfied customers.
Lastly, in order to better develop customer-centric retention strategies, it can be useful to compare revenue across different customer categories. Regular involvement, frequent improvements, reward initiatives, etc., are some retention techniques. Also, finding canceled accounts while conducting exit surveys could tell a lot about what is wrong right now and what might be fixed in the future.
Final Thoughts
In conclusion, a customer retention dashboard is a very powerful tool that plays a pivotal role in effective customer retention management. It provides a complete customer retention analysis and insightful customer retention analytics. This eventually empowers businesses to keep customers satisfied and loyal.
- Data-driven decisions
- Identify growth opportunities
- Implement strategies
With the ability to track key metrics like churn rate, customer lifetime value, and customer engagement, businesses can forecast financial performance and take proper measures to improve their overall retention efforts.
Emphasizing the importance of customer retention, this dashboard wireframe serves as a vital resource for businesses across various industries, enabling them to build long-lasting bonds with their customers and achieve lasting success.
Prompt it. Wireframe it with Mokkup.ai.
