
What is a Christmas Social Media Campaign Impact Dashboard?
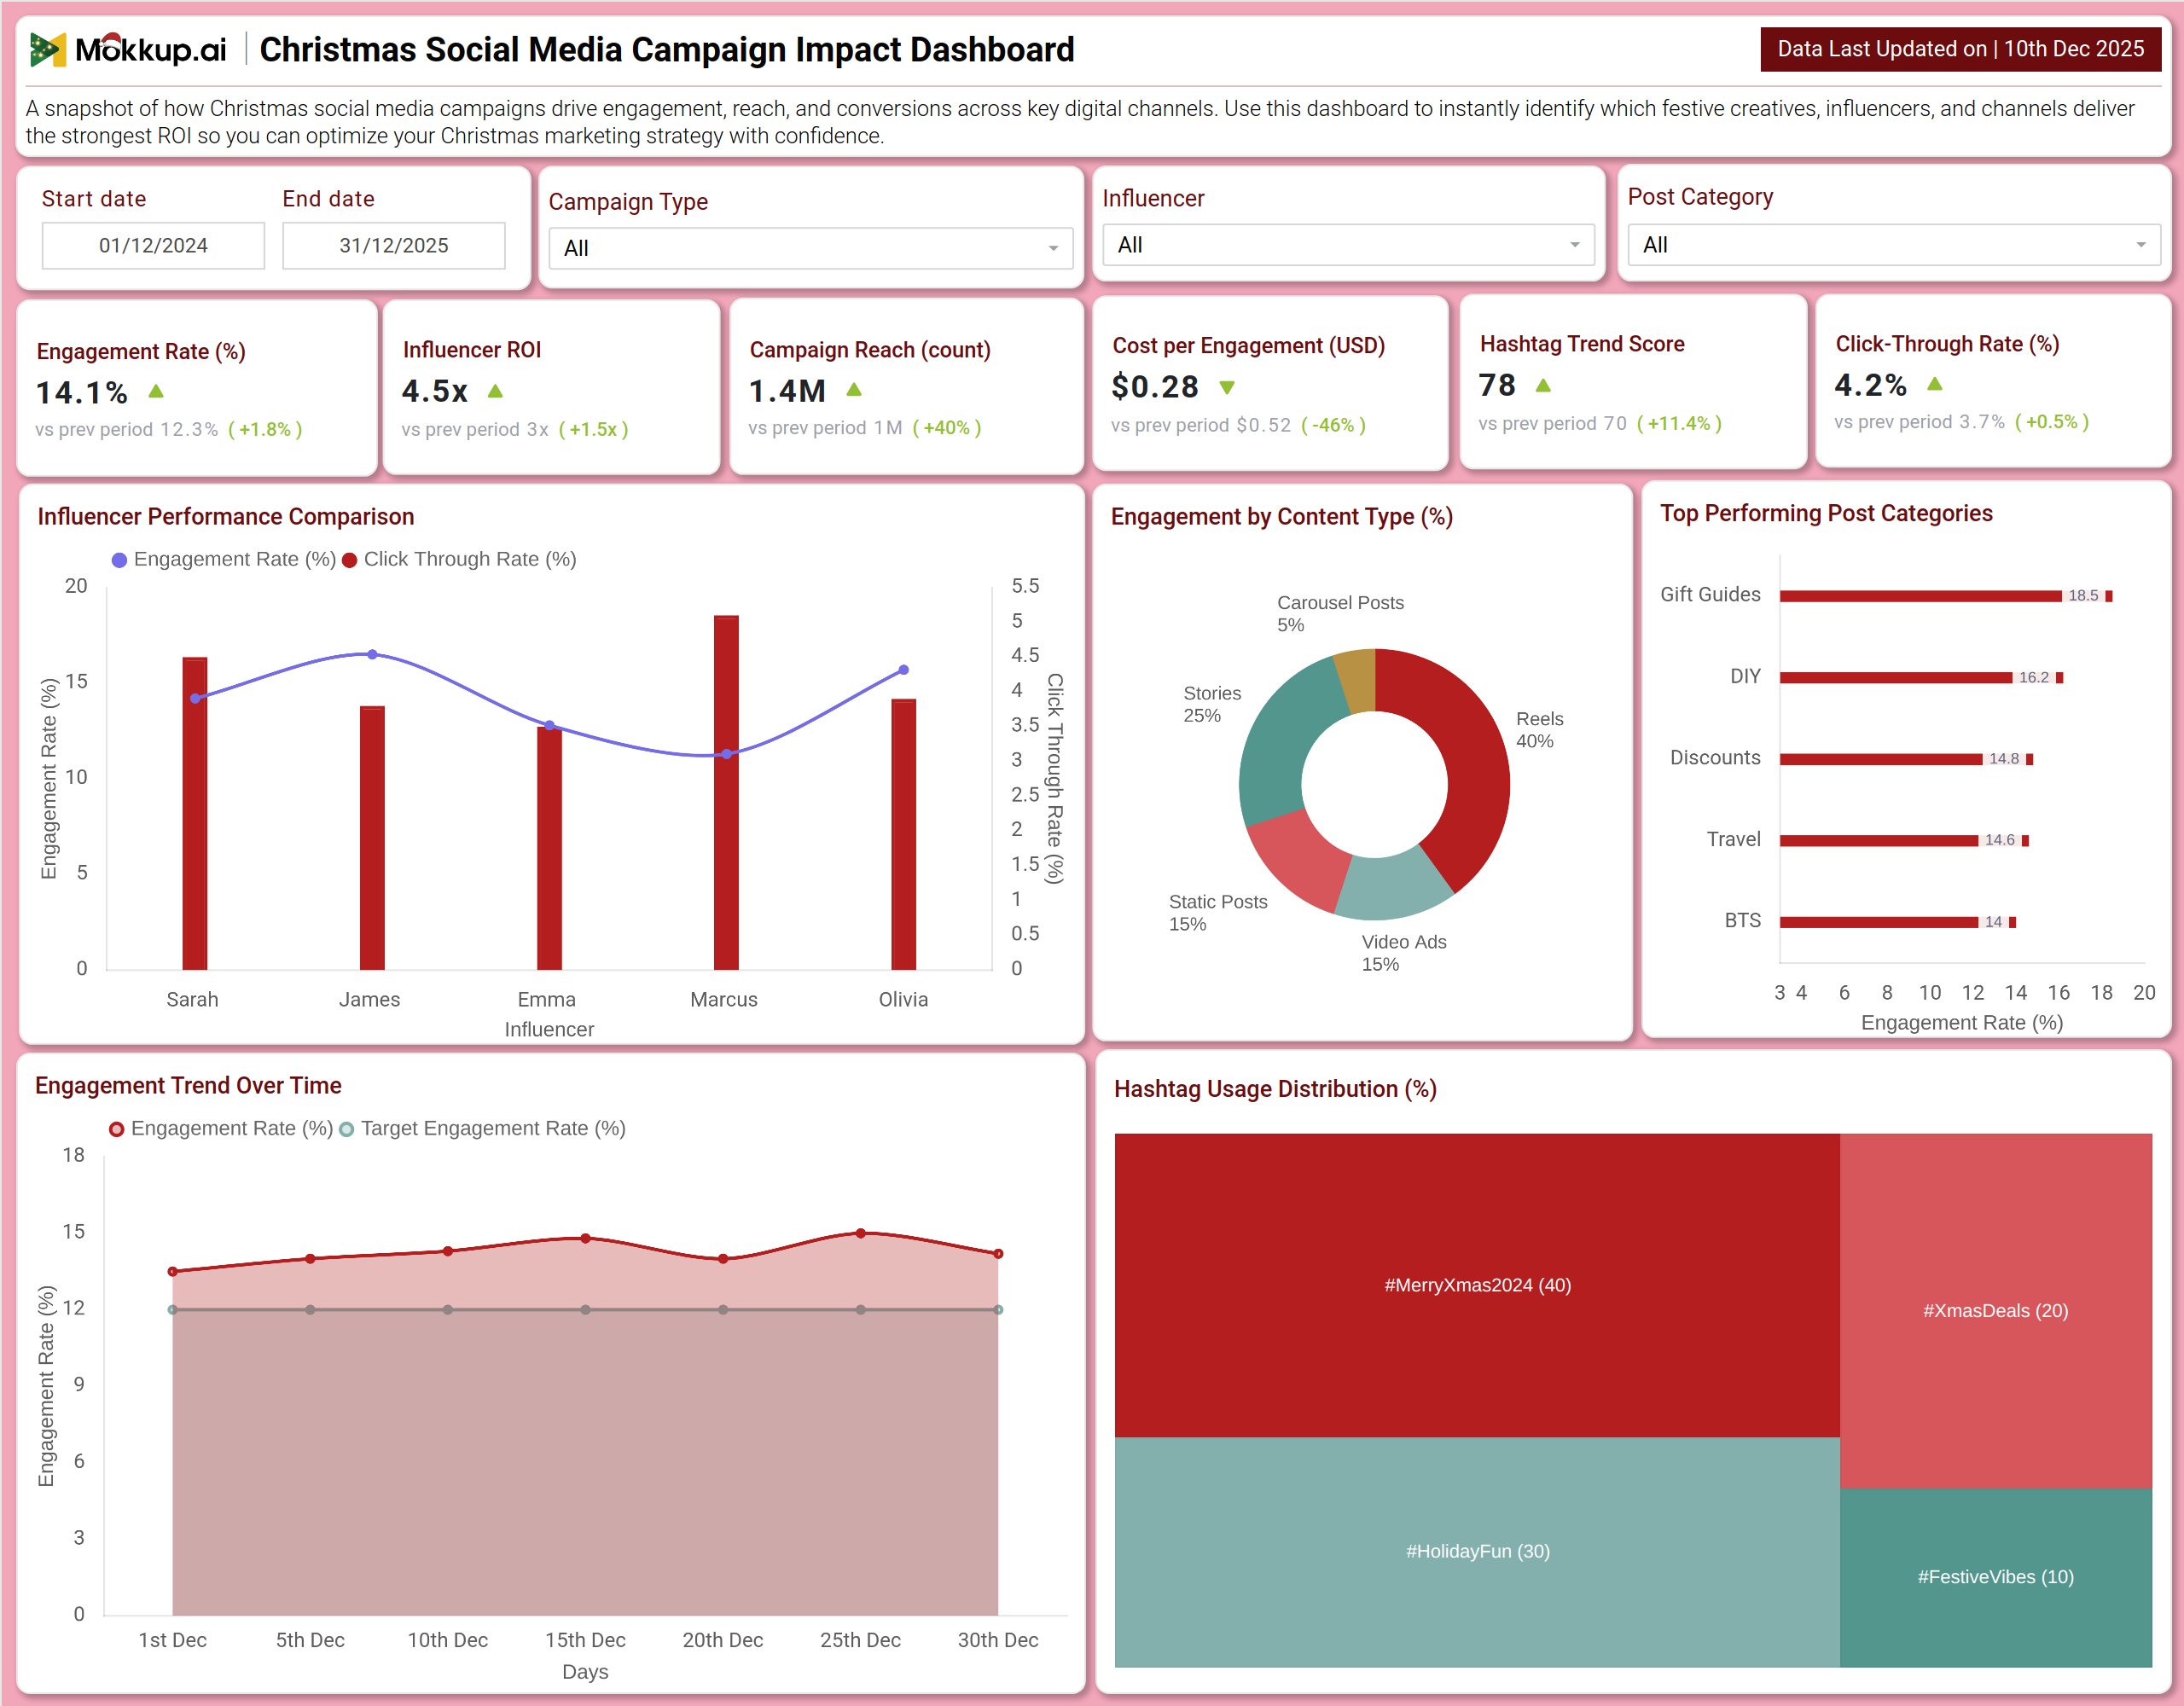
A Christmas Social Media Campaign Impact Dashboard is a specialized analytics tool designed to measure and optimize the performance of festive marketing campaigns across social platforms. It consolidates key metrics such as engagement rate, campaign reach, influencer ROI, and content effectiveness into a single visual platform. By integrating festive social media ROI measurement, holiday influencer campaign analytics, and Christmas content engagement tracking, the dashboard enables marketing teams to identify winning creatives, allocate budgets effectively, and maximize audience interaction. The dashboard acts as a central command center for comparing influencer performance, analyzing content trends, and tracking hashtag virality to refine holiday marketing strategies.
How to Create a Christmas Social Media Campaign Impact Dashboard
You don’t need to build your report from scratch—just start with a ready-to-use dashboard template from Mokkup. Add in your data and export it however you like. Here’s how to do it:
1. Create or Log in to Your Mokkup Account
Start by signing up on Mokkup.ai using your email. If you already have an account, just log in, and you’ll be good to go.
2. Choose and Customize Your Dashboard Template
Find the Christmas Social Media Campaign Impact Dashboard template in the Templates section. Use the drag-and-drop editor to adjust KPIs, edit filters, or add elements based on your data.
3. Export to Your BI Tool
Once your dashboard wireframe is ready, use the BI Tool Export feature to send it directly to Power BI or Tableau for further analysis and enhancements. You can also download the dashboard as a PDF, PNG, or JPEG, embed it on a platform, or invite your team to collaborate.
Note: This is a Pro template. You’ll need a Pro subscription on Mokkup to use and customize this dashboard wireframe. Upgrade anytime to unlock full access.
Christmas Social Media Campaign Impact Dashboard Example
You can create a Christmas Social Media Campaign Impact Dashboard that brings together campaign performance, content analysis, and influencer insights into a unified view. A typical dashboard includes a Performance Overview section, where users can track Campaign Reach, Engagement Rate, and Influencer ROI. Visual charts, such as Influencer Performance Comparison and Engagement Trends Over Time, reveal which partners and posting days drive the most interaction. The Content & Influencer Performance Analysis section builds on this by displaying Engagement by Content Type, Top Performing Post Categories, and Hashtag Usage Distribution. Together, these modules deliver crucial insights into festive campaign performance, enabling marketers to refine their high-performing content formats and optimize their holiday influencer partnerships.
How to Analyze Data in the Christmas Social Media Campaign Impact Dashboard
Here is how you can analyze data from this dashboard:
- Monitor Campaign Reach: Understand the total number of unique users exposed to your festive marketing messages to evaluate overall visibility.
- Track Engagement Rate: Measure how actively your audience interacts with your posts (likes, comments, shares) relative to the number of impressions or followers.
- Analyze Influencer ROI: Assess whether your influencer partnerships are delivering profitable results by comparing total returns against collaboration costs.
- Review Cost per Engagement (CPE): Determine the efficiency of your ad spend by calculating how much you pay for each meaningful interaction across platforms.
- Measure Sentiment Trends Score: Gauge your audience's sentiment about your Christmas campaign by analyzing positive, neutral, and negative reactions over time.
- Observe Click-Through Rate (CTR): Identify how effectively your social media posts are driving users to visit your website, landing pages, or product listings.
- Study Influencer Performance Comparison: Compare multiple influencers to see who brings the highest engagement, most substantial reach, and best ROI for your holiday content.
- Examine Engagement by Content Type: Find out whether videos, carousels, or static images resonate more with your audience and generate stronger engagement.
- Evaluate Top-Performing Post Categories: Identify which content themes, such as gift guides, DIY ideas, or festive discounts, drive the highest audience interest.
- Assess Hashtag Usage Distribution: Spot the most effective Christmas hashtags that help extend content reach and improve discoverability.
Benefits of Christmas Social Media Campaign Impact Dashboard
The following are the benefits of using this dashboard:
- Centralizes All Holiday Social Metrics: Provides a comprehensive, unified view of your campaign performance across platforms during the high-competition season.
- Supports Accurate ROI Measurement: Helps justify festive marketing investments by clearly showing where your budget delivers the best returns.
- Improves Influencer Partnership Decisions: Offers strong data-backed insights to help you choose creators who deliver the highest engagement and value.
- Enhances Christmas Content Engagement Tracking: Enables you to identify which creatives are successful, allowing you to replicate winning strategies throughout the season.
- Increases Campaign Efficiency: Enables quick optimization by reallocating spend to the most effective content types, channels, and influencer partners.
- Strengthens Festive Performance Insights: Offers a comprehensive view of reach, engagement, sentiment, and conversions in one place.
- Reduces Manual Reporting Effort: Automates and consolidates cross-channel social analytics, saving hours of manual compilation.
- Ensures Brand Sentiment Alignment: Helps you track audience perception in real time and adjust messaging to maintain a positive holiday brand image.
KPIs to Track in Christmas Social Media Campaign Impact Dashboard
The following key KPIs can be tracked by using this dashboard:
- Campaign Reach (count): The total number of unique users who have seen your campaign content.
- Engagement Rate (%): The percentage of people who interacted with your content out of the total who saw it.
- Influencer ROI (x): The ratio of revenue generated from influencer campaigns to the amount spent on them.
- Cost per Engagement (USD): The average amount of money spent to acquire a single engagement (like, comment, share).
- Sentiment Trends Score: A quantified measure of audience perception (positive, neutral, negative) derived from comments and mentions.
- Click-Through Rate (%): The percentage of users who clicked on a link within your social media post or ad.
- Top Content Category Engagement: The engagement rate segmented by post theme or category (e.g., Gift Guides, DIY).
- Hashtag Performance: The reach or engagement attributed to specific campaign hashtags.
Frequently Asked Questions
1. What is the purpose of this social media dashboard?
It helps marketing teams measure, analyze, and optimize the performance of their Christmas social media campaigns to maximize engagement, reach, and return on investment.
2. Can the dashboard show which influencers are most effective?
Yes. The Influencer Performance Comparison chart directly compares engagement rates, and the Influencer ROI metric shows their financial impact.
3. How does the dashboard help with content creation?
By showing Engagement by Content Type and Top Performing Post Categories, it reveals which creative formats and themes work best for your holiday audience.
4. Who uses this dashboard?
Social Media Managers, Digital Marketing Managers, Brand Managers, Influencer Marketing Specialists, and Content Strategists.