What is a Christmas Retail Performance Command Center Dashboard?
A Christmas Retail Performance Command Center Dashboard is a comprehensive operational efficiency tool designed to monitor and drive festive season sales success across physical and digital retail channels. It consolidates key metrics like revenue, footfall conversion, basket value, and inventory sell-through into a single visual platform. By integrating festive season footfall conversion tracking, Christmas inventory sell-through analysis, and holiday customer segment performance, the dashboard helps retail managers optimize promotions, manage stock levels, and tailor strategies to key shopper groups. The dashboard acts as a central hub for identifying revenue trends, evaluating top-selling SKUs, and understanding demographic purchasing patterns during the critical holiday period.
How to Create a Christmas Retail Performance Command Center Dashboard
You don’t need to build your report from scratch—just start with a ready-to-use dashboard template from Mokkup. Add in your data and export it however you like. Here’s how to do it:
1. Create or Log in to Your Mokkup Account
Start by signing up on Mokkup.ai using your email. If you already have an account, just log in, and you’ll be good to go.
2. Choose and Customize Your Dashboard Template
Find the Christmas Retail Performance Command Center dashboard template in the Templates section. Use the drag-and-drop editor to adjust KPIs, edit filters, or add elements based on your data.
3. Export to Your BI Tool
Once your dashboard wireframe is ready, use the BI Tool Export feature to send it directly to Power BI or Tableau for further analysis and enhancements. You can also download the dashboard as a PDF, PNG, or JPEG, embed it on a platform, or invite your team to collaborate.
Note: This is a Pro template. You’ll need a Pro subscription on Mokkup to use and customize this dashboard wireframe. Upgrade anytime to unlock full access.
Christmas Retail Performance Command Center Dashboard Example
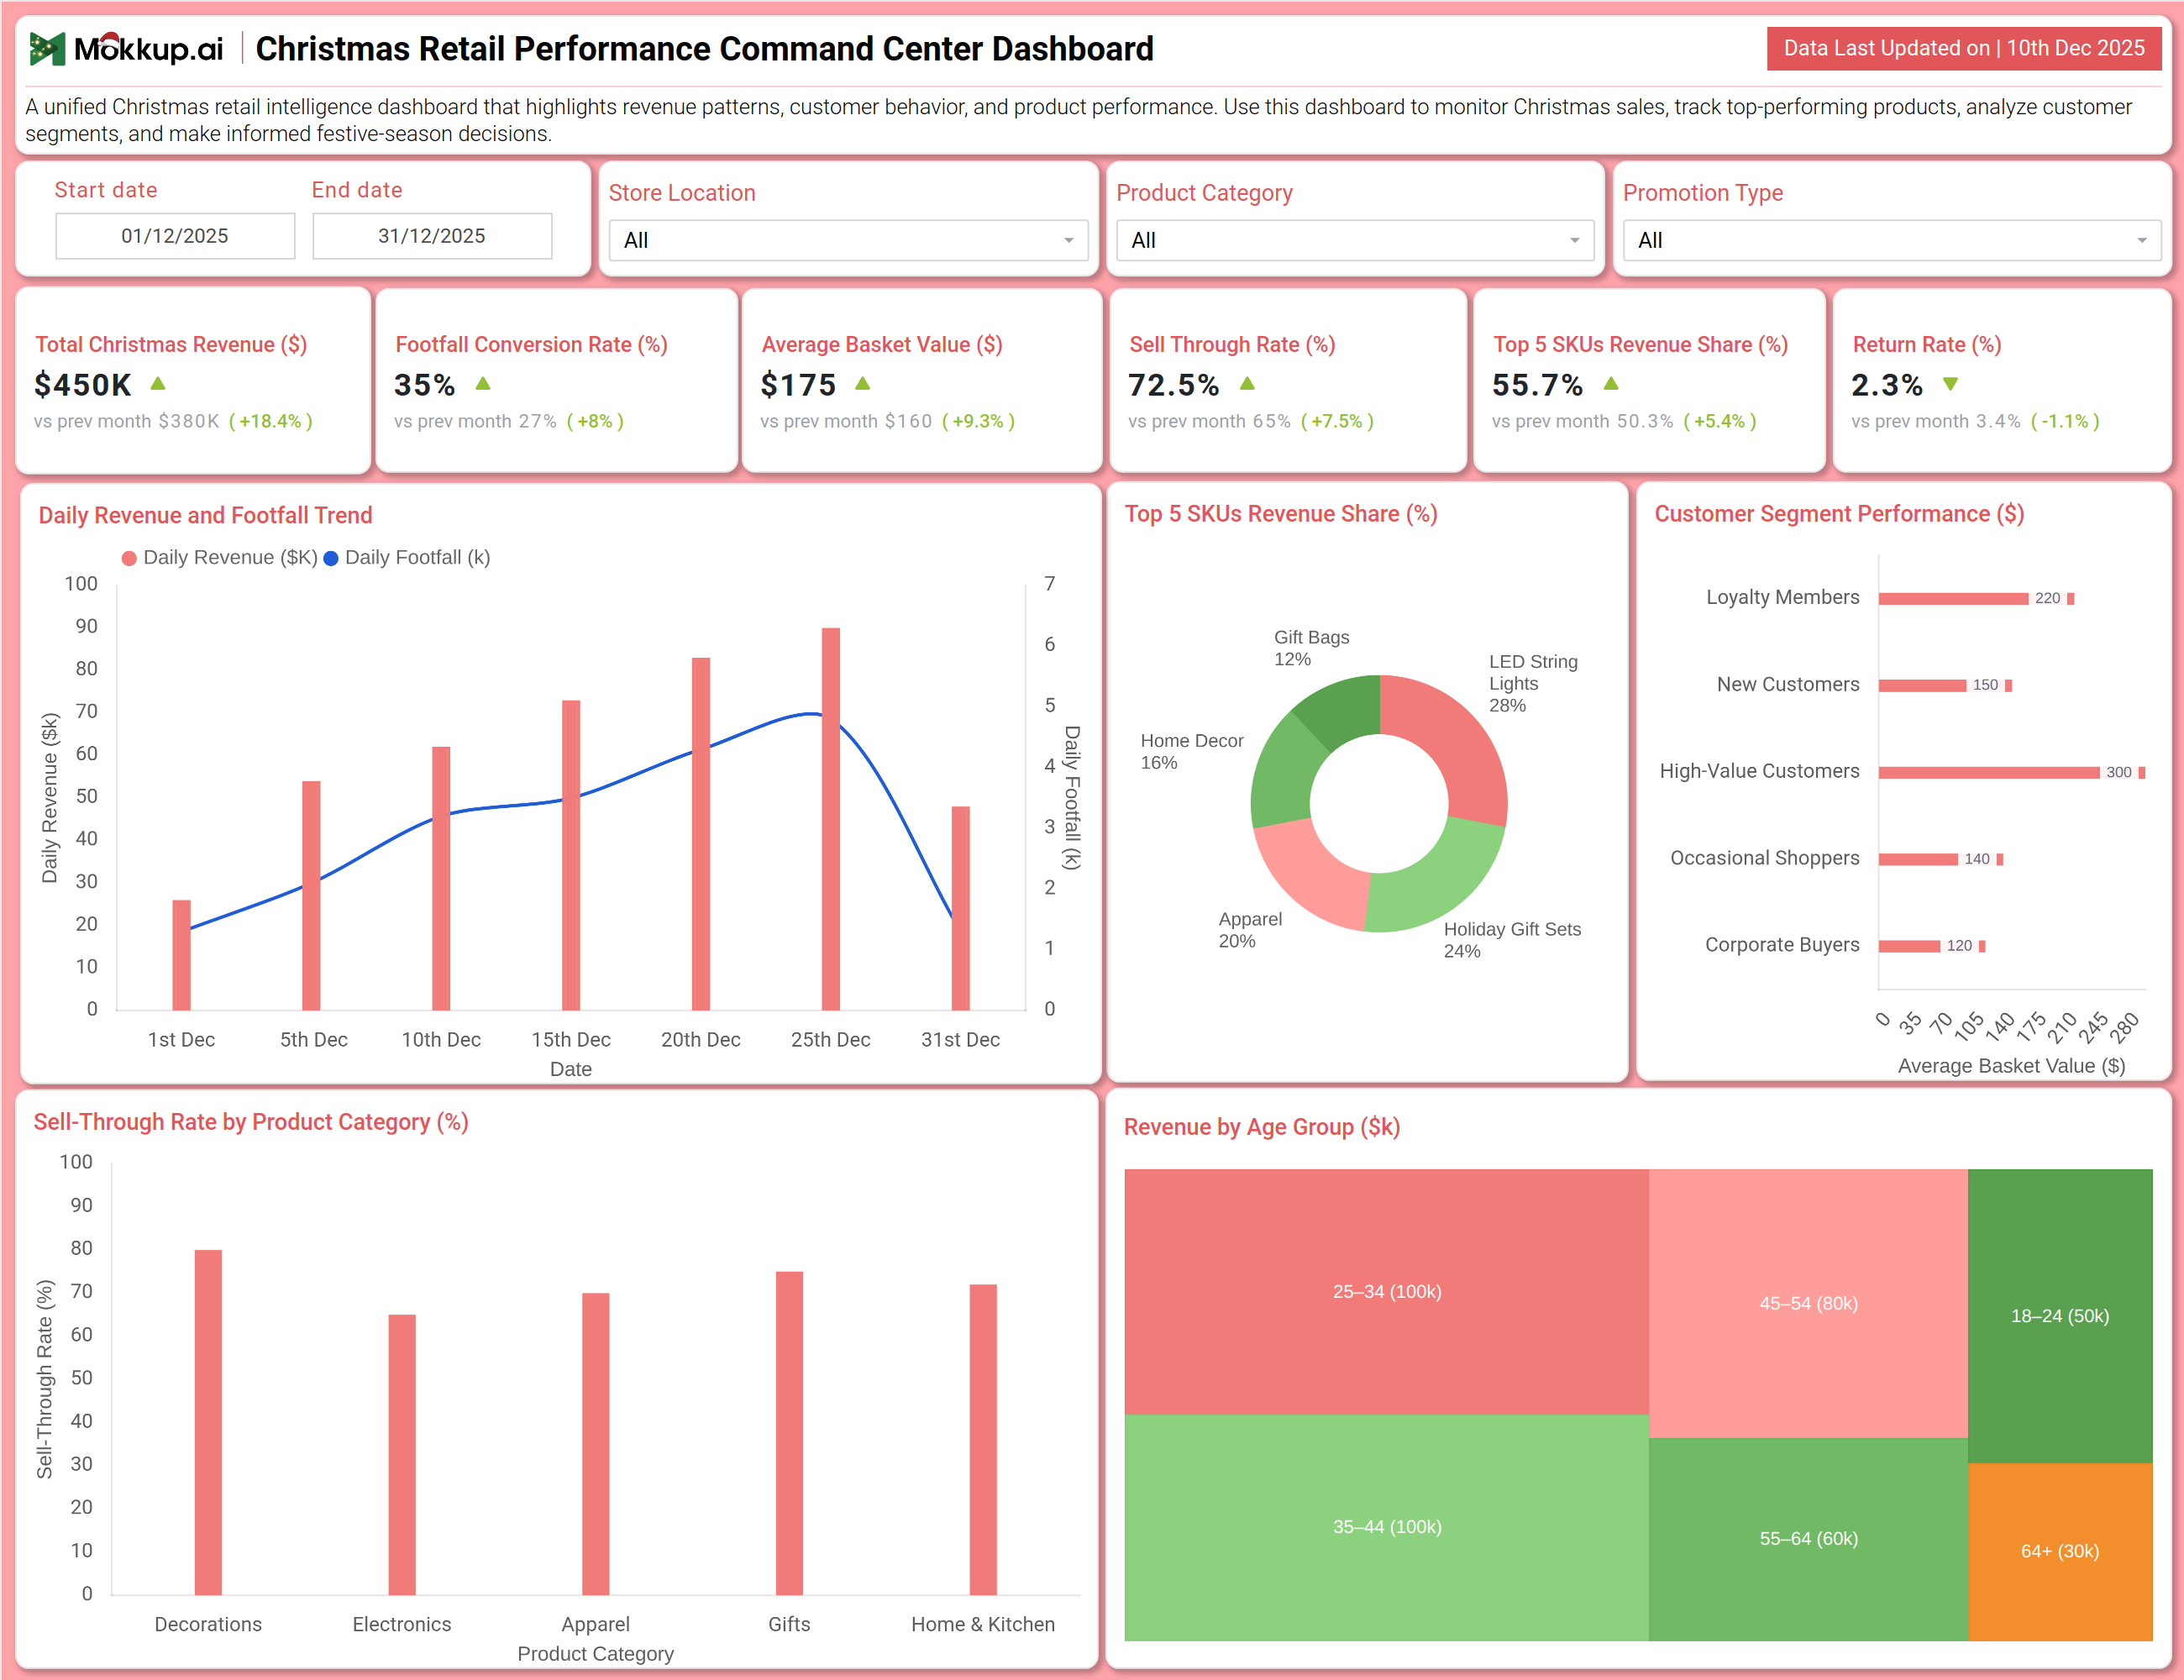
You can create a Christmas Retail Performance Command Center Dashboard that brings together sales performance, customer intelligence, and product analytics into a unified view. A typical dashboard includes a Sales & Traffic Overview section, where users can track Total Christmas Revenue, Footfall Conversion Rate, and Average Basket Value. Visual charts like the Daily Revenue and Footfall Trend reveal peak shopping days and traffic patterns. The Product & Customer Analysis section builds on this by displaying the revenue share of Top 5 SKUs, Sell-Through Rate by Product Category, and a breakdown of Revenue by Age Group and Customer Segment Performance. Together, these modules deliver crucial holiday retail KPI tracking that helps teams maximize sales, optimize inventory, and execute targeted marketing for different shopper profiles.
How to Analyze Data in Christmas Retail Performance Command Center Dashboard
Here is how you can analyze data from this dashboard:
- Monitor Total Christmas Revenue to measure overall sales success and growth compared to previous festive periods.
- Track Footfall Conversion Rate to assess how effectively store or site traffic is being converted into paying customers.
- Analyze Average Basket Value to understand customer spending per transaction and the impact of upselling or bundling strategies.
- Measure Top 5 SKUs Revenue Share to see how much of your total revenue is concentrated in your best-performing items.
- Observe Return Rate to monitor product satisfaction and identify potential quality or description issues.
- Study Daily Revenue and Footfall Trends to pinpoint peak shopping days and align staffing and promotions accordingly.
- Examine Customer Segment Performance to compare revenue contribution from Loyalty Members, New Customers, High-Value Customers, etc.
- Assess Revenue by Age Group to tailor marketing messaging and product assortments to the demographics driving sales.
Benefits of Christmas Retail Performance Command Center Dashboard
The following are the benefits of using this dashboard:
- Provides centralized visibility into all critical festive sales, traffic, and inventory metrics across the retail operation.
- Supports festive season footfall conversion tracking to improve in-store or onsite merchandising and staff effectiveness.
- Improves decision-making with clear insights into Christmas inventory sell-through analysis for smarter stock management.
- Enhances holiday customer segment performance understanding to drive personalized marketing and loyalty initiatives.
- Increases revenue through data-driven optimization of promotions, product mix, and pricing based on real-time trends.
- Strengthens holiday retail KPI tracking with an integrated view of financial, operational, and customer metrics.
- Reduces manual reporting workload during the peak season with automated, consolidated data visualization.
- Ensures preparedness for demand surges by monitoring daily trends and enabling proactive inventory and staffing adjustments.
KPIs to Track in Christmas Retail Performance Command Center Dashboard
The following key KPIs can be tracked by using this Christmas sales performance dashboard:
- Total Christmas Revenue ($): The total sales income generated during the defined holiday season.
- Footfall Conversion Rate (%): The percentage of store visitors or website sessions that result in a purchase.
- Average Basket Value ($): The average monetary value of each customer transaction.
- Sell-Through Rate (%): The percentage of inventory that has been sold relative to the total stock received for a period.
- Top 5 SKUs Revenue Share (%): The proportion of total revenue attributed to the five best-selling individual products.
- Return Rate (%): The percentage of sold items that are returned by customers.
- Daily Revenue Trend ($): The day-by-day progression of sales throughout the holiday period.
- Customer Segment Revenue Contribution ($/%): The sales breakdown by customer type (e.g., Loyalty Members, New Customers).
Frequently Asked Questions
1. What is the purpose of a Christmas retail dashboard?
It helps retailers holistically monitor holiday sales performance, customer behavior, and product movement to make agile, profitable decisions during the festive rush.
2. Can the dashboard help manage holiday inventory?
Yes. By tracking Sell-Through Rate by category, it identifies fast- and slow-moving items, informing markdown and reorder strategies.
3. How does the dashboard assist in customer targeting?
It reveals which customer segments (e.g., High-Value, Corporate Buyers) and age groups generate the most revenue, allowing for focused marketing.
4. Does it show which specific products are driving sales?
Yes. The Top 5 SKUs Revenue Share metric highlights your best performers, crucial for planning promotions and featured displays.
5. Who uses this dashboard?
Retail managers, store directors, inventory planners, marketing managers, and regional operations heads.