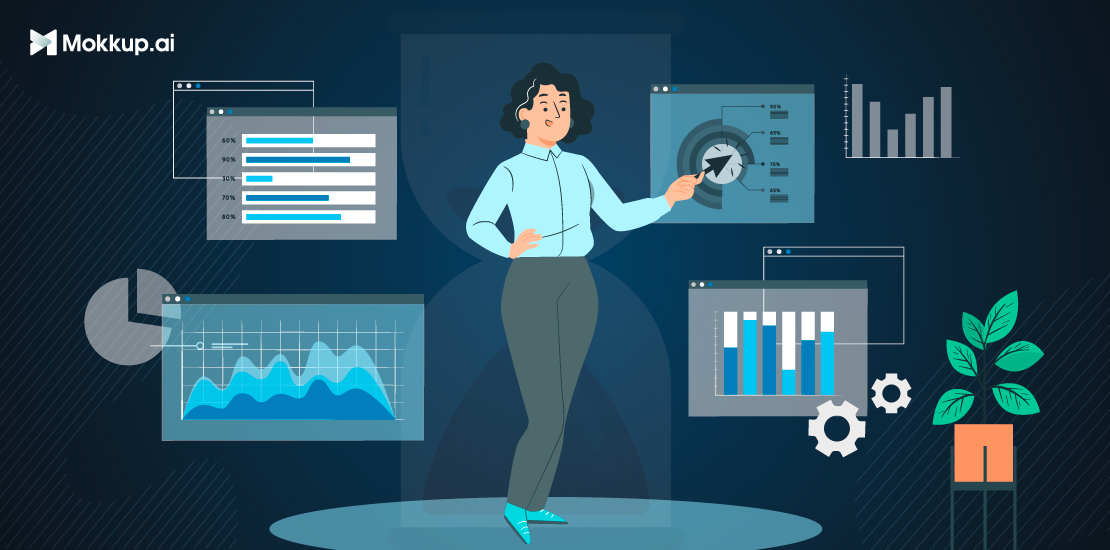
A dashboard is a clear and simple way to analyze data. A dashboard shows important information about a business process, function, or goal in an easy to understand format.
Managers can use dashboards to identify improvement areas and address faults in business performance. Dashboards include both current and historical data visuals, important for monitoring productivity and finding new patterns. These dashboards usually contain time-sensitive data, such as number of clicks, views, sales by region, etc.
Real-time dashboards might not be crucial for monitoring long-term financial strategies and their KPIs. Still, they play a vital role for sales and marketing teams keeping tabs on daily and hourly key performance measures. These dashboards help save time by reducing waiting times for operations.
Table of Contents
- What is a Real-Time Dashboard and Why is it Important?
- Key Considerations When Designing an Effective Real-Time Dashboard
- How are Real-Time Dashboards Used in Business Operations?
- What are the Benefits of Using Real-Time Data in a Dashboard?
- How to Overcome the Challenges?
What is a Real-Time Dashboard and Why is it Important?
A real-time dashboard is a visual tool that displays the most recent data. It is used to track, analyze, and report on real-time information. These kinds of visual representations combine historical data with real-time data to track productivity and emerging patterns.
As organizations boost their capacity to gather and aggregate ever-increasing volumes of data, real-time dashboards are being used by IT operators and other staff members for the most recent information on various kinds of operational, security, and business performance metrics.
There are two main functions of dashboards - “Alerting and Responding”. With a live dashboard, the most significant metrics are always visible to you. For example, It helps e-commerce businesses understand if customer queries are being resolved in a timely manner and up to customer’s satisfaction.
It tracks logistics movement to and from warehouses, sales of specific products, top selling products in real time.
A well-designed real-time dashboard indicates if businesses are working accordingly. It shows the flow of orders and how it has changed from a month or year ago. If the dashboard finds an issue, inquiry support can help determine if it's a real problem or a chance for improvement. Access to real-time data enables immediate insights and informed decision-making, driving agile and responsive actions within the organization.
Key Considerations When Designing an Effective Real-Time Dashboard
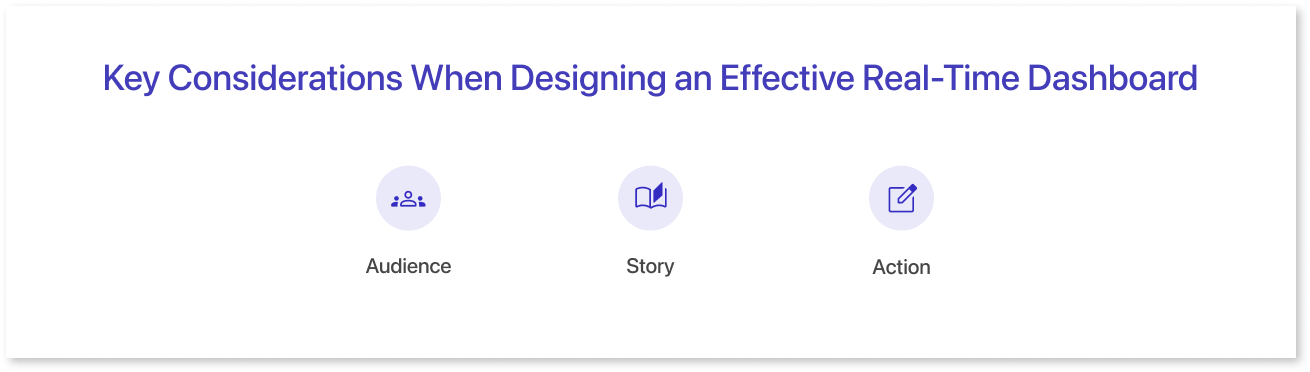
Modern live dashboards can update data visuals on their own, unlike older ones that needed refreshing constantly. To create a good real-time dashboard, you need to think about these things:
Audience:
Your first question should be “Who is going to use your dashboard?.” Considering that it will rely on the target user. When making a dashboard for executives, include a summary of important KPIs.
Story:
Tell a story with the data so your audience can understand what they see on the dashboard. Don't only relay the facts; instead, make sure they are presented in a clear and easily understood manner.
Action:
Real-time dashboards aim to provide clarity and drive action in addition to delivering information and figures. In the end, your key takeaway message is what connects with individuals.
Wireframing has made the creation of dashboards quick and easy. You can create mock dashboards that can help you give a complete picture of your final design. Mokkup.ai is a dashboard wireframing tool that helps you build your own customized dashboard wireframes for easy visualization and final implementation.
Moreover, the integration of machine learning and artificial intelligence in data visualization has made identifying trends and finding outliers much easier. This is especially useful when handling big data. Real-time dashboards help display this data in a user friendly, easy to grasp manner
How are Real-Time Dashboards Used in Business Operations?
Real-time analytics dashboards can be used to show various metrics, key performance indicators (KPIs) and updates in real time. The dashboards are customizable to fit organizational requirements, allowing users to select options aligned with their specific business needs.
An individual working in IT operations, for instance, could prefer to use a personalized dashboard that shows operational data. Security-related metrics would be helpful to a security analyst. The CEO or CFO can use KPI dashboard to examine important business metrics.
There are benefits specific to each of these uses for the business. Let’s have a look at a few of the real-time dashboards that can be used for live analysis discussed below:
Operations Analytics:
Data Visualization through operational dashboards enables IT experts to quickly spot problems impacting customers and apply solutions before they heavily impact earnings. For example, IT operators can use real-time dashboards to track the log-ins per minute in a cloud-based online application.
A positive surge in log-in attempts could indicate that an unauthorized user is trying to overload the server with requests, whereas a sudden reduction in attempts could indicate that there is unexpected downtime affecting the service.
Either way, having real-time situational monitoring enables IT managers to spot and fix problems right away.
Security Analytics:
A live dashboard is a useful tool for a security analyst to monitor possible weaknesses in the organization's IT infrastructure. These dashboards can be customized to show important security information in real time, such as the history of malware scans performed on the network, lists of blocked users or IP addresses, network administrators, trusted devices, recorded events, and suspicious activities.
Complex Event Processing (CEP) is an essential component of top security analytics systems and is frequently combined with machine learning or artificial intelligence. Through real-time dashboards, these tools assist in identifying and reporting suspicious behaviors and defects to analysts right away.
Social Media Analytics:
Social media analytics involves collecting and analyzing data from social platforms to understand how content performs, audience behavior, and the impact of social activities on business goals. It helps in making informed decisions and improving strategies based on these insights. It goes beyond simple metrics like likes, follows, retweets, previews, clicks, and impressions from single channels.
The ability to customize dashboards according to the data at hand enables users to concentrate on displaying the most important information, providing a clear picture for making business choices.
What are the Benefits of Using Real-Time Data in a Dashboard?
Real-time data analysis can help you in accomplishing a number of dashboard objectives, including boosting productivity and efficiency, enhancing creativity and development, raising customer happiness and loyalty, and improving situational awareness and outcome.
It also significantly influences how smoothly and effectively a business can identify and resolve security threats, operational problems affecting customers, and new business ideas. With real-time dashboards, helps businesses to:
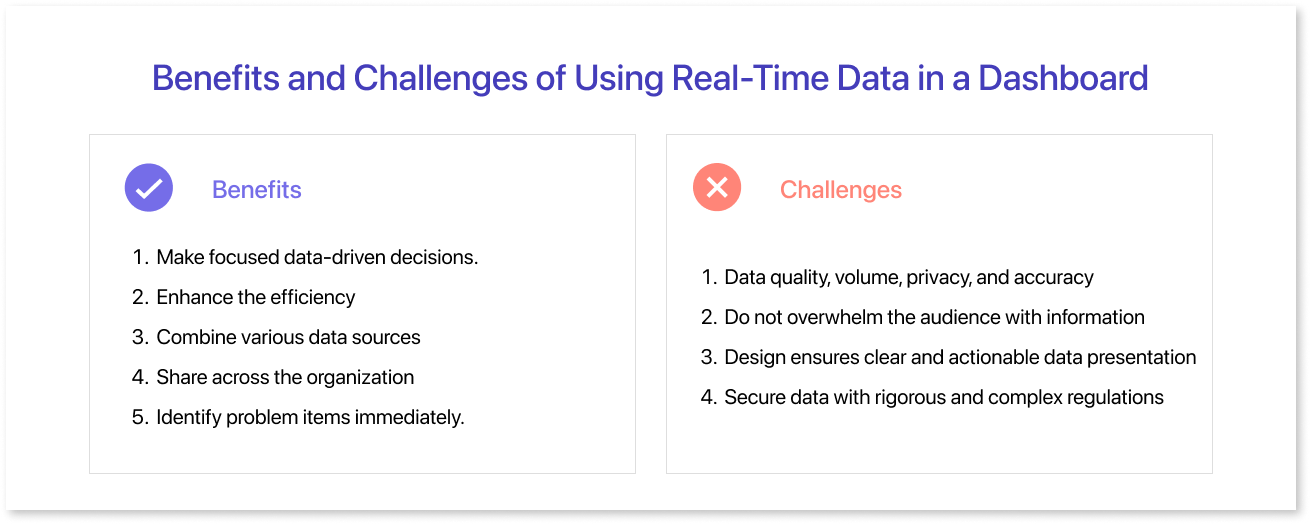
- Make focused data-driven decisions.
- Enhance the efficiency by enabling access to the most recent data.
- Combine various data sources into a single visualization tool.
- Share across the organization for effective communication and exchange of information.
- Identify items that need immediate intervention and can prevent major breaches.
Challenges of Using Real-Time Dashboards:
While using a real-time dashboards users can face certain challenges, such as:
- Various challenges and risks associated with real-time data, are problems with data quality, volume, privacy, and efficient visualization and communication. It's crucial to verify sources and resolve any differences to guarantee the accuracy and completeness of the data. Cleaning real-time data might not happen accurately due to its rapid nature.
- Users often grapple with the challenge of presenting a wealth of information without overwhelming their audience, leading to a struggle to find the right blend of insights without cluttering the interface.
- The challenge lies in implementing measures, indicators, and formats that eliminate misunderstandings or confusion, making the presented data not just informative but actionable. Users face the task of creating a design that not only communicates information but also prompts decisive actions without causing misinterpretation or uncertainty.
- Users are confronted with the task of fortifying data against breaches and complying with multifaceted regulations. This requires not only careful but also extensive security measures and strict adherence to legal frameworks.
How to Overcome the Challenges?
Let’s delve deeper into how we can overcome the challenges when using real-time data:
- Set guidelines on how data should be handled, make use of tools that combine and organize data,and create clear ways to cleanse the data.
- Create wireframes before diving into development. Get feedback on these wireframes and adjust the displayed metrics as needed before starting with the actual data.
- Employ an ETL (Extract, Transform, Load) process within the real-time dashboard. This includes gathering data from multiple sources, applying filters to remove clutter, integrating historical/contextual data, and compressing it for optimal storage. By doing so, users can streamline information, reduce noise, and improve data quality.
- Encrypt and anonymize your real-time data in order to keep it safe, and keep a close watch for breaches or violations. Inform users about your policies, get their consent, and listen to their feedback.
- Ultimately, create a user-friendly dashboard with pertinent visuals in order to bridge your live data with your objectives and your intended audience, ensuring a meaningful connection between them.
Conclusion
Businesses that have top-notch data collection and processing methods and embrace widespread use of real-time dashboards have a promising future ahead. This technology finds applications across various business departments.
Focusing on using precise and prompt data, artificial intelligence, and machine learning in dashboard software is important for businesses. It leads to more precise data and enhanced analysis methods, providing valuable insights for business executives and data analysts.
Try Mokkup.ai!
Prompt it. Wireframe it with Mokkup.ai.
