Let's admit it. Without a clear signal of your business's performance, decision-making becomes a guessing game, and guesses don’t scale. That’s where KPI dashboards step in.
Running a business without real performance visibility is like driving blind. You might think you're heading in the right direction. But by the time you realize otherwise, you're already off course. The solution could be well-built KPI dashboards that give you a read on what actually matters. These dashboards translate data into decisions by tracking the right trends, spotting critical anomalies, and aligning teams.
In this blog, we’ll explain KPI dashboards, why they matter, how to build one that works, and how to use one to measure your business's success in real time.
Table of Contents
- What is a KPI Dashboard?
- Why KPI Dashboards Are Critical for Business Growth?
- What Should a Good KPI Dashboard Include?
- Types of KPI Dashboards and Their Use Cases
- Steps to Measure Business Success Using KPI Dashboards
- A KPI Dashboard Designing Tool to Get Started
What is a KPI Dashboard?
A KPI dashboard stands for Key Performance Indicator dashboard. As its name suggests, it is a quick visual status report for your business KPIs that is easy to understand. Instead of hunting down numbers from different places or drowning in spreadsheets, it puts all the vital information in one view so you can instantly see how things are going and where you might need to fix something.
Different teams want to monitor different KPIs for their business. For example, a marketing team might consider tracking the number of people visiting the website or leads inflow as the key indicators. On the other hand, the finance team will probably want to keep an eye on cash flow. A good key performance indicators dashboard helps pull all those numbers together so everyone can stay on the same page without the hassle.
Most KPI dashboard examples stick to simple visuals, like charts or color-coded signals, that make it super clear what’s good and what’s not. The goal isn’t to show every number but focus on the data that matters, making decisions faster and easier.
If you want to explore the basics further, check out our detailed blogs on what a KPI dashboard is. Equally important is understanding the difference between a KPI dashboard and an individual KPI metric.
Why KPI Dashboards Are Critical for Business Growth?
Good businesses are usually the ones that rely on data-driven decisions. However, data alone isn’t enough to make those decisions; insights are equally important. KPI dashboards help make these insights accessible instantly for businesses. With that, the businesses enjoy the following benefits, which eventually lead them to develop an edge over their competitors:
- They get to make faster decisions due to real-time data visibility
- It improves alignment across teams by focusing everyone on shared goals
- It helps in early identification of risks before they escalate
- It shows measurable improvements in key areas like sales, customer retention, and employee productivity
Tracking key metrics in customer retention with a KPI dashboard, for example, helps you spot loyalty drop-offs before revenue is impacted. Similarly, companies pairing KPI dashboards with strategic business goals see stronger growth rates and operational efficiency due to quicker access to meaningful insights. Even a study by the KPI Institute revealed that 68% of respondents reported a positive improvement in business performance.
What Should a Good KPI Dashboard Include?
A good KPI dashboard includes specific non-negotiable components that allow it to help businesses gather significant information and act on it. Here’s what makes a dashboard truly effective:
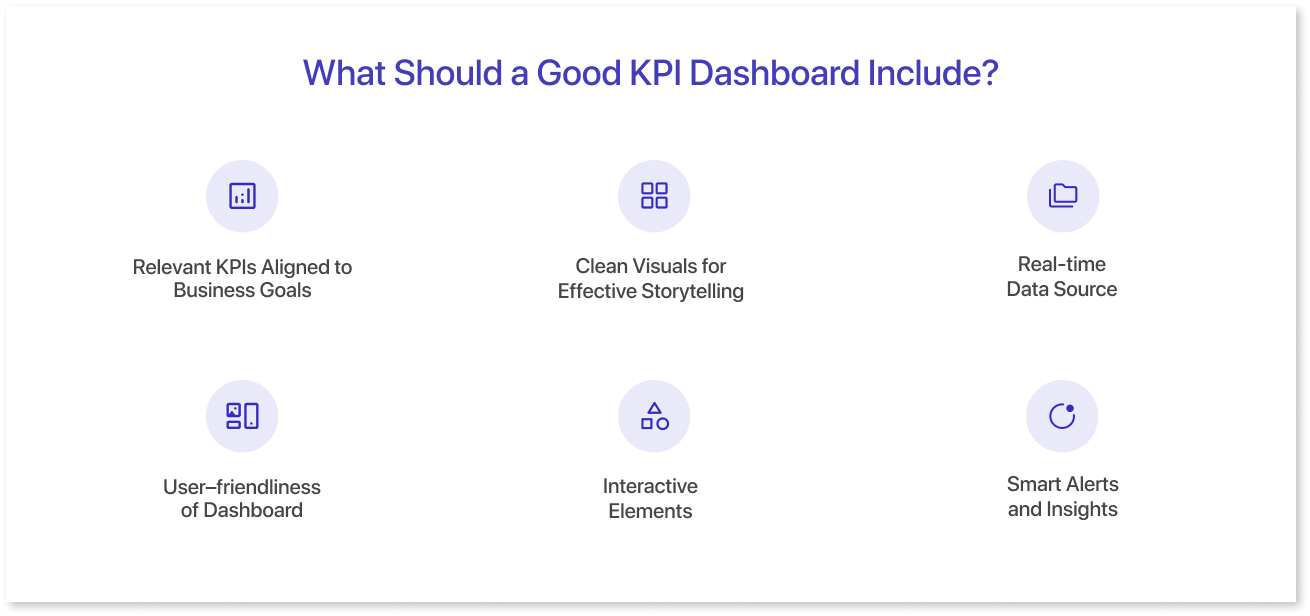
1. Relevant KPIs Aligned to Business Goals
The first and most important component of a good KPI dashboard is picking the right set of KPIs. Every metric on your dashboard should directly connect to a business objective. To select them, prioritize key performance indicators that reveal progress or risks tied to your strategic goals. While doing that, avoid cluttering as too many KPIs dilute focus. Some KPI examples could be revenue, gross revenue, organic traffic and more.
2. Clean Visuals for Effective Storytelling
Use simple charts, progress bars, and color codes to make information easy to digest. Understand details of charts, such as what makes a bar chart and column chart different, to decide which fits better for your business KPIs. Visual clarity helps stakeholders quickly spot trends and anomalies without wrestling with data.
3. Real-time Data Source
Real-time or close-to-real-time updates are crucial. Dashboards that update frequently allow for swift responses to emerging issues or opportunities. Old data can lead to bad calls or missed chances. When you see things as they happen, you can move faster.
4. User–friendliness of Dashboard
Like all business intelligence dashboards, a KPI dashboard must also be designed for its potential users. Know who will use it and customize it accordingly. For example, if you are building a KPI dashboard for employee performance, focus on metrics that managers need to track productivity and engagement.
5. Interactive Elements
Interactivity is another plus. Features like drill-downs, filters, and tooltips empower users to explore data beyond surface numbers. This flexibility helps teams uncover root causes rather than just observe outcomes.
6. Smart Alerts and Insights
No matter how useful a key performance indicator dashboard is, no one can always keep looking at it. This is why incorporating rule-based alerts can flag unusual patterns automatically so your team doesn’t miss critical changes.
If you want to see these ideas in action, here’s a great read on the 7 best must-have features for your KPI dashboard. It’s practical and worth a look.
Types of KPI Dashboards and Their Use Cases
Measuring business success with KPI dashboards is only possible when you pick the right KPI dashboard in the first place. Let’s break them down, so you can understand the right pick for your business needs.
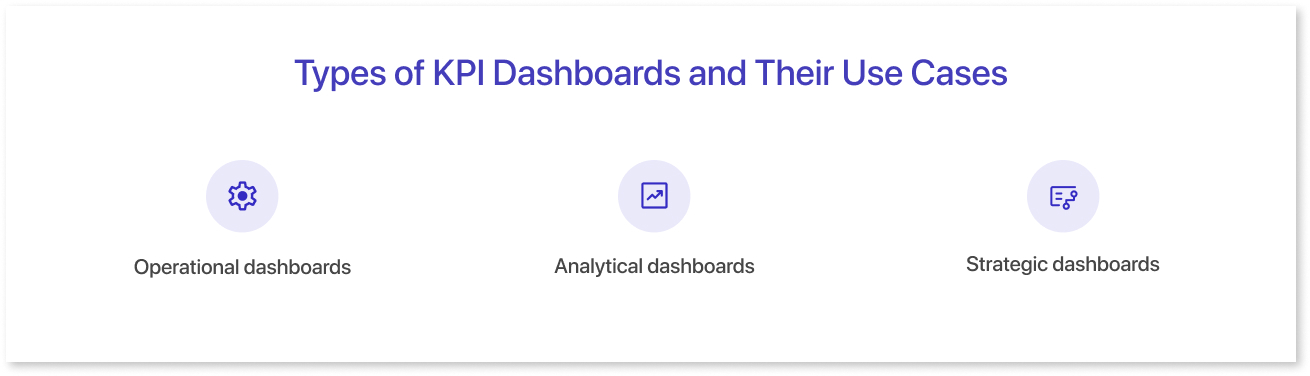
- Operational dashboards track day-to-day KPIs in real time. They help the team associated with daily operations visualize a large amount of information in clear and simple visuals. They are specifically helpful for industries like construction, sales, marketing, and manufacturing.
- Analytical dashboards are known for their depth and ability to show trends across time. They are great for identifying data discrepancies and comparing performance trends. Their historical data makes it easier for businesses to comprehend what went wrong and caused the fluctuations.
- Strategic dashboards include long-term performance, like quarterly targets and big-picture goals. They are best suited to see the company’s current condition and growth.
Once you decide which type fits your business goal, consider looking at widely used KPI dashboard examples that are known to nail UX and clarity for inspiration.
Steps to Measure Business Success Using KPI Dashboards
Now that we have understood KPI dashboards, their components, and types, let’s know how to measure business success step-by-step through them.
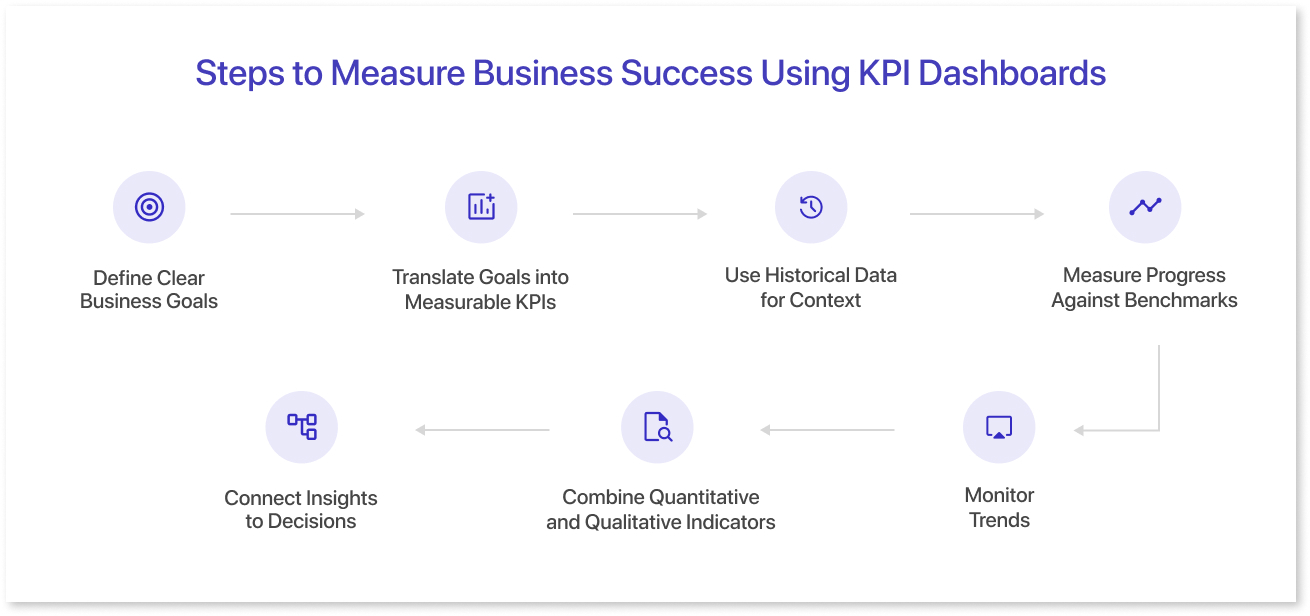
- Define Clear Business Goals: Your dashboard is only as good as the questions it answers. Start by pinpointing what success means for your business. Is it growth, efficiency, customer satisfaction, all three, or none?
- Translate Goals into Measurable KPIs: Based on your goals, select KPIs that truly measure progress. For example, profitability KPIs like gross margin, liquidity ratios for cash flow health, or efficiency KPIs like inventory turnover.
- Use Historical Data for Context: To measure growth, compare current KPIs with historical performance or KPI charts. For example, if your average order value was $75 last year and it’s now $82, that could be considered growth.
- Measure Progress Against Benchmarks: To make your KPI dashboard more meaningful, set benchmarks for your data. Benchmark your results against industry averages or your own set performance targets. For example, if your e-commerce site has a 2.5% conversion rate, and the industry average is 3.2%, the dashboard data tells you there's room to improve.
- Monitor Trends: Use your dashboard’s trend analysis to track KPI movements over weeks, months, or quarters. This helps you distinguish between short-term wins and sustainable growth.
- Combine Quantitative and Qualitative Indicators: Try to connect numbers with qualitative insights for a complete picture. For example, a rising customer churn rate might be explained by support tickets showing increased complaints about product usability.
- Connect Insights to Decisions: A KPI dashboard only measures success if it drives action. Thus, it's important to take the right actions on them after getting insights. Say, in a marketing KPI dashboard example, your cost-per-lead is trending upward, then the marketing team might need to refine targeting. Connecting insights with actions is the key to getting better insights next time.
When used this way, KPI dashboards stop being a static reporting tool and become an ongoing performance scorecard. They let you measure what matters, track how fast you’re improving.
A KPI Dashboard Designing Tool to Get Started
According to a Luzmo survey, 40% said the data doesn’t sufficiently support decision-making. This indicates the need to incorporate helpful KPI dashboard design tools into business operations that can convert data into insights. Tools like Mokkup.ai empower you to create clean, interactive business intelligence dashboards without deep technical skills. It also lets us take inspiration from a few free KPI dashboard design templates
Mokkup helps you:
- Quickly build dashboards tailored to your business needs with 250+ pre-built templates
- Incorporate interactive KPI charts and visuals in 15+ color palettes
- Get AI-driven dashboard wireframes with simple textual prompts
- Collaborate on the initial dashboard drafts with the team to prepare the final one
- Export the dashboard wireframes to multiple BI tools like Tableau and Power BI
Check out the wide ensemble of Mokkup pre-built KPI dashboard examples to get inspiration for your business.
Conclusion
Measuring business success should not need to be guesswork. KPI dashboards provide a clear window into performance, enabling faster decisions and better alignment among teams. Choosing the right KPIs, dashboard type, and tools gives your business a powerful compass to navigate growth and change. Start building one today, tailored to your unique goals with the help of Mokkup, that’s, and watch how clarity leads to success.
Frequently Asked Questions
A KPI dashboard pulls key metrics into real-time views, helps you catch issues, highlights trends, and aligns teams so decisions are based on insights.
Focus on metrics tied to your goals, like profitability, gross/net margins, efficiency, inventories, turnaround, liquidity, ratios, employee performance, or project health.
Some important components of key performance indicator dashboards are a clear purpose, a few meaningful KPIs, visuals that guide, not clutter, interactions, real-time updates, alerts, and review cycles.
Start by defining your goal. Pick KPIs that reflect progress toward it. Design dashboards that spotlight progress and iterate as goals shift.
Mokkup is a BI dashboard design tool that lets you craft dashboards that follow these best practices without incurring tech overhead.
Prompt it. Wireframe it with Mokkup.ai.
