Building a strong business analyst portfolio is essential at any stage of your career. As the role continues to grow in importance, employment for business analysis and related analytics roles is projected to expand significantly, with jobs in fields like data analysis and business analytics expected to grow faster than the average occupation over the coming years.
In fact, analyst roles are forecasted to grow by around 23% through 2031, reflecting strong and sustained demand for professionals who can turn data into decision-ready insights.
A well-structured portfolio highlights your ability to work across different use cases, tools, and business contexts. It can include dashboards, process improvements, market analysis, and data-driven recommendations, all supported by clear documentation. For recruiters and hiring managers, this makes it easier to assess your analytical thinking, communication skills, and business impact.
Table Of Contents
- What Type of Projects Do Business Analysts Do?
- How To Get Business Analysis Projects?
- Build Your Data Analytics Portfolio with These 5 Essential Chart Types
- Key Tools for Business Analysis in 2026
- 10 Business Analyst Project Examples
What Type of Projects Do Business Analysts Do?
A strong portfolio should include a mix of business analysis projects and business analytics projects that reflect real-world problem solving, stakeholder needs, and data-driven decision-making:
- Relevance to Business Analysis: Ensure the project showcases your skills in data analysis, problem-solving, and business strategy. It should reflect tasks like gathering requirements, creating reports, or improving processes.
- Complexity and Impact: Select projects demonstrating your ability to handle complex problems and deliver significant business impact. Projects with measurable outcomes, such as cost savings or revenue increases, are precious.
- Diverse Skill Set: Aim for various projects, highlighting skills such as data visualization, stakeholder communication, and project portfolio management. This diversity shows your versatility as a business analyst.
- Real-world Applications: Choose projects that have real-world applications and relevance. Employers prefer to see practical experience related to their industry or their challenges.
- Clear Documentation: Ensure you have thorough documentation of your projects, including the problem statement, your approach, the tools you used, and the results. Clear and detailed documentation is crucial for showcasing your thought process and methodologies.
How To Get Business Analysis Projects?
You can build impactful business analyst projects across a wide range of industries by working on real or simulated business analysis projects that reflect common business challenges:
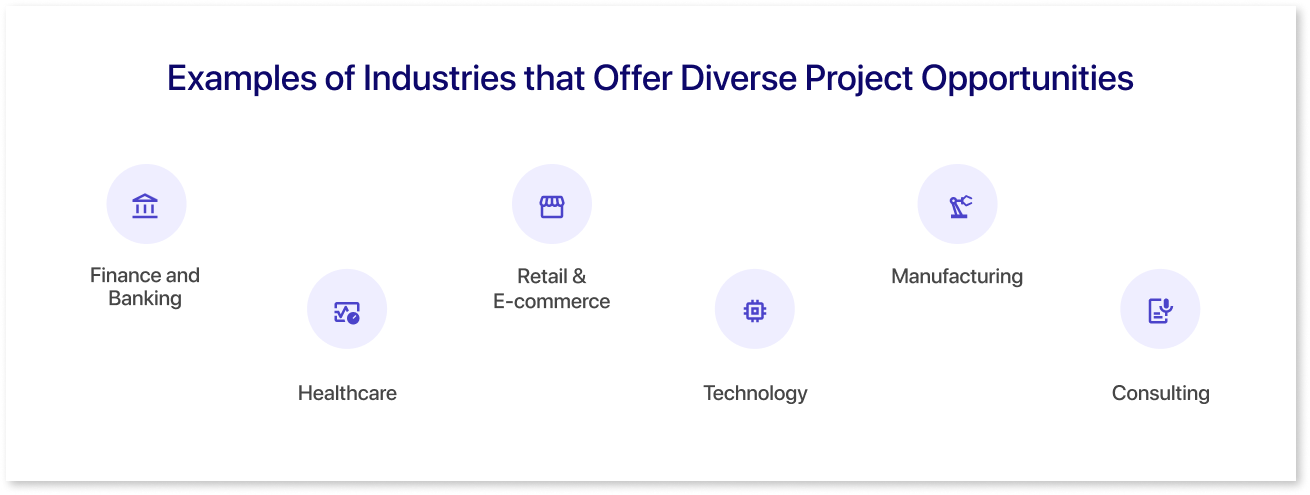
1. Finance and Banking:
- Risk Management: Analyze financial data to identify and mitigate risks.
- Process Improvement: Streamline banking operations to increase efficiency.
- Customer Insights: Use data analysis to understand customer behavior and improve services.
2. Healthcare:
- Healthcare Analytics: Analyze patient data to improve healthcare outcomes.
- Operational Efficiency: Enhance hospital operations to reduce costs and improve patient care.
- Regulatory Compliance: Ensure healthcare practices meet regulatory standards through thorough analysis.
3. Retail and E-commerce:
- Market Analysis: Study market trends to guide product development and marketing strategies.
- Inventory Management: Optimize inventory levels using data-driven insights.
- Customer Experience: Analyze customer feedback and behavior to improve the shopping experience.
4. Technology:
- Product Development: Assist in developing new tech products by analyzing user needs and market trends.
- Data Security: Work on projects to enhance data security and protect against cyber threats.
- Business Process Automation: Implement automation solutions to improve efficiency in tech operations.
5. Manufacturing:
- Supply Chain Optimization: Analyze and improve supply chain processes for better efficiency.
- Quality Control: Use data to ensure product quality and compliance with standards.
- Production Planning: Develop strategies for efficient production planning and resource allocation.
6. Consulting:
- Business Strategy: Work with clients to develop and implement effective business analytics and strategies.
- Performance Improvement: Analyze client operations to identify and implement performance improvements.
- Market Research: Conduct market research to help clients understand industry trends and opportunities.
Build Your Data Analytics Portfolio with These 5 Essential Chart Types
In business analysis, data visualization is a crucial skill. It helps turn complex data into clear and understandable insights. Visualizations make it easier to spot trends, identify outliers, and make informed decisions quickly. And a strong data analytics portfolio should showcase your ability to use various chart types effectively.
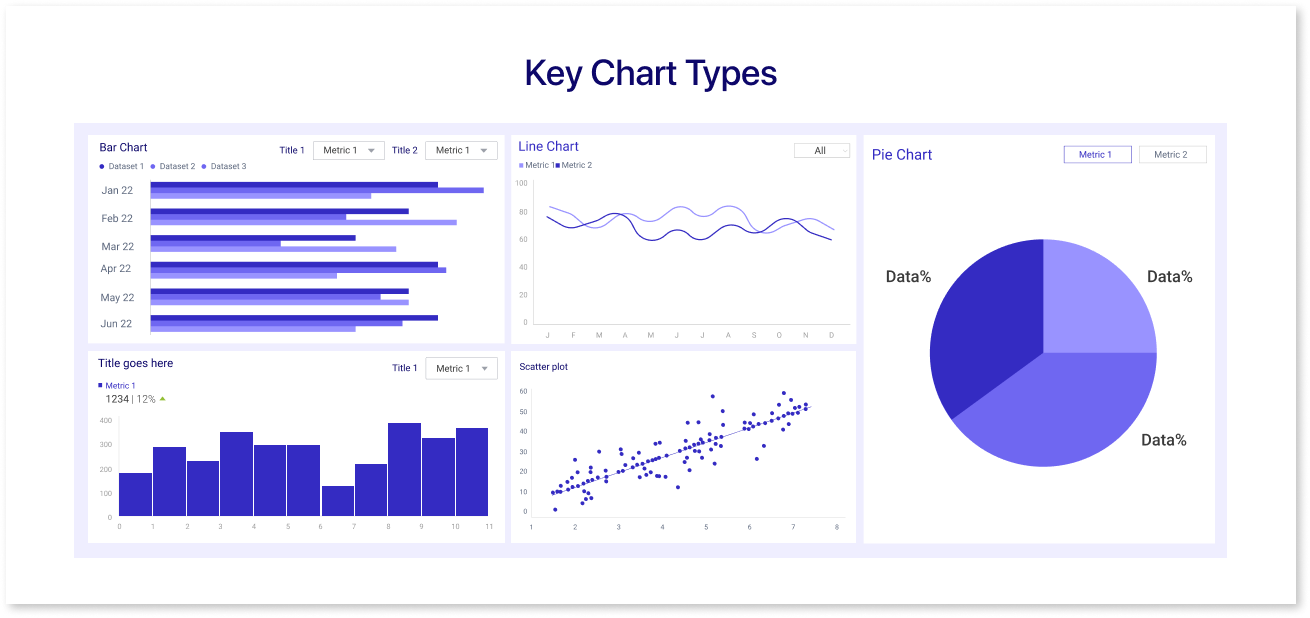
Key Chart Types
| Chart type | Explanation | Value |
Example |
| Bar Charts | Bar charts display data using rectangular bars, where the length of each bar represents a value. They can be oriented horizontally or vertically. | Bar charts are great for comparing different categories or groups, such as sales figures across different regions or the number of customers in age groups. | If you want to compare the quarterly sales of four products, a bar chart will clearly show which product performed best and which needs improvement. |
| Line Charts | Line charts use points connected by lines to show how values change over time. They are ideal for tracking trends. | Line charts help identify trends and patterns over a period. They are commonly used for time-series data, such as stock prices, monthly sales, or website traffic. | Perfect dashboard example with a line chart that can visualize a company's monthly revenue growth over the past year and show whether the trend is upward, downward, or stagnant. |
| Pie Charts | Pie charts represent data as slices of a pie, where each slice’s size is proportional to the value it represents. | Pie charts are useful for showing the proportion of parts to a whole. They give a quick snapshot of the relative sizes of different categories. | To show the market share of different smartphone brands, a pie chart can illustrate how much of the market each brand holds in comparison to others. |
| Scatter Plots | Scatter plots use dots to represent the values of two different variables. Each axis represents one variable. | Scatter plots are valuable for identifying correlations and relationships between variables. They can show how one variable affects another. | To explore the relationship between advertising spend and sales revenue, a scatter plot can reveal whether higher spending is associated with higher sales. |
| Histograms | Histograms are similar to bar charts but are used for continuous data. They group data into bins and show the frequency of data points in each bin. | Histograms help in understanding the distribution of data. They are useful for identifying the shape of the data distribution, such as whether it is normal, skewed, or has outliers. | A histogram can show the number of customers in different age ranges and highlight any age groups with higher or lower frequencies to analyze the distribution of customer ages. |
Key Tools for Business Analysis in 2026
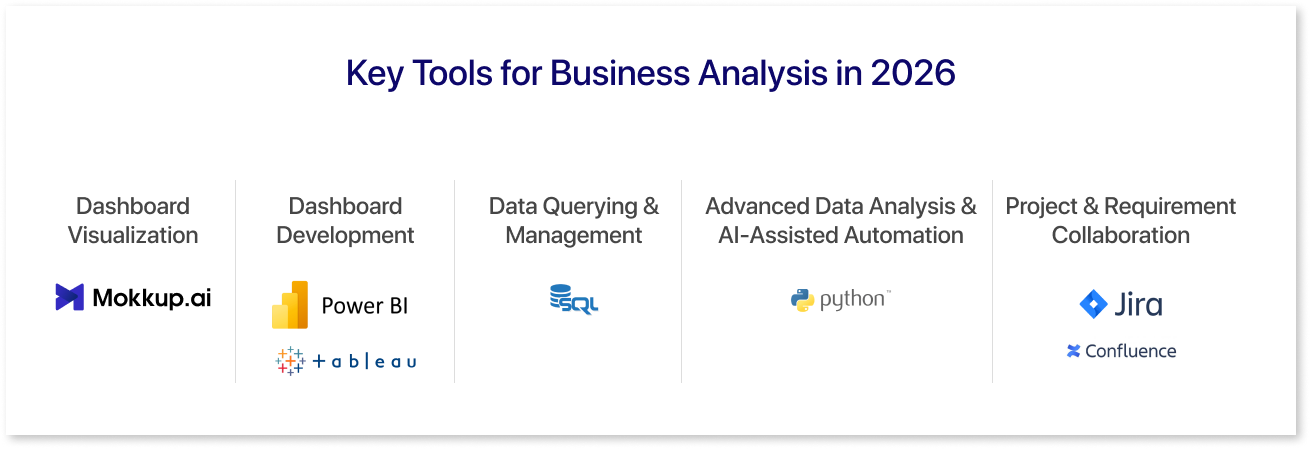
1. Dashboard Visualization & Wireframing:
Mokkup.ai is a dashboard wireframing and visualization tool that helps business analysts plan and structure dashboards before development. It allows analysts to define KPIs, layout, and reporting logic early in the process, making stakeholder reviews faster and more effective.
A key advantage is its BI export feature, which enables dashboard designs to be exported directly to Power BI and Tableau. This helps reduce rework between design and development and ensures consistency between wireframes and final BI dashboards.

2. Dashboard Development & BI Tools:
Power BI and Tableau remain core BI tools, now enhanced with built-in AI capabilities such as natural language queries, automated insights, and anomaly detection. These features help business analysts identify patterns faster and explain insights more clearly. Portfolio projects using these tools show both analytical and AI-assisted decision-making skills.
3. Data Querying & Management:
SQL continues to be essential for extracting, cleaning, and validating data from databases. It enables business analysts to work directly with large datasets and ensure accuracy before analysis. SQL-based projects demonstrate strong analytical foundations.
4. Advanced Data Analysis & AI-Assisted Automation:
Python is widely used for advanced analysis, automation, and AI-assisted workflows such as predictive analysis and data enrichment. Business analysts use Python to go beyond standard reporting and handle more complex business questions. Including Python projects highlights technical depth and adaptability.
5. Project & Requirement Collaboration:
Jira and Confluence support Agile delivery through requirement tracking, user stories, and documentation. When combined with AI-assisted features like automated summaries and workflow suggestions, they help business analysts manage projects more efficiently. Showing structured documentation from these tools strengthens portfolio credibility.
Together, these tools help business analysts plan, execute, and present business analytics projects that strengthen a modern business analyst portfolio.
10 Business Analyst Project Examples
Here are 10 portfolio-ready business analyst projects, each supported by a Mokkup dashboard example that helps demonstrate how insights are structured and prepared for final BI dashboards:
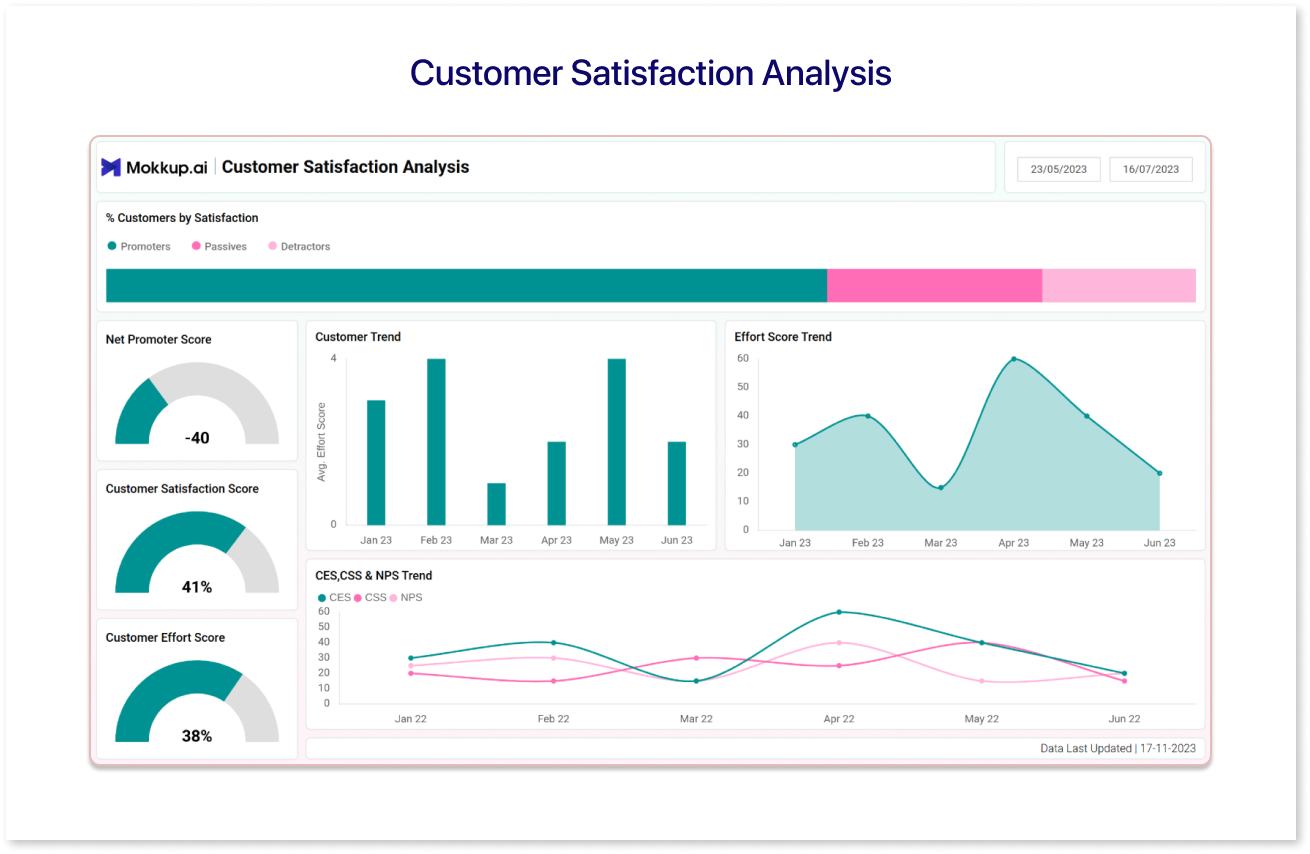
1. Customer Satisfaction Analysis: It evaluates customer satisfaction levels to improve customer service and product quality. It also improves customer service strategies and product enhancements, with higher customer retention.
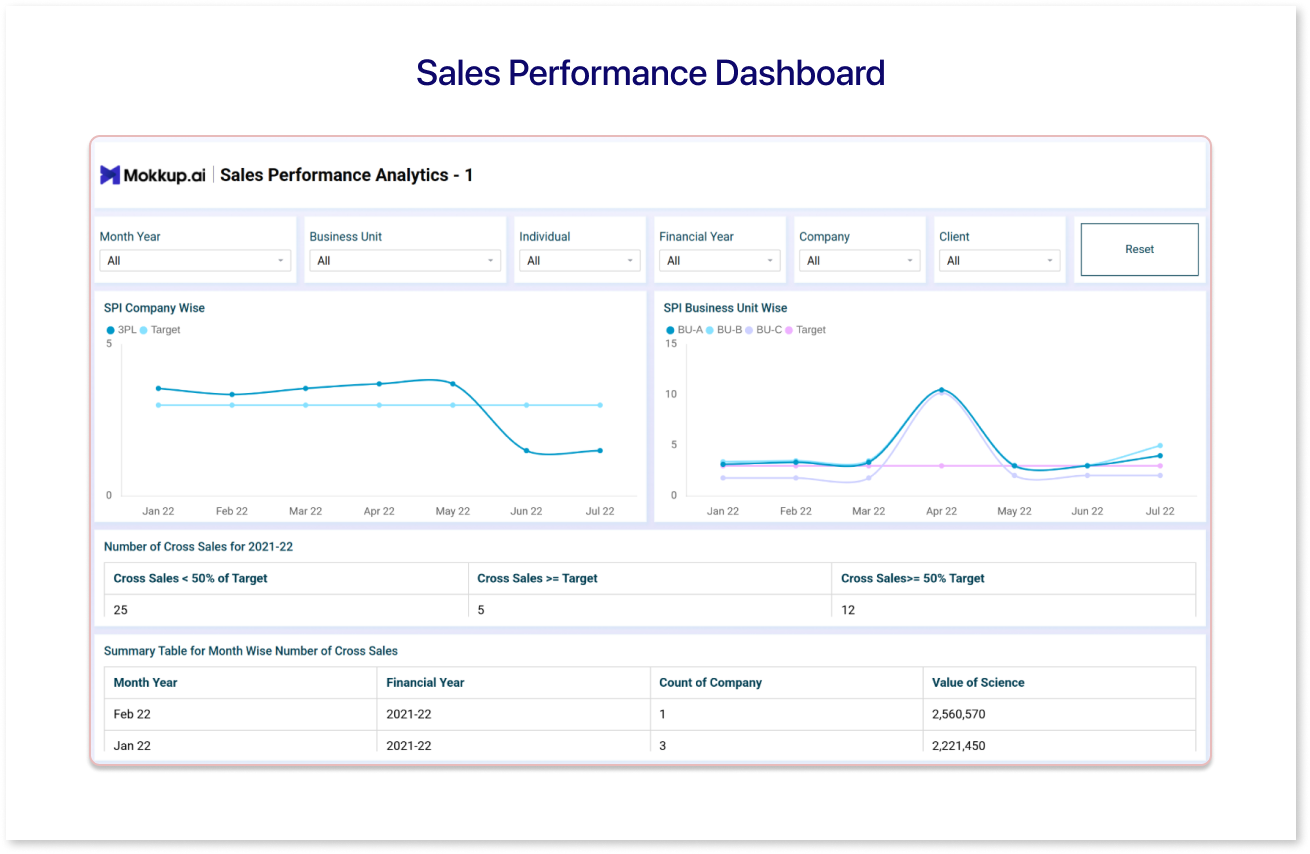
2. Sales Performance Dashboard: Monitor sales performance across regions and product lines for real-time insights. It also enhances decision-making with visualized sales trends; identifying high and low-performing areas.
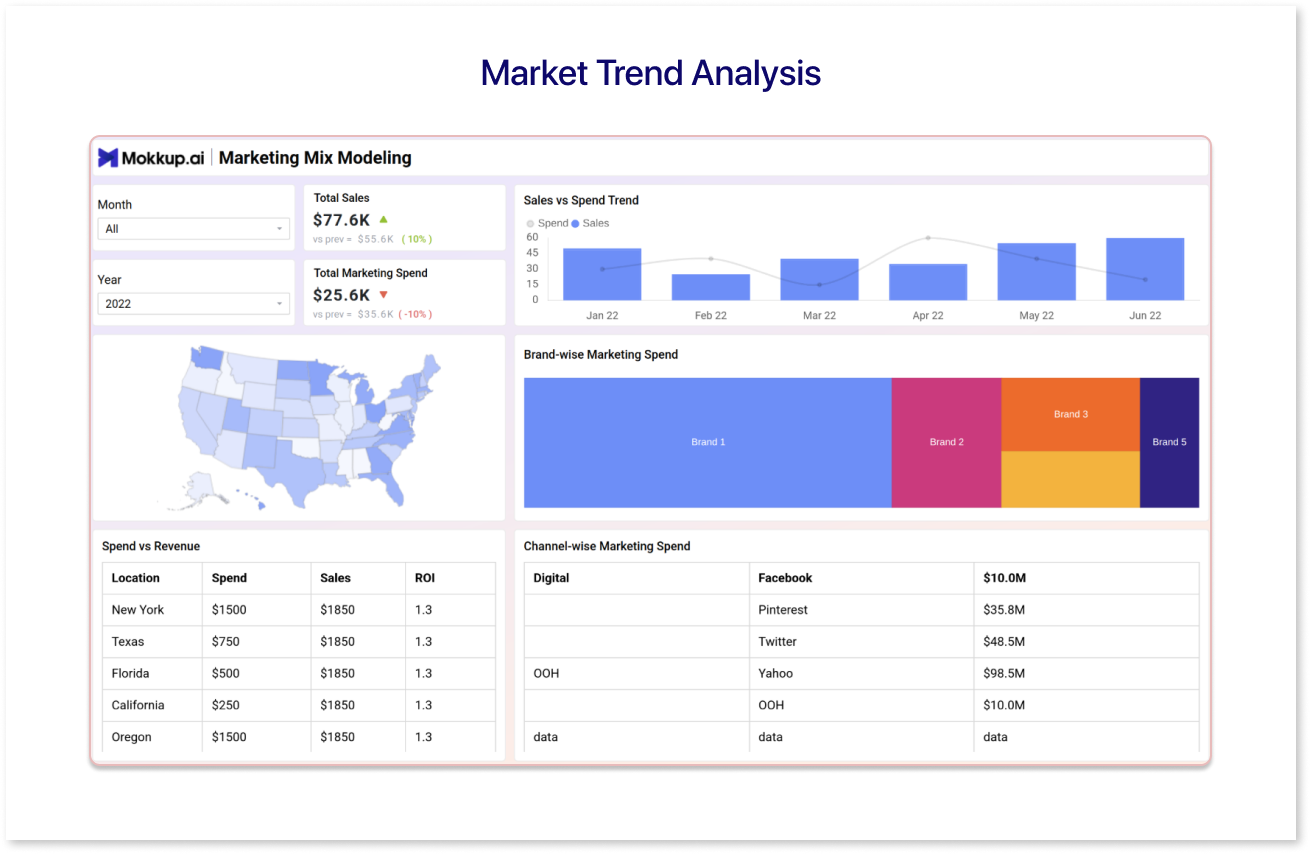
3. Market Trend Analysis: Analyzes market trends to forecast future demand and better understand market dynamics. It also means better market positioning and product strategy, as well as making informed product launch decisions.
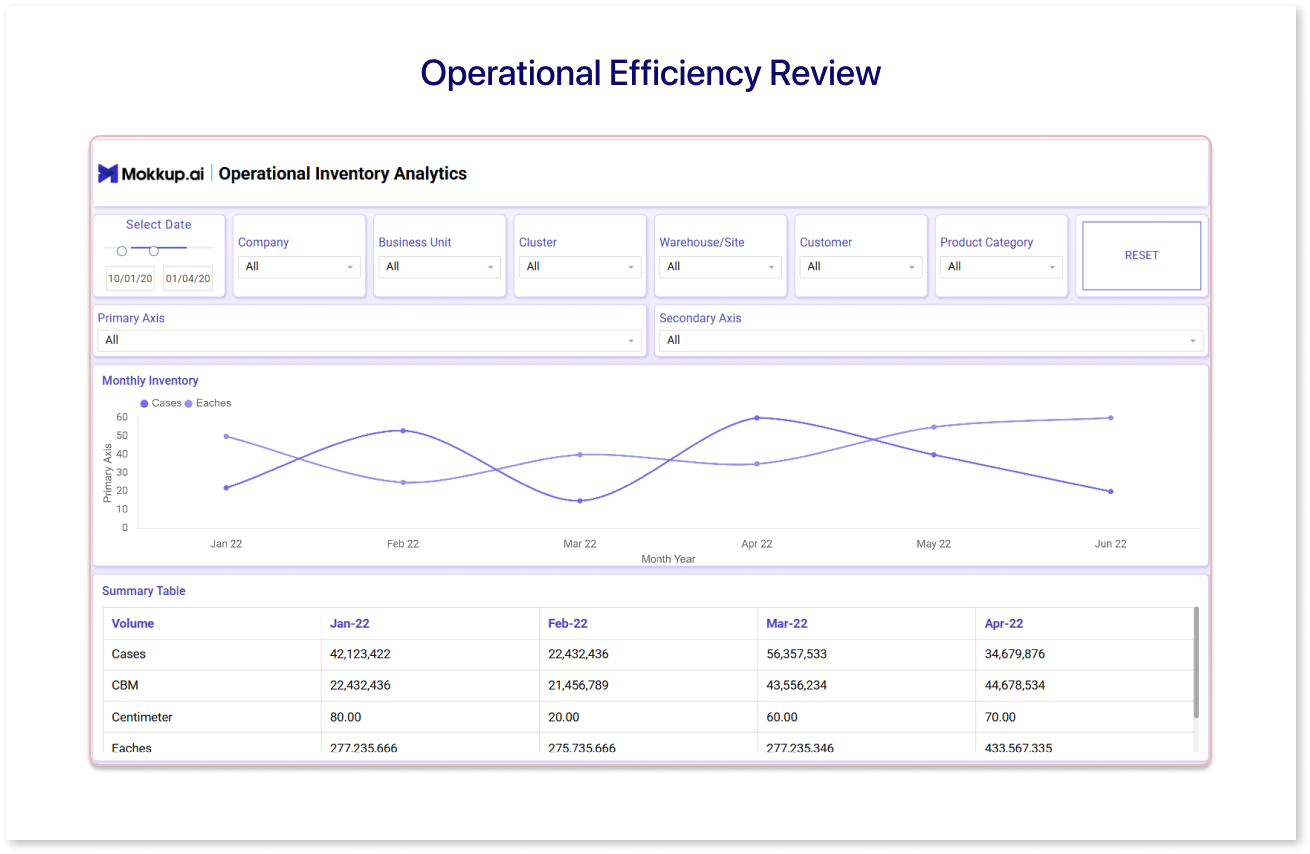
4. Operational Efficiency Review: Analyze business operations to identify bottlenecks and cut costs. It also increased efficiency and cost savings while improving process workflows.
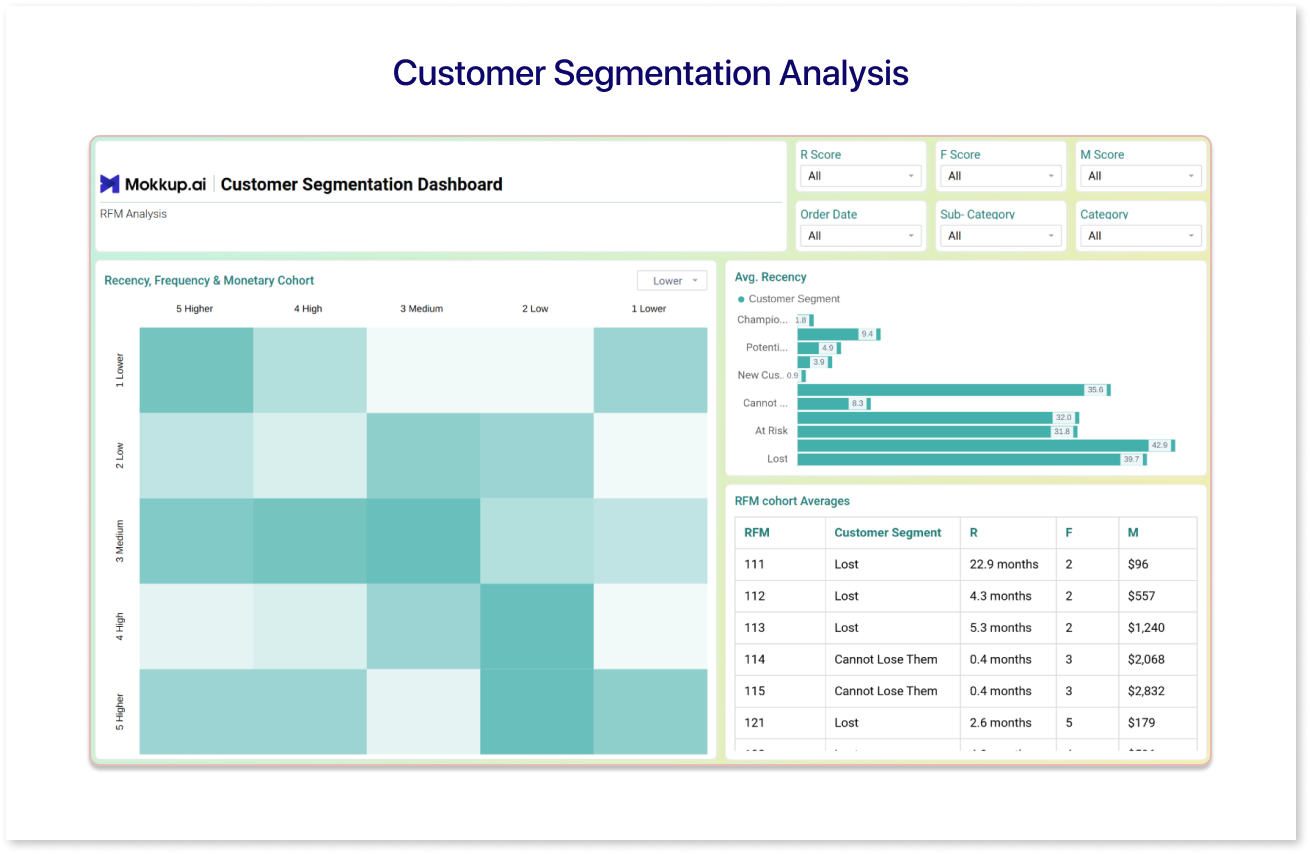
5. Customer Segmentation Analysis: Customers can be segmented based on their behavior and demographics to enable targeted marketing strategies. Additionally, more targeted marketing efforts and personalized customer experiences resulted in increased sales.
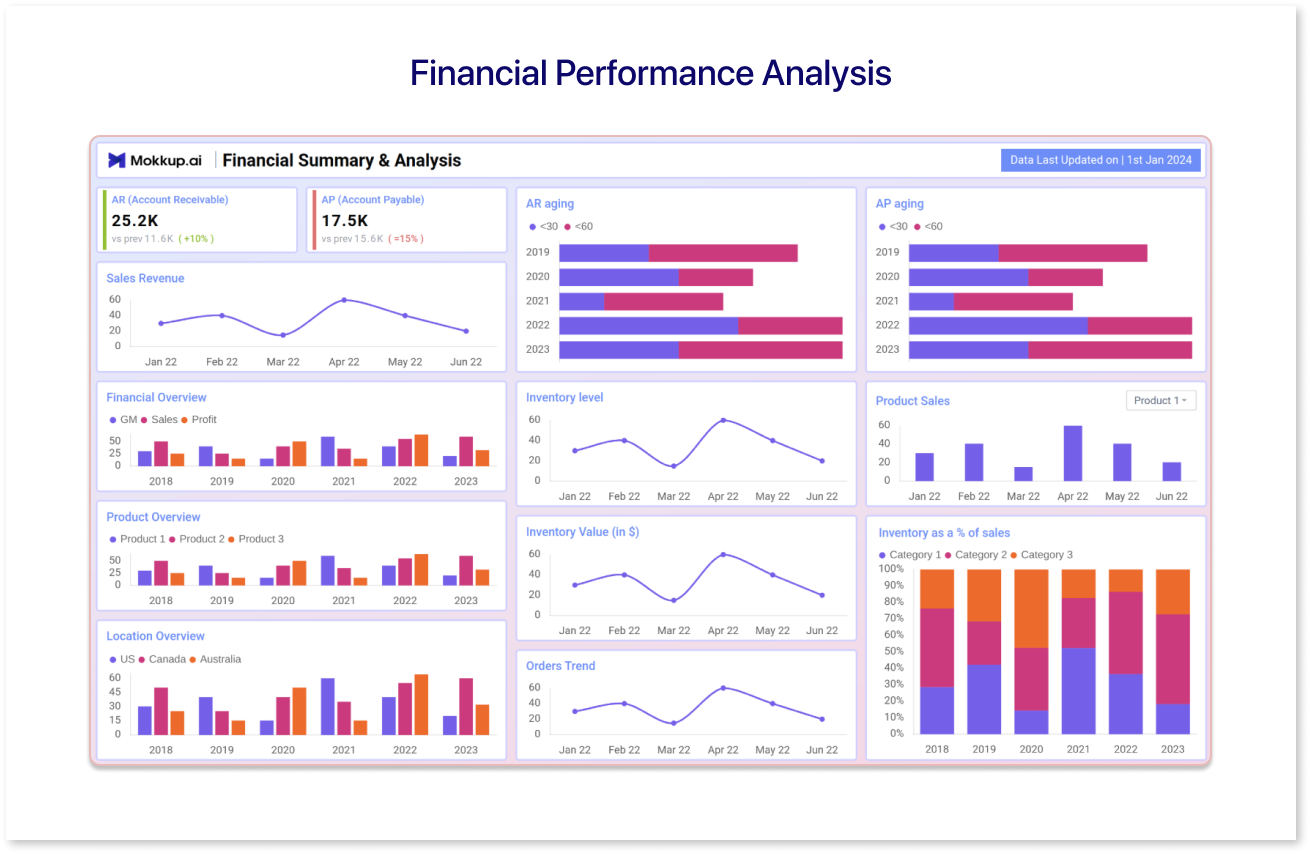
6. Financial Performance Analysis: Analyze financial performance to evaluate profitability and cost management, enhance financial planning, and improve decision-making by gaining insights into financial strengths and weaknesses.
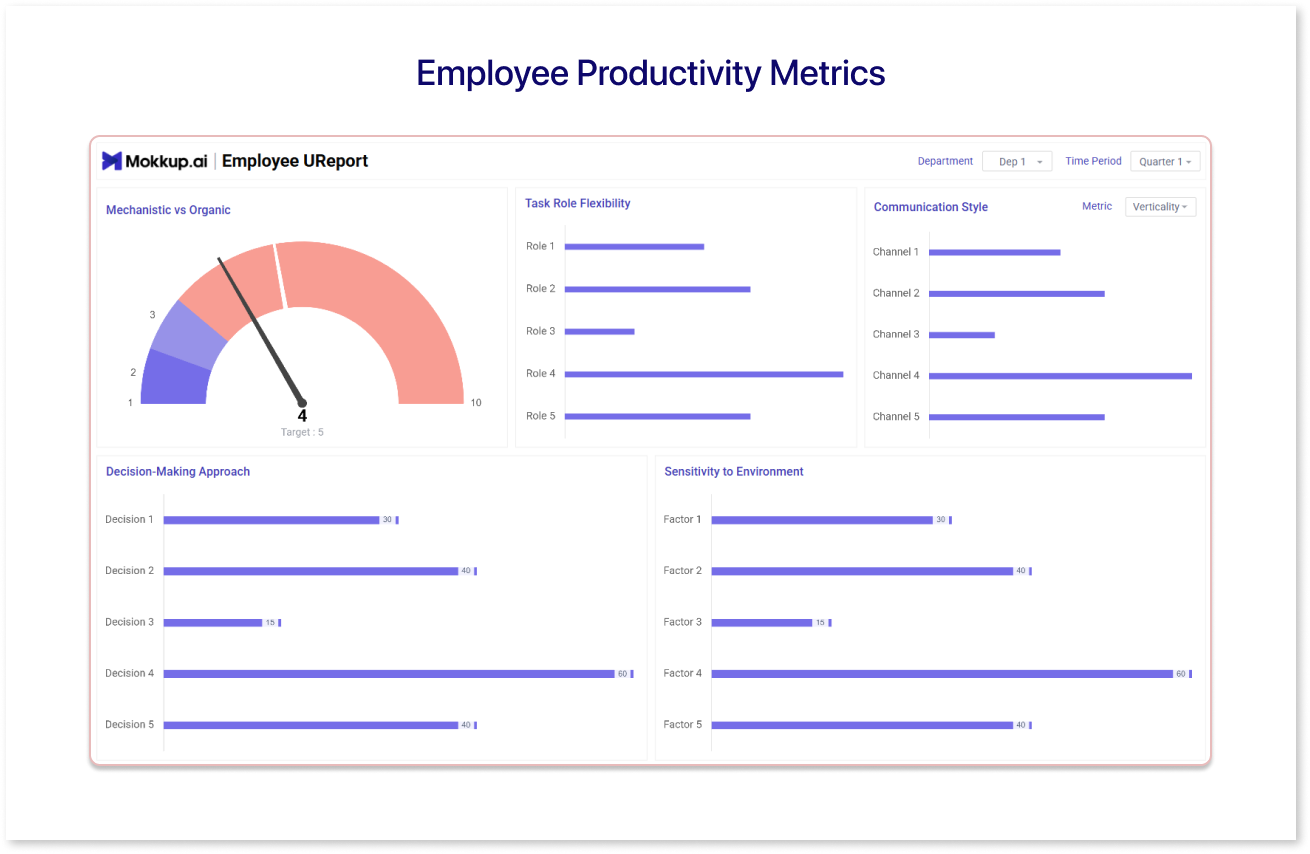
7. Employee Productivity Metrics: Monitor employee productivity to identify factors impacting performance and enhance workforce efficiency. This approach leads to increased productivity and satisfaction, as well as targeted interventions to boost performance.
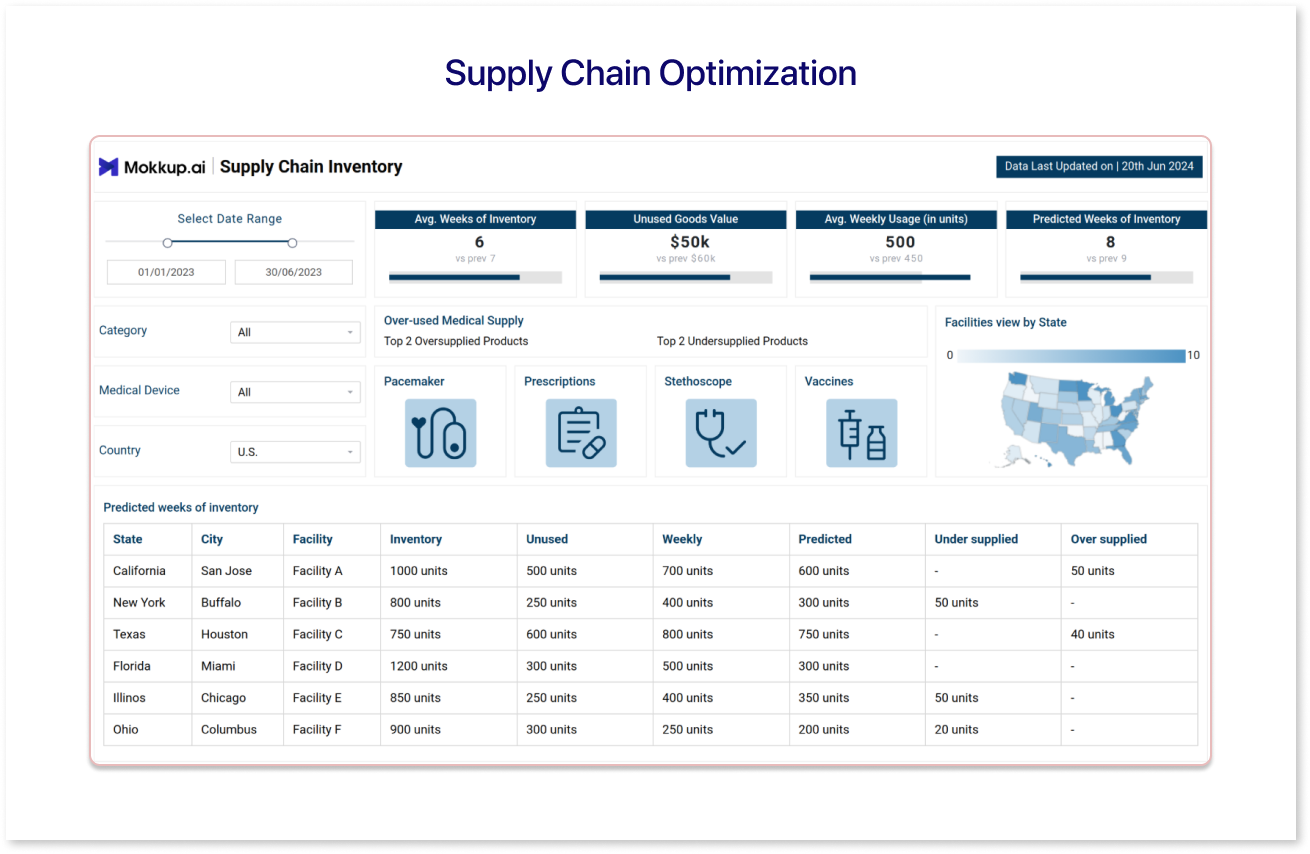
8. Supply Chain Optimization: Enhance supply chain efficiency to streamline operations, cut costs, and achieve greater reliability and significant cost reductions through optimized supply chain management.
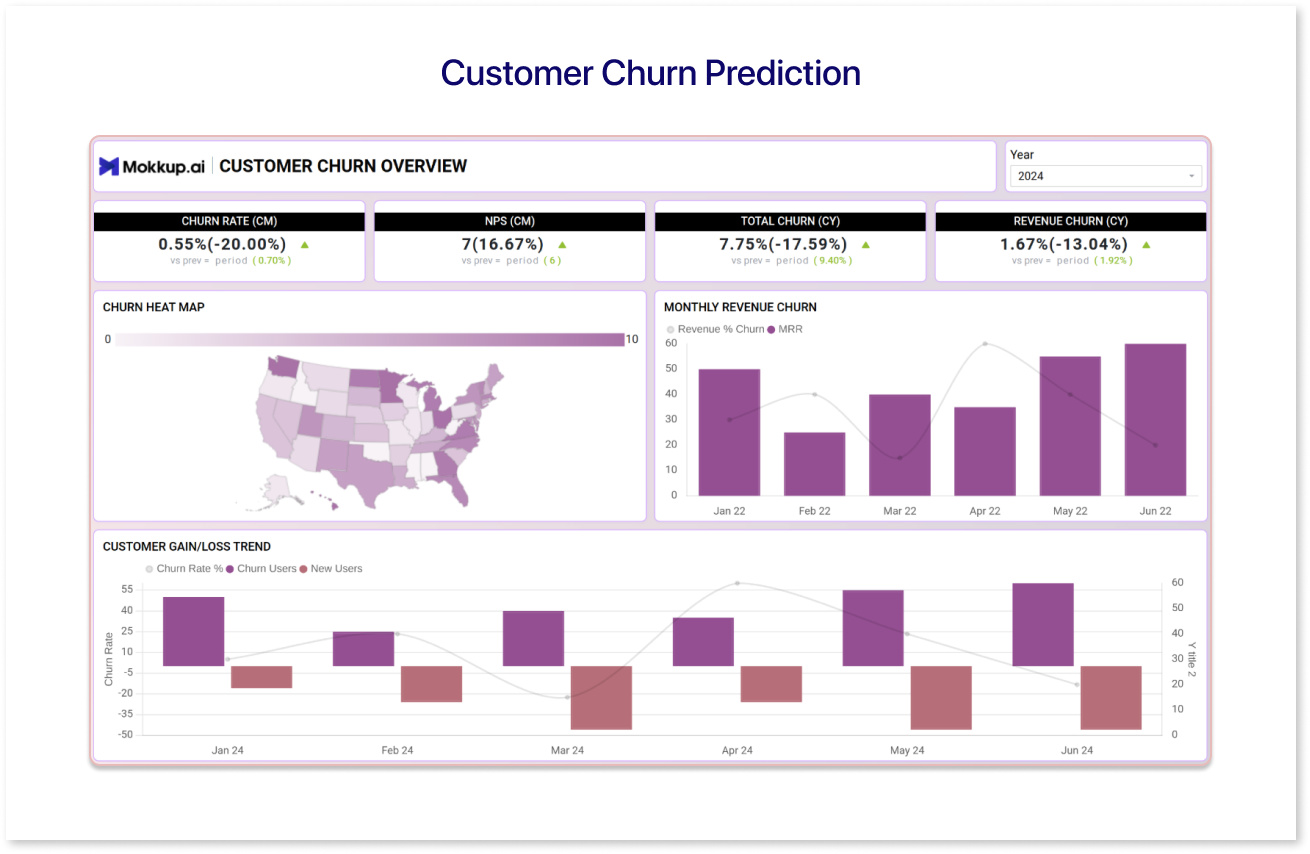
9. Customer Churn Prediction: Analyze historical data to predict customer churn by identifying patterns. This leads to reduced churn and improved retention strategies through targeted efforts to boost customer loyalty.
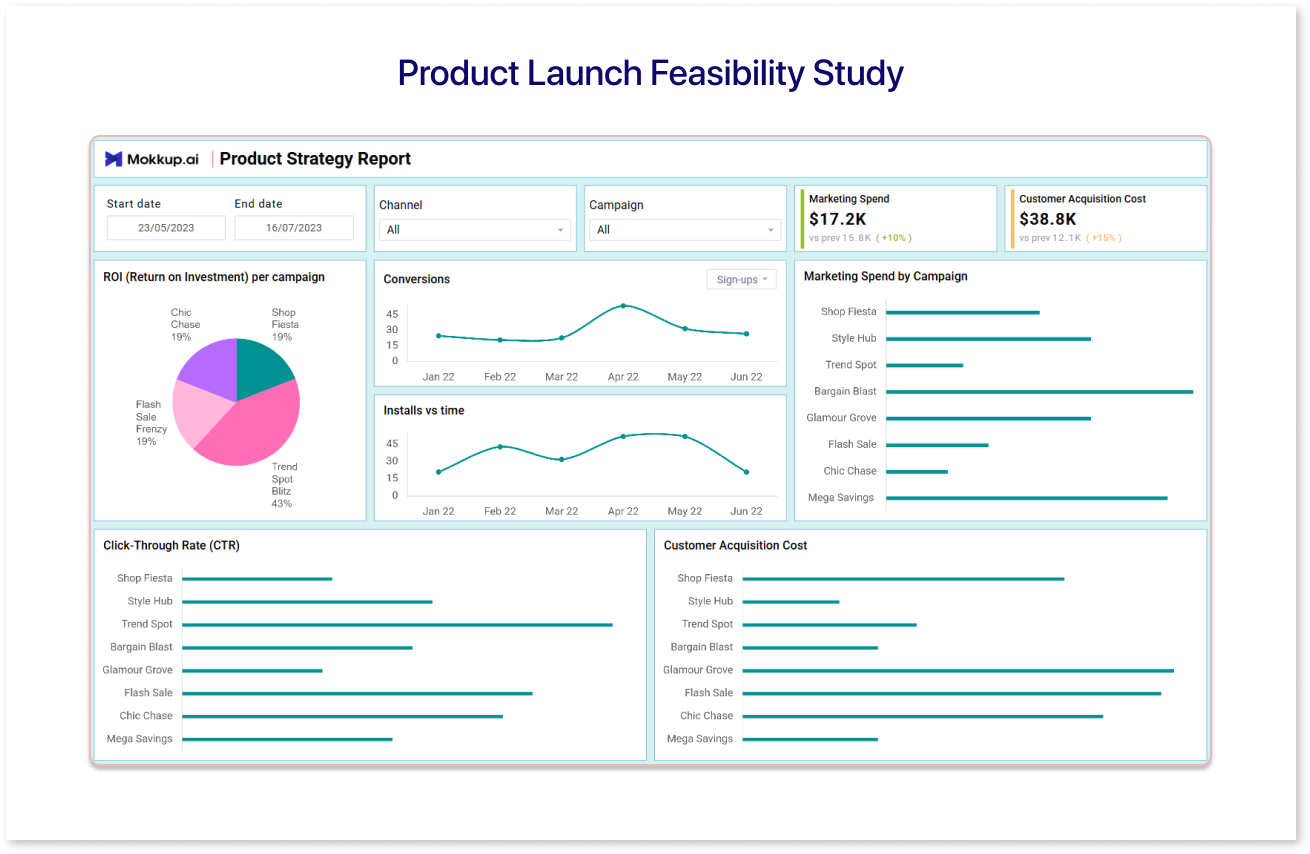
10. Product Launch Feasibility Study: Evaluate the feasibility of launching a new product by analyzing market demand and competition. This ensures informed decision-making, providing a clear understanding of market potential and associated risks.
Final Thoughts
Building a strong business analyst portfolio with well-documented business analyst projects is one of the most effective ways to stand out in today’s job market.
Remember to keep learning and honing your skills through continuous education and real-world practice. This will ensure you stay competitive and effective in the ever-evolving field of business analysis.
Frequently Asked Questions
Start by outlining your core data analysis, communication, and problem-solving skills. Include certifications (like CBAP or ECBA), your experience with tools such as Excel, SQL, Power BI, or Tableau, and a summary of projects you’ve worked on. Make sure your profile reflects both your technical expertise and business acumen.
A strong portfolio should feature case studies that outline the problem, approach, tools used, and the impact of your analysis. Include dashboards, wireframes, mock reports, data cleaning or transformation samples, and documentation showing how you gather requirements or define KPIs. Focus on demonstrating your process and outcomes.
Use Power BI or Tableau to showcase dashboards, Excel or Google Sheets for data modeling, and Mokkup.ai for creating wireframes. Platforms like GitHub or Behance work well for hosting your portfolio. These tools help demonstrate your analytical abilities and documentation skills in a clear, professional format.
Always anonymize or replace sensitive data with sample or public data. Avoid using real client names or internal documents. When possible, summarize project outcomes rather than sharing full datasets or reports. You can also create simulated projects demonstrating your skills without exposing real information.
Check platforms like Mokkup.ai, GitHub, Miro, Dribbble, and business analyst communities on LinkedIn or Reddit.
Yes, it shows your skills in action and gives recruiters a better sense of your problem-solving and communication abilities.
Aim to update your portfolio every 3–6 months or after completing a major project. Keeping it current shows your growth, helps you stay interview-ready, and makes it easier to reflect on your progress over time.
Prompt it. Wireframe it with Mokkup.ai.
