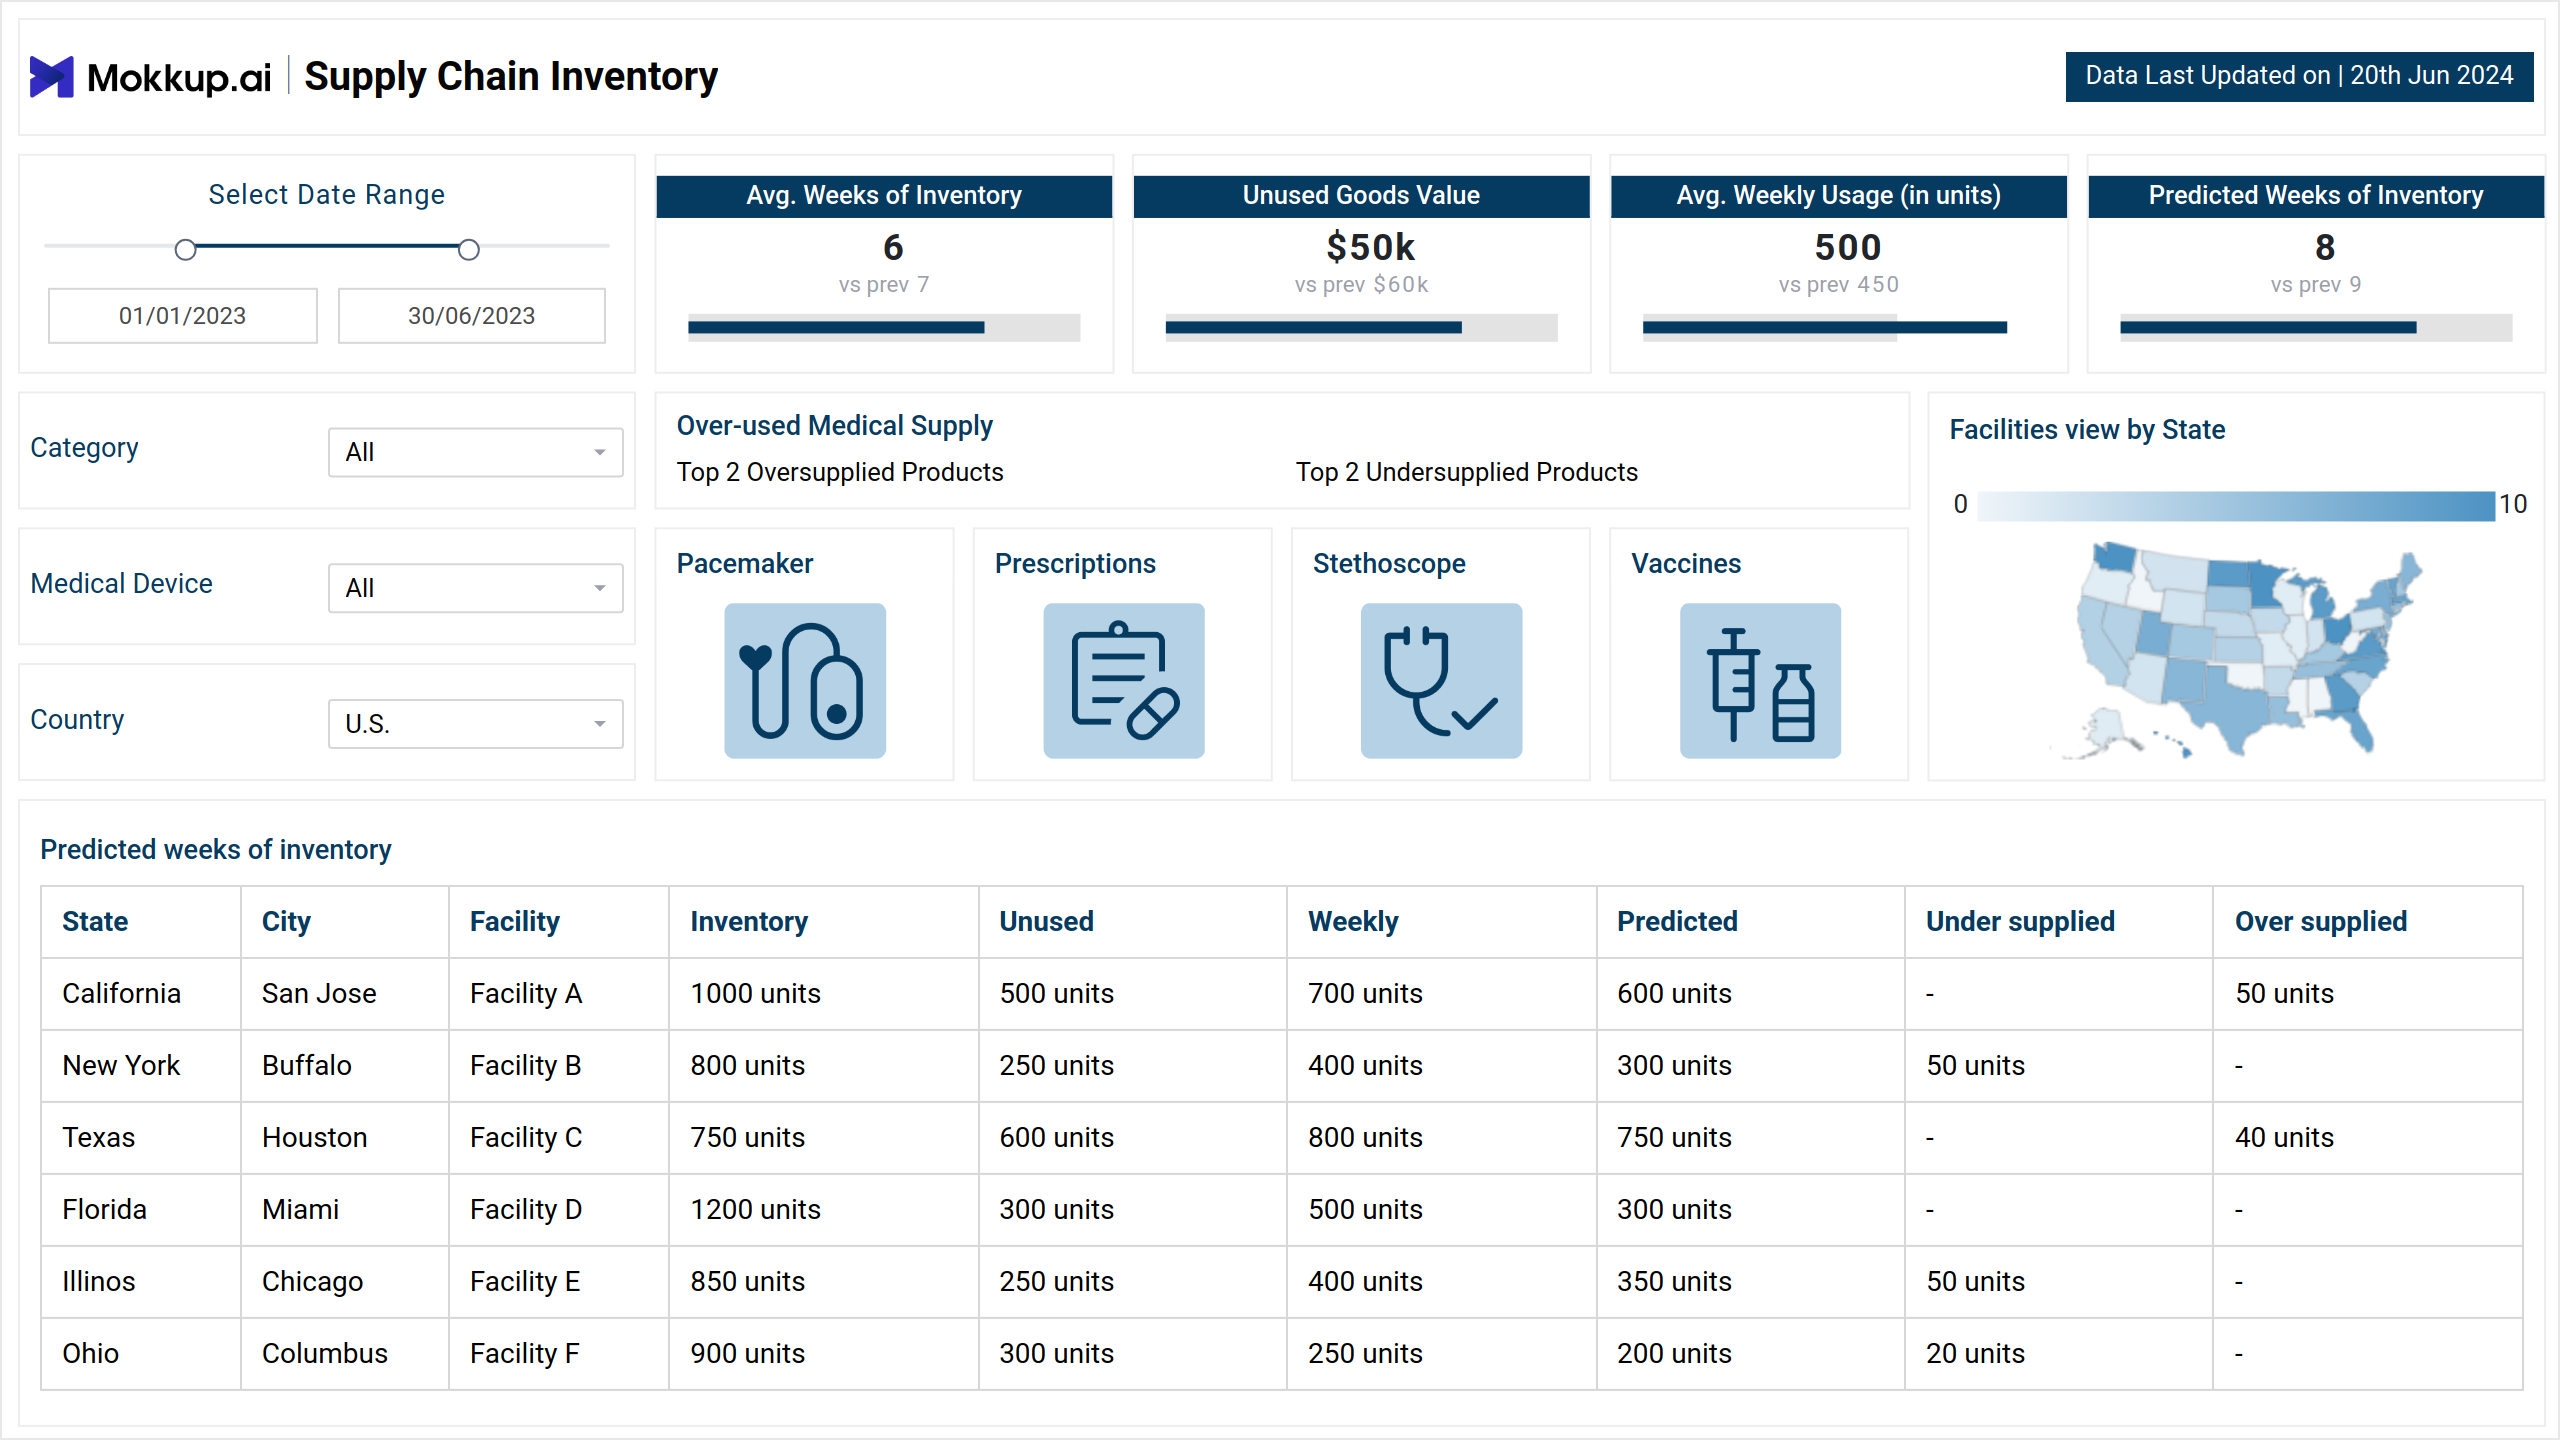
The Supply Chain Inventory dashboard template provides an overview of inventory and supply management for healthcare facilities. It focuses on key performance metrics, such as inventory efficiency, usage trends, and supply-demand alignment. This wireframe assists stakeholders in tracking oversupplied and undersupplied products, assessing inventory levels per facility, and optimizing supply chain operations to improve resource allocation and cost control.
Key Terms to Know
- Average Weeks of Inventory: The average duration (in weeks) for which current inventory levels can maintain facility operations.
- Unused Goods Value: The monetary value of inventory items that are still unused, indicating possible overstocking.
- Average Weekly Usage (in Units): This monitors the average amount of medical supplies consumed each week across facilities.
- Predicted Inventory Weeks: Uses previous usage trends to forecast how long the current stock will last.
- Overused Medical Supply: Displays the top 2 oversupplied and top 2 undersupplied goods, visually represented with images for easy identification.
- Facilities View by State: A geographic depiction of facilities by state that assists stakeholders in evaluating supply chain performance at the regional level.
- Predicted Weeks of Inventory: This provides a complete tabular view of predicted inventory durations for each product, assisting with supply chain planning.
Screen 2
The second screen of the Supply Chain Inventory dashboard wireframe focuses on the health of inventory management and operational performance. It offers insights into inventory levels, usage trends, and procurement efficiency. This screen highlights key operational alerts, supplier performance, and budget tracking to ensure smooth and cost-effective supply chain operations.
Key Terms to Know
- Inventory Health: This displays real-time inventory metrics such as the current stock, threshold limits, and the total number of items, helping monitor inventory status. It also provides a visual representation of the current inventory health, comparing stock levels against predefined thresholds.
- Usage Trends: Tracks changes in usage patterns over time, helping identify peaks, trends, and potential shortages or overstocking.
- Operational Alerts: This shows the order quantity versus back ordered items over time, highlighting any fulfillment delays or bottlenecks.
- Supplier Performance: Displays supplier metrics like on-time delivery rates and compliance levels, allowing assessment of supplier reliability and performance.
- Procurement & Budget Efficiency: A detailed view of procurement costs against budget expectations, helping track spending efficiency and identifying areas for cost savings.
Dashboard Template Insights
The dashboard wireframe offers a comprehensive view of inventory health, usage trends, supplier performance, and procurement efficiency to optimize operational decisions.
- It tracks inventory health with key KPIs and real-time alerts.
- Monitors usage trends and highlights supply discrepancies.
- Analyzes supplier performance with on-time delivery and compliance metrics.
- Measures procurement and budget efficiency with detailed tables.
Conclusion
The Supply Chain Inventory dashboard template enables stakeholders to make informed decisions by consolidating critical supply chain metrics in one place, improving efficiency and lowering operational risks.