
The Operational Inventory Analytics dashboard template provides insights into inventory management and operations. It offers a detailed analysis of inventory levels, turnover rates, stockouts, and other key performance indicators crucial for efficient warehouse management.
Operational Inventory Analytics
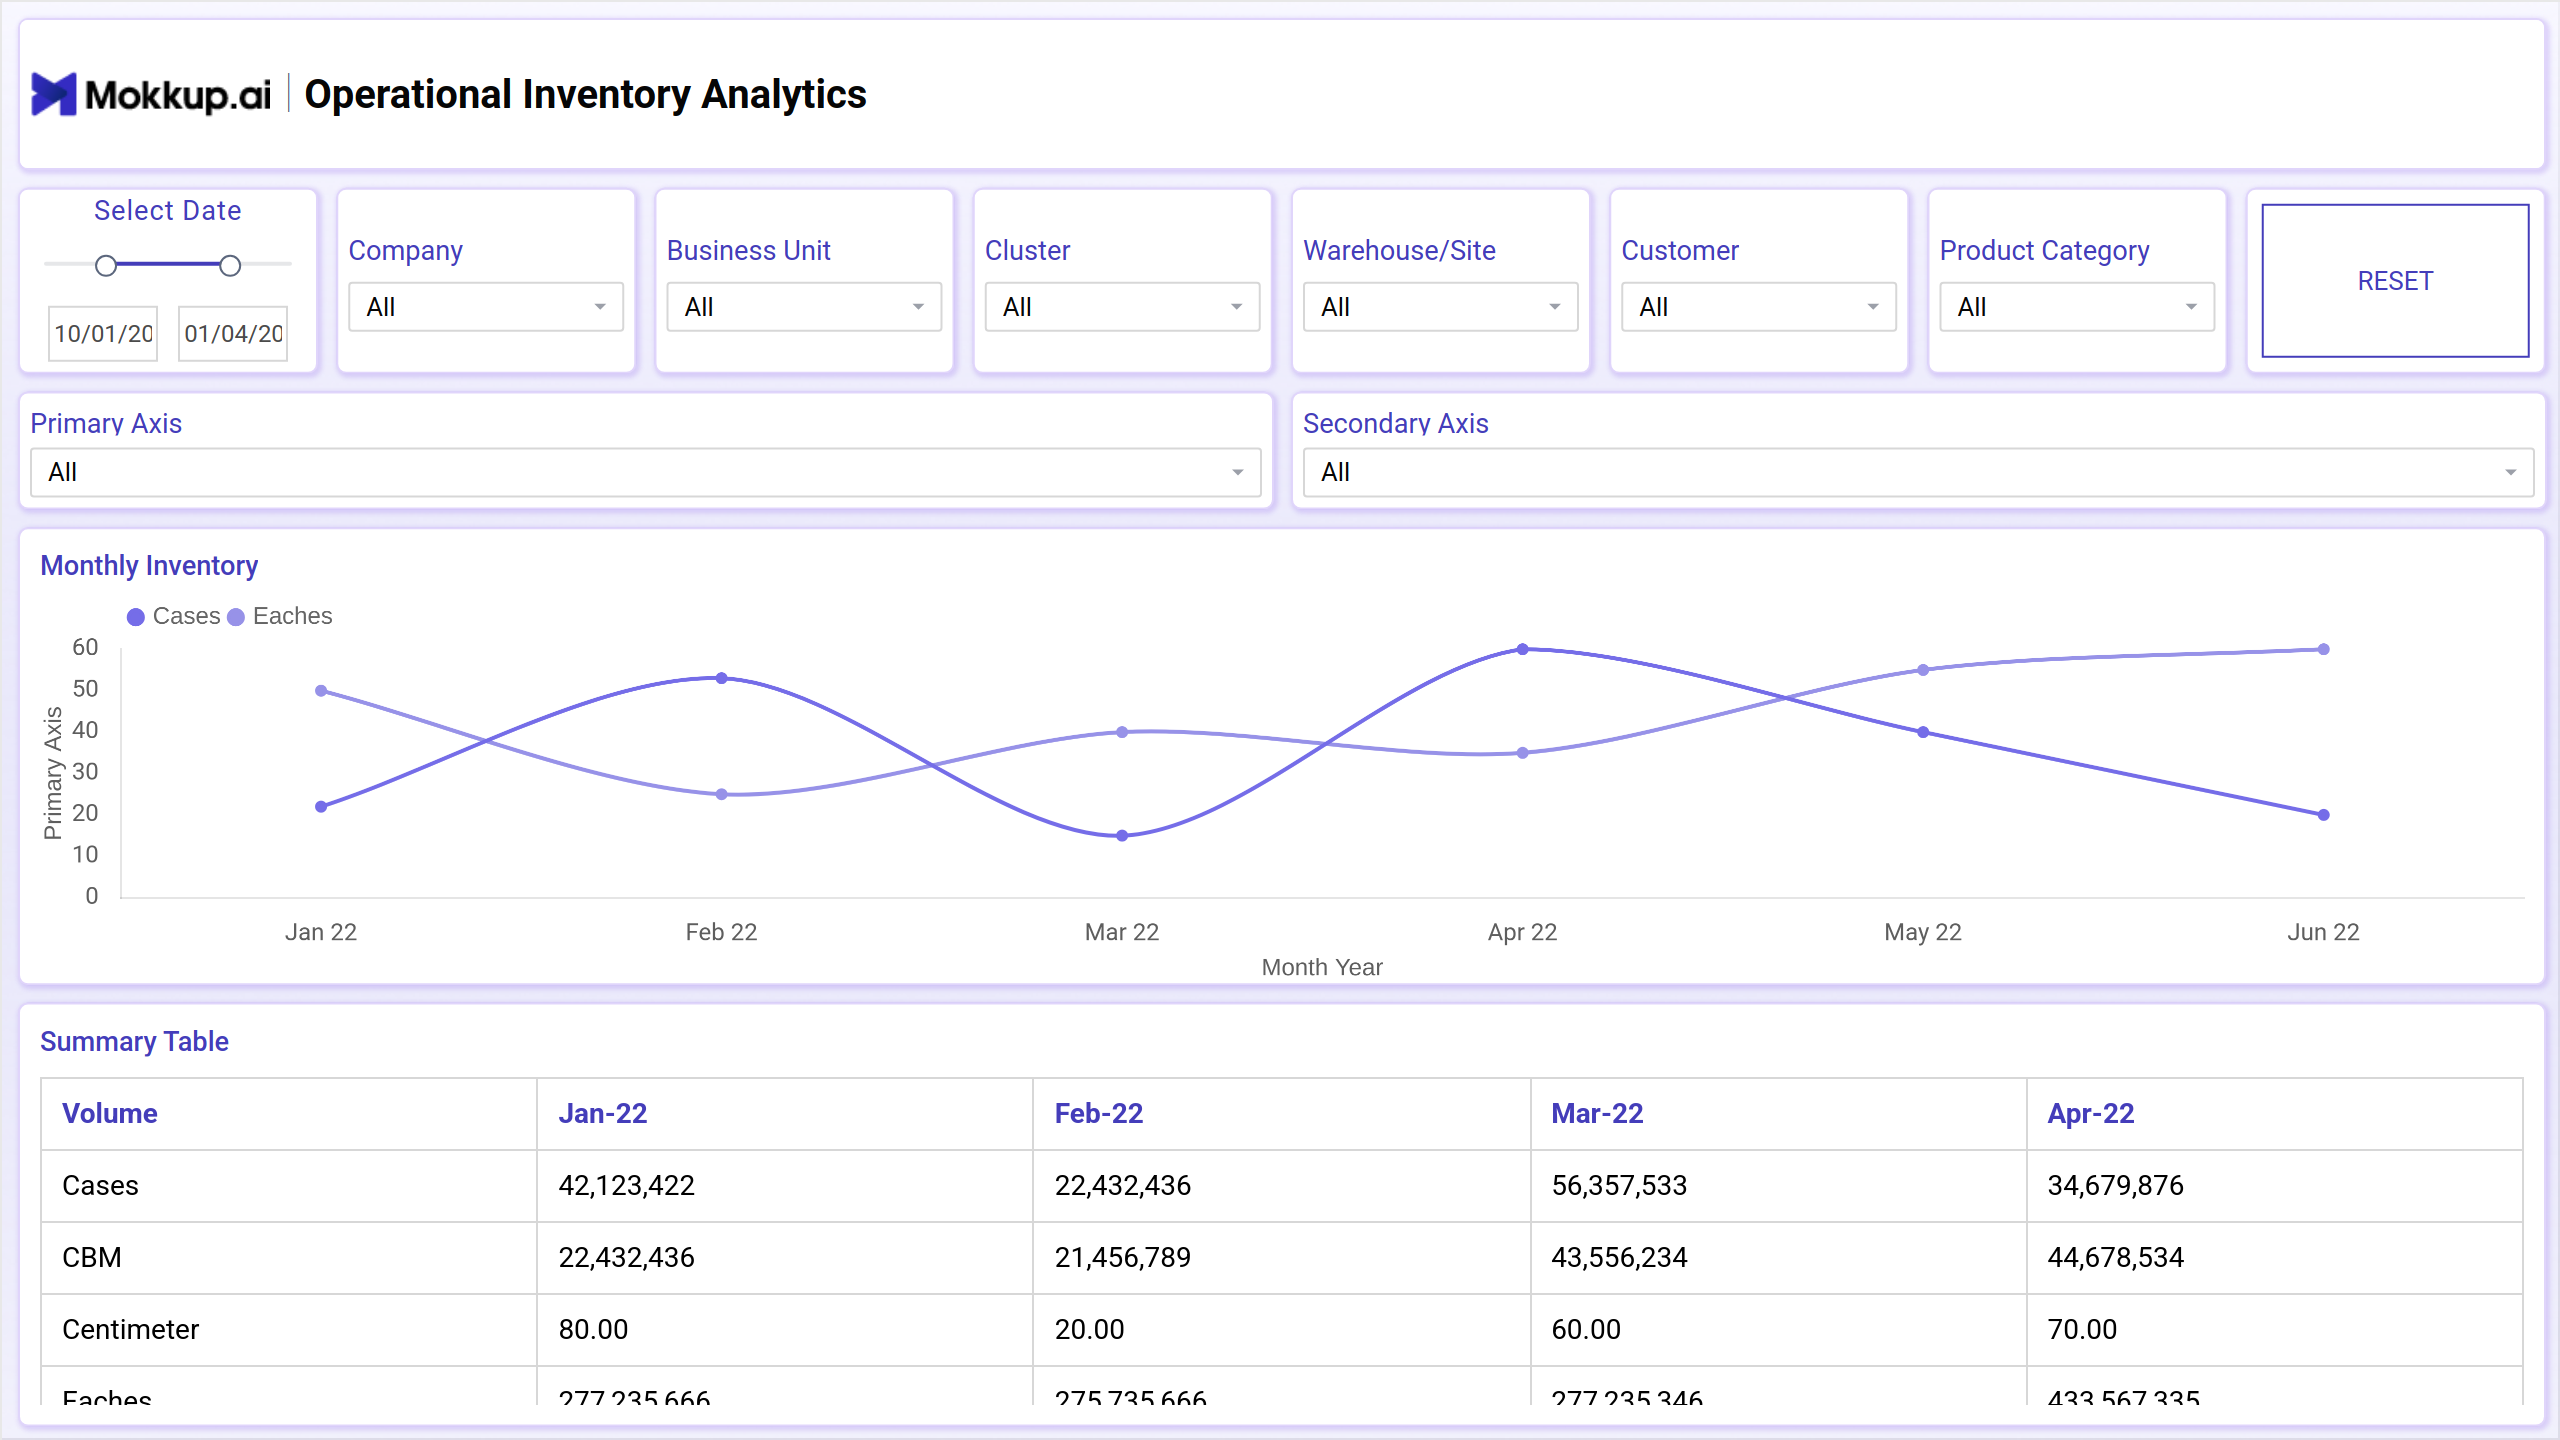
Screen 1 of the Operational Inventory Analytics dashboard wireframe offers valuable insights into monthly inventory metrics.
Key Terms to Know
- Monthly Inventory Metrics: Provides detailed insights into inventory levels measured in cases and eaches on a monthly basis, aiding in tracking inventory fluctuations and identifying trends over time.
- Summary Table: Displays volume data across different dates, offering a consolidated view of inventory levels and facilitating easy comparison and analysis.
Inbound and Outbound Volume Fluctuation
Screen 2 of the Operational Inventory Analytics dashboard wireframe delves into inbound and outbound volume fluctuations, offering insights into monthly and daily Cubic Meter (CBM) metrics.
Key Terms to Know
- Monthly and Daily CBM Metrics: Provides detailed insights into inbound and outbound volume fluctuations measured in Cubic Meters (CBM), including metrics for issuing, receiving, and throughput. aiding in monitoring inventory movement and operational efficiency on both a monthly and daily basis.
- Summary Table for CBM: Features a comprehensive summary table displaying CBM data across different dates, facilitating easy comparison and analysis of volume trends and patterns over time.
- Monthly Volume Fluctuations: Highlights monthly volume fluctuations in orders and cases, offering insights into inventory demand and enabling proactive inventory management strategies to meet customer needs efficiently.
Volume Vs Headcount Fluctuation
Screen 3 offers insights into volume versus headcount fluctuations. It provides detailed metrics related to monthly headcounts, productivity measures, overtime hours, labor costs, and workforce summaries.
Key Terms to Know
- Monthly Headcounts: Offers insights into the monthly headcounts, allowing for tracking of workforce fluctuations and resource allocation.
- Monthly Cases per Actual Man Hour: Provides visibility into productivity by showcasing the number of cases handled per actual man hour, helping in workforce optimization and performance monitoring.
- Monthly Cases and Overtime Hours: Highlights the correlation between monthly cases and overtime hours, enabling identification of workload patterns and potential areas for efficiency improvements.
- Monthly Headcounts Summary: Summarizes monthly headcounts, providing an overview of workforce trends and staffing levels over time.
- Monthly Budgeted vs Actual Labor Cost: Compares budgeted labor costs with actual labor costs on a monthly basis, facilitating cost control and budget management strategies.
This screen helps stakeholders with essential information to maximize workforce management, enhance productivity, and control labor costs effectively.
Dashboard Template Insights
The dashboard wireframe offers detailed insights into:
- The inventory levels, volume fluctuations, workforce productivity, and labor costs.
- It enables stakeholders to monitor inventory movements, optimize workforce management, and control operational costs effectively.
Conclusion
The Operational Inventory Analytics dashboard template serves as a valuable tool for enhancing inventory management and operational efficiency. By providing actionable insights into inventory levels, workforce productivity, and labor costs, it enables businesses to make informed decisions and drive continuous improvement in their operations.