The Sales Performance Analytics Dashboard template provides a comprehensive view of sales performance metrics within the logistics industry. It offers a detailed overview of key performance indicators such as the Sales Performance Index (SPI), cross-sales metrics, and various other essential indicators.
Sales Performance Analytics -1 and 2
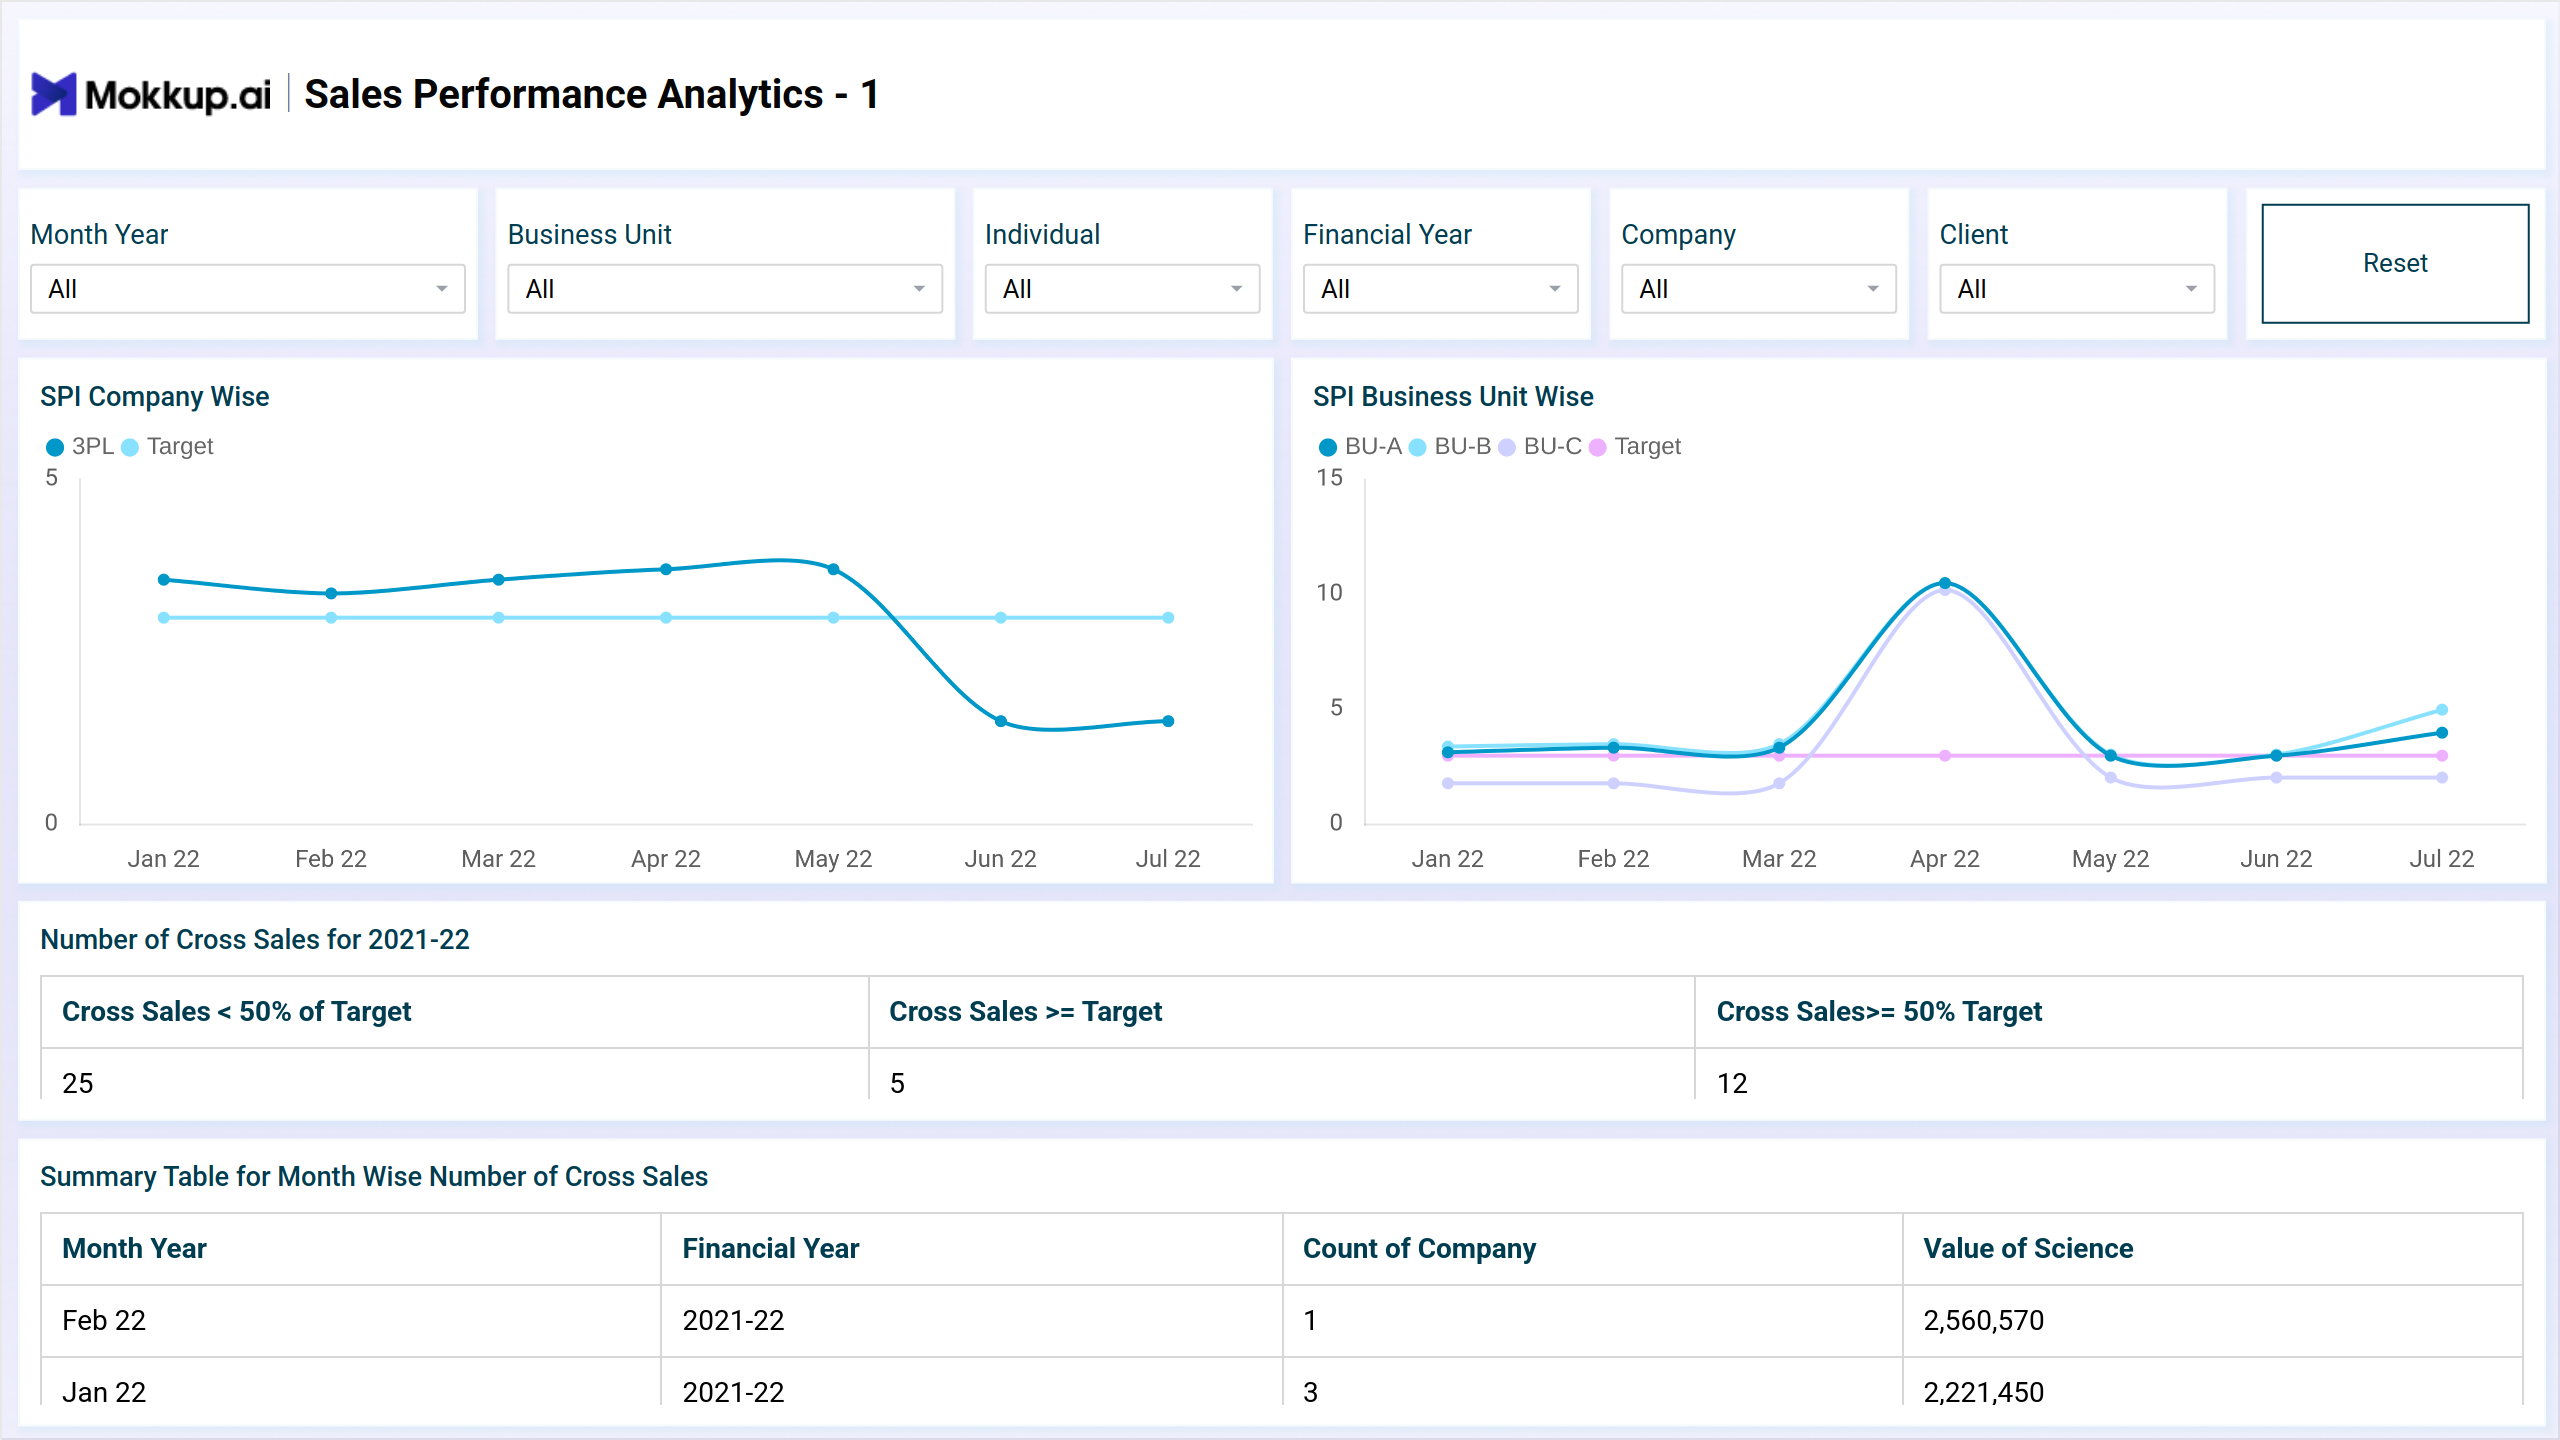
Sales Performance Analytics -1 and 2 provides valuable details about various aspects of sales performance within the logistics industry. It includes key metrics such as the Sales Performance Index (SPI) company-wise and business unit-wise, along with an analysis of cross-sales performance for the year 2021-22. These insights are essential for understanding how different segments of the organization are performing and where strategic adjustments may be needed.
Key Terms to Know
- SPI Company-wise: Provides insights into the Sales Performance Index (SPI) for each company, comparing actual sales performance against predefined targets. This metric helps in evaluating how well each company within the organization is achieving its sales goals.
- SPI Business Unit-wise: Offers a breakdown of SPI by business unit, allowing for a detailed analysis of sales performance across different segments or divisions within the organization. This granular view enables a deeper understanding of which units are excelling and which may need additional support.
- Number of Cross Sales 2021-22: This metric categorizes cross-sales performance into different brackets based on their achievement levels relative to targets:
-
Cross Sales <50% of Target: Indicates the number of cross-sales that achieved less than 50% of their targets.
-
Cross Sales >= 50% of Target: Represents cross-sales that achieved at least 50% but did not meet the full target.
-
Cross Sales >= Target: Shows the number of cross-sales that met or exceeded their targets. This breakdown helps in assessing the overall effectiveness of cross-selling strategies.
-
- Summary Table for Month-wise Cross Sales: Presents a summary table displaying cross-sales data on a monthly basis. This table facilitates trend analysis and comparison across different time periods, providing insights into seasonal patterns and monthly performance variations.
Dashboard Template Insights
The dashboard wireframe provides detailed insights to enhance sales effectiveness and identify optimization opportunities:
- Evaluation of SPI company-wise and business unit-wise provides insights into the effectiveness of sales efforts across different organizational segments. This evaluation helps in identifying high-performing companies and business units, as well as those that may require additional resources or strategic adjustments.
- Analysis of cross-sales performance offers a detailed understanding of sales achievement levels relative to targets. This analysis enables targeted interventions to improve cross-selling strategies and boost overall sales performance.
- Month-wise summary tables facilitate trend analysis and comparison, allowing stakeholders to identify patterns and opportunities for optimization over time. This month-by-month breakdown provides a clear view of how sales performance fluctuates throughout the year, helping in the planning of sales initiatives and resource allocation.
Conclusion
The Sales Performance Analytics Dashboard template is instrumental in evaluating and maximizing sales performance within the logistics industry. By providing insights into SPI metrics, cross-sales performance, and month-wise trends, it enables stakeholders to make data-driven decisions and implement targeted strategies for improving sales effectiveness and achieving organizational goals.