
When we talk about self-service, we often associate it with technology trends. But in reality, it's a mindset shift that has changed how people interact with businesses across sectors. It is about independence, convenience, and speed. Take travel as an example. Not long ago, booking a flight or checking in at the airport meant waiting in line and relying on an agent. Today, we don't think twice about opening an app to book tickets, checking in at a kiosk, or pulling up our boarding pass on our smartphone.
These are all examples of self-service, tasks that previously required human assistance but are now entirely in the customer's hands.
Table of Contents
- What Does Self-Service BI Really Mean, and Why Do We Need It?
- The Evolution of Self-Service BI Dashboards
- Market Growth and Future Outlook
- Key Trends Shaping the Future of Self-Service BI Dashboards
- Challenges and Considerations for Adoption
- The Road Ahead: Predictions and Innovations
What Does Self-Service BI Really Mean, and Why Do We Need It?
A black box is a simple way to explain a process that is not fully visible from the outside in many fields. You provide inputs and receive outputs, but the inner workings are often hidden.
Business intelligence (BI) is similar in concept. Business goals and raw data are entered, and decisions and insights are derived. However, business users are frequently unaware of what happens inside, such as data collection, preparation, analysis, and reporting.
Self-service BI seeks to open up that black box. Instead of relying solely on data teams to handle every request, it provides tools for business users to explore data, create reports, and answer questions directly.
Why does this matter? Because it solves two significant problems.
- Bottlenecks: Business users no longer need to wait in line for routine reports from analysts.
- Scalability: By eliminating repetitive tasks, data teams can focus on more complex, high-value evaluations.
In essence, self-service BI makes the process more transparent and accessible, allowing users to gain faster insights while reducing the burden on service providers.
The Evolution of Self-Service BI Dashboards
In traditional BI setups, business users depended primarily on data teams. Business users understood their goals but lacked the technical knowledge to access data, whereas analysts had the technical skills but not always the business context. This required every request to go through a round of back-and-forth communication. As organizations expanded, this process became increasingly inefficient:
- Data teams were flooded with repetitive, low-value requests.
- Business users become dissatisfied with delays and inadequate responses.
The Turning Point:
It became evident that better coordination was not the solution; the dependency itself was the issue. As Jeff Bezos famously stated at Amazon, scalability is not about enhancing communication, but about removing unneeded communication entirely. Applying this approach to BI demonstrated that old workflows could not keep up with the pace and scale that modern enterprises required.
The Solution:
The answer was self-service business intelligence (BI). Routine requests were no longer burdened on data teams by providing business users with tools that were easily managed independently. This shift enabled:
- Faster Insights: Business users might answer their own daily queries.
- Smarter Resource Allocation: Enables analysts to focus on advanced, high-value analysis.
- Scalability: The BI process could keep up with expanding data demands without incurring additional costs.
It's important to remember that efficiency, not data democracy, was the original driving force behind self-service BI. Organizations could put insights directly in the hands of decision-makers by lowering their reliance on service providers and spreading part of the effort.
Market Growth and Future Outlook
The emergence of self-service BI reflects a larger trend in how businesses approach data, prioritizing speed, simplicity, and less reliance on technical teams. As businesses want faster insights and more user-friendly tools, self-service BI has emerged as a critical enabler of data-driven decision making. Cloud adoption and developments in user-friendly interfaces contribute to this trend, making BI more accessible to all levels of a business and shaping the business intelligence future.
According to Future Market Insights, the self-service BI market would increase at a 15.4% CAGR from $13.1 billion in 2025 to $54.9 billion in 2035. This rise emphasizes the growing necessity of enabling non-technical users to explore and act on data freely, while providers continue to improve solutions that balance usability, governance, and security.
Key Trends Shaping the Future of Self-Service BI Dashboards in 2025
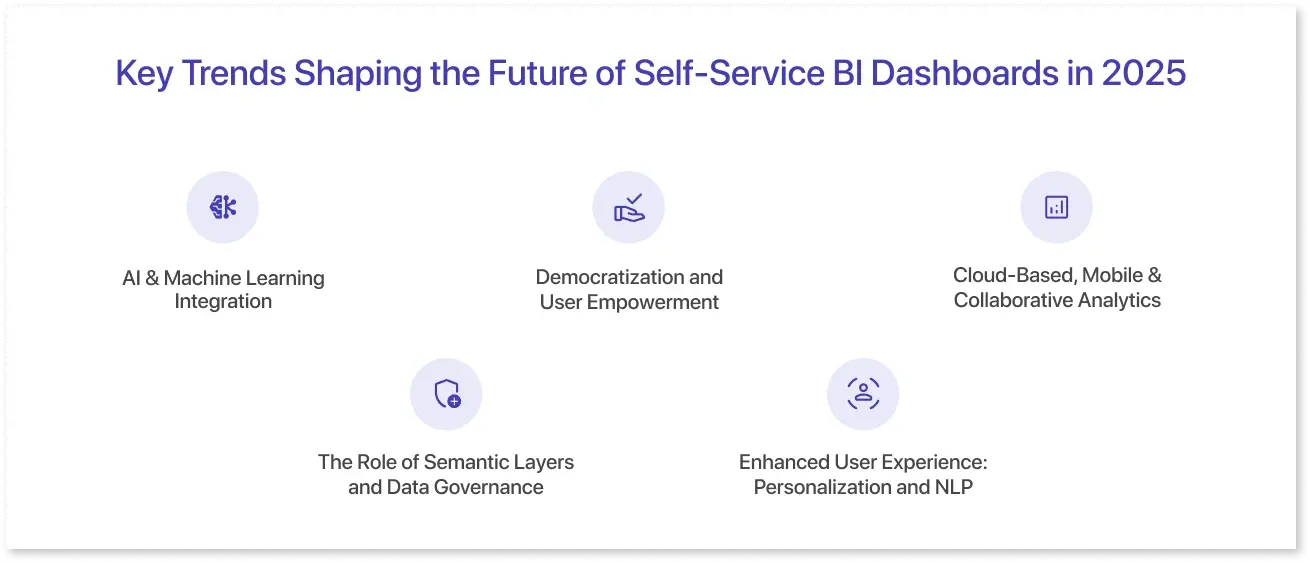
As businesses generate more data and decision-making speeds up, self-service BI tools are evolving rapidly. Dashboards are no longer just static charts; they’re becoming smarter, easier to use, and more reliable. Here are the significant BI trends shaping their future:
1. AI & Machine Learning Integration:
- Natural Language & Conversational BI: Users can now ask questions in simple language rather than writing queries. For example, wireframing tools like Mokkup.ai also let users generate dashboard wireframes from a prompt, which can then be exported directly into BI tools like Tableau or Power BI, speeding up dashboard creation.
- Proactive Insights: Dashboards are increasingly detecting patterns and anomalies automatically. For example, they may signal unexpected sales reductions in a region, identify underperforming items, or offer potential explanations, allowing businesses to respond more quickly.
2. Democratization and User Empowerment:
- Simplified Access: BI tools are designed for business users, letting them explore data independently without thorough technical knowledge.
- Encouraging Experimentation: Companies often provide sandbox dashboards so teams can try out analyses safely, promoting a self-serve culture and improving data literacy.
3. Cloud-Based, Mobile & Collaborative Analytics:
- Remote Access & Collaboration: Cloud-hosted dashboards allow multiple users to view, interact with, and share real-time insights, supporting remote teams.
- Mobile Optimization: Dashboards are increasingly designed for mobile devices, letting decision-makers access key insights on the go.
4. The Role of Semantic Layers and Data Governance:
- Consistency Through Semantic Layers: Semantic layers ensure that all users interpret metrics similarly, reducing confusion caused by varying definitions of terms such as "revenue" or "customer."
- Governance & Security: To maintain trust and compliance, organizations have implemented stronger regulations for data access, metadata management, and usage audits.
5. Enhanced User Experience: Personalization and NLP:
- Customized Dashboards: Dashboards are tailored to each user's role and preferences, eliminating clutter and focusing on key indicators.
- Conversational Interaction: Using natural language queries, users can examine data by asking simple back-and-forth questions.
As self-service BI dashboards expand, businesses can expect more innovative, intuitive, and personalized tools that help users explore data independently. Staying ahead requires embracing these trends to turn insights into faster, more confident decisions.
Challenges and Considerations for Adoption
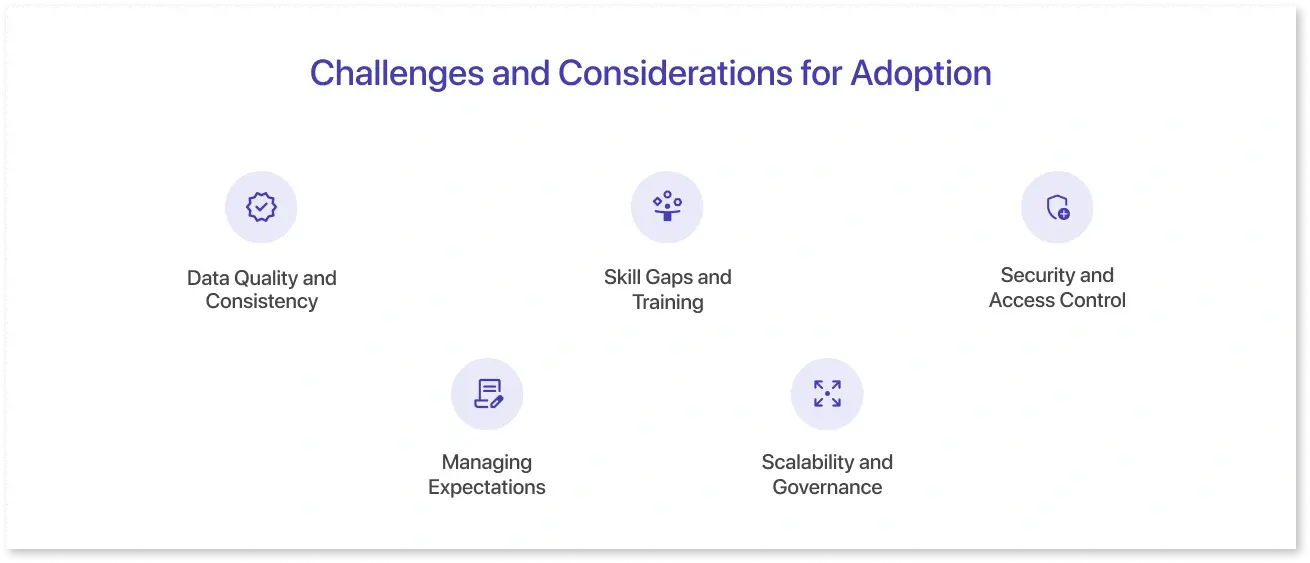
Self-service BI dashboards promise quicker insights, increased autonomy for business users, and less reliance on data teams. However, implementing them is not as straightforward as flipping a switch. Careful attention to self-service dashboard design, from data accuracy to user experience, is critical to success. Organizations must carefully plan data quality, user readiness, governance, and scalability to prevent frequent errors. It's also critical to balance allowing users to examine data independently while keeping oversight to ensure accuracy, security, and consistent metric interpretation.
Even the most powerful dashboards can be confusing, misinterpreted, or underutilized if these factors are not addressed beforehand.
1. Data Quality and Consistency:
Dashboards are only as reliable as the data they represent. Inconsistent, incomplete, or outdated data can lead to false insights; therefore, effective governance and validation are required before introducing dashboards widely.
2. Skill Gaps and Training:
Even user-friendly dashboards require some data literacy. Investing in training, documentation, and continuous support helps users interpret measurements accurately and make informed choices.
3. Security and Access Control:
As more employees access dashboards, securing sensitive information becomes increasingly important. Role-based access, authentication, and auditing policies ensure data is used safely and ethically.
4. Managing Expectations:
Self-service BI helps people, but it does not fully replace analytical knowledge. Setting reasonable expectations for what dashboards can and cannot accomplish helps to avoid frustration and misinterpretation.
5. Scalability and Governance:
Maintaining consistent definitions, metrics, and standards becomes more difficult as adoption increases. Implementing semantic layers, standardized templates, and clear governance structures ensures that dashboards scale efficiently while maintaining data trust.
By overcoming these challenges, organizations can realize the value of self-service BI: quick, dependable insights without losing data quality, security, or trust.
The Road Ahead: Predictions and Innovations
The future of self-service BI dashboards appears promising as technology makes them more intelligent and accessible. As businesses generate more data, the demand for solutions that can quickly convert raw numbers into insights will increase, defining much of the business intelligence future.
We should expect dashboards to become more automated, with AI highlighting patterns before consumers ask questions. Personalization will also play a larger role, with insights tailored to each user's role and demands. At the same time, dashboards will evolve into collaborative spaces where teams can explore data together rather than working in silos.
Self-service BI is no longer only about "creating charts." It's about developing better systems that enable firms to move faster and remain competitive in a data-driven environment.
Conclusion
Self-service BI dashboards are evolving from static reporting tools to dynamic, intelligent decision-support systems. As AI, personalization, and collaboration redefine the landscape, firms that embrace these developments will be better positioned to realize the full value of their data.
The future of self-service dashboard design will combine simplicity with intelligence, ensuring that business users get insights faster without sacrificing accuracy or governance.
Frequently Asked Questions
A self-service BI dashboard allows business users to explore, analyze, and visualize data without relying on IT professionals. It enables users to generate reports, track KPIs, and gain insights using interactive charts and filters.
BI dashboards are transitioning from static reporting to intelligent platforms. They now use AI, natural language queries, and automation to deliver proactive insights rather than simply displaying stats. This progress makes dashboards smarter, faster, and more usable for non-technical users.
Next-gen BI dashboards include AI-driven insights, personalization, natural language processing (NLP), real-time collaboration, and cloud-based access. Some even allow users to interact with dashboards conversationally, asking inquiries such as "show me sales by region" and receiving fast visual results.
Not exactly. Self-service dashboards enable business users, but IT-managed BI will remain critical for governance, data security, and managing complicated data pipelines. The future will be a hybrid paradigm in which IT provides reliable data sources while people explore insights freely.
By 2025, expect dashboards to be more automated, personalized, and collaborative. AI will highlight anomalies before users notice them, semantic layers will improve trust in data, and mobile-first designs will make insights available anytime, anywhere. The focus will be on speed, usability, and enhanced decision-making.
Prompt it. Wireframe it with Mokkup.ai.
