Introduction to BI Dashboards
Business Intelligence (BI) dashboards have become central to organizations' understanding of performance, monitoring KPIs, and guiding strategic decisions. Whether a sales team checks quarterly targets or HR tracks engagement metrics, dashboards help turn raw data into clear, visual insights.
But dashboards can't stay static with the explosion of data sources, more remote teams, and rising expectations for speed and clarity. Businesses are no longer satisfied with dashboards that simply show what’s happening; they want tools that tell them why it’s happening and what to do next. That’s where the future of BI is headed: more intelligent, contextual, and connected to everyday decision-making.
Table of Contents
- Trends to Watch in 2025
- How to Prepare Your Business?
- Challenges Companies Face with BI Modernization
- The Shift Toward Self-Service BI
- Rise of No-Code Dashboard Tools
- Role of AI in Dashboard Design and Insights
Trends to Watch in 2025
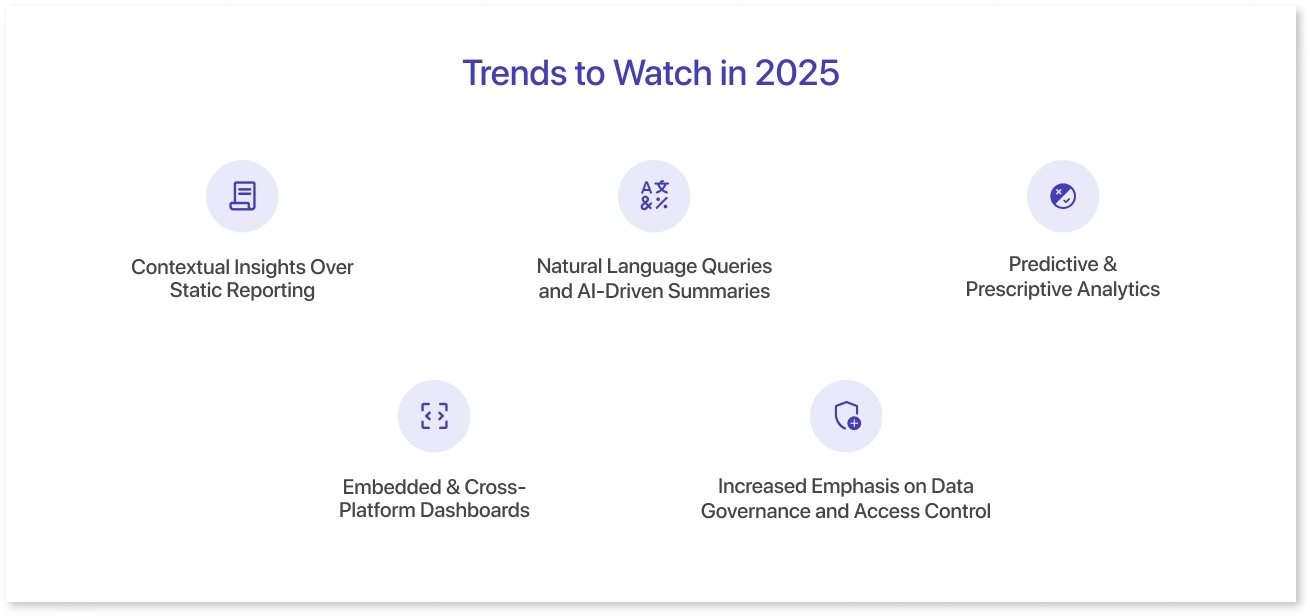
The business intelligence dashboard landscape is evolving fast. As we look toward the future of business intelligence, here are some of the significant shifts businesses can expect in 2025:
1. Contextual Insights Over Static Reporting
Dashboards are moving beyond static visuals. Instead of just showing a chart, modern BI tools now add context, explaining why a metric is dropping, what influenced a spike, or which team needs attention. Analytics are everywhere, except where you need them most. Based on insights from 536 data professionals, this new report reveals the hidden costs of digital friction and the growing urgency for embedded, AI-powered solutions. See why 2025 is a turning point for developers, product teams, and data leaders alike
2. Natural Language Queries and AI-Driven Summaries
With GenAI, users no longer need to know the technical terms to access data. They can simply type questions like “Why did sales dip last month?” and get instant summaries or visual responses. This reduces the learning curve and speeds up insight gathering across teams.
3. Predictive & Prescriptive Analytics
While predictive metrics aren’t new, their accuracy and usability are improving. BI dashboards will forecast outcomes and recommend actions, helping leaders proactively manage operations, budgets, and people.
4. Embedded & Cross-Platform Dashboards
In 2025, expect dashboards to show up where users already work, such as Slack, email, CRM tools, or internal portals. Instead of logging into a separate BI platform, dashboards will become part of daily workflows.
5. Increased Emphasis on Data Governance and Access Control
As data democratization grows, so does the need to manage who sees what. Expect more advanced role-based permissions, workspace-level controls, and audit trails to become standard in BI platforms.
How to Prepare Your Business?
Modernizing your BI dashboards isn’t just about adopting the latest tech; it’s about aligning tools with how your team works and staying ahead of key BI industry trends. Here’s how to get ready for what’s coming in the Business Intelligence Future:
1. Know Your Users
Start by identifying who uses your dashboards and what they need. For example, a marketing team might care about campaign performance, while finance might need budget insights. These are just a few BI dashboard examples that show how tailored views can improve team outcomes. Build with their goals in mind, not just the data available.
2. Use the Right Tools
Skip the complex setup. Platforms like Mokkup.ai let you build dashboards visually, using templates or even simple prompts with GenAI. No coding or design experience is required, keeping you aligned with the fast-moving BI industry trends.
3. Collaborate Early
Bring in stakeholders from the start. With live collaboration and quick export options, gathering feedback, tweaking designs, and moving faster as a team is easy.
4. Make It Part of the Workflow
Dashboards shouldn’t just sit in a folder. Use them in weekly reviews, goal tracking, or onboarding. When they’re tied to real decisions, adoption becomes effortless. The most effective BI dashboard examples drive action, not just display metrics.
Challenges Companies Face with BI Modernization
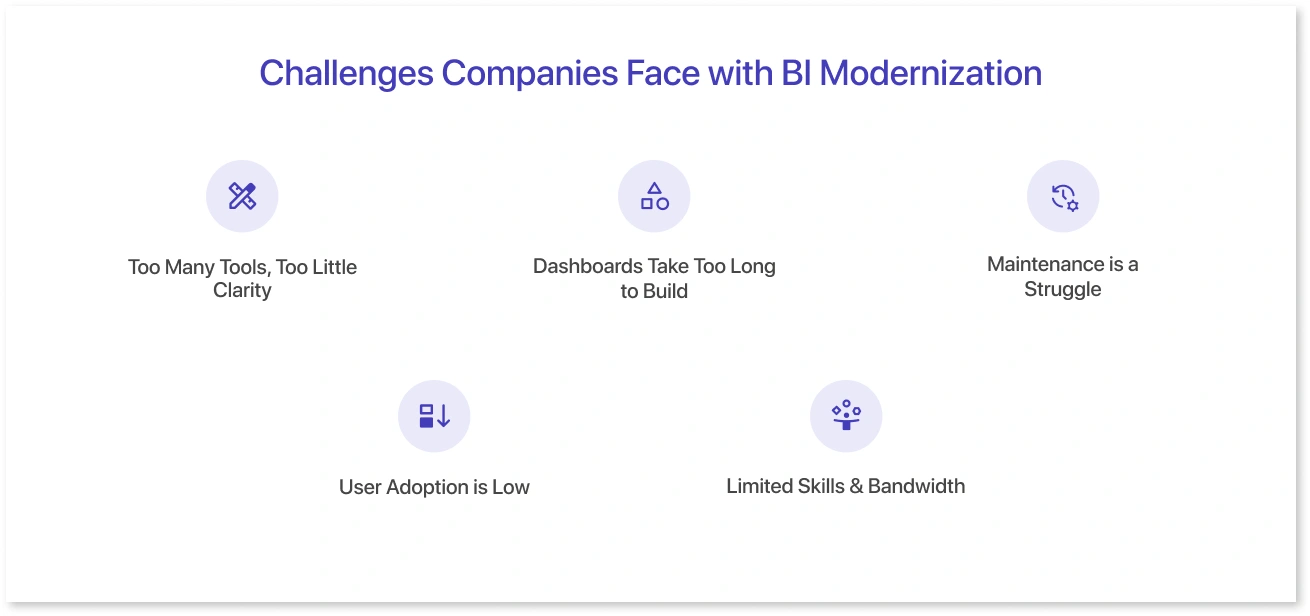
As businesses adopt more data tools and platforms, making sense of it through a centralized dashboard is getting harder. While BI dashboards are essential for decision-making, building and maintaining them is full of friction. Let’s look at some of the biggest roadblocks companies face today.
1. Too Many Tools, Too Little Clarity
With data scattered across CRMs, Excel sheets, project tools, and cloud platforms, teams often spend more time collecting data than analyzing it. Stitching it together manually can lead to gaps, delays, or duplicate metrics.
2. Dashboards Take Too Long to Build
Even simple dashboards can take weeks to perfect, especially when multiple stakeholders are involved. Between data alignment, design decisions, and revisions, many BI projects stall midway.
3. Maintenance is a Struggle
Once a dashboard is built, keeping it updated is a challenge. A new campaign, team restructure, or updated metric can require major overhauls, straining both analysts and developers.
4. User Adoption is Low
When dashboards are cluttered, overly technical, or not tailored to user needs, people simply stop using them. And if adoption drops, even the most well-designed dashboards won’t deliver value.
5. Limited Skills & Bandwidth
Not every team has a dedicated data analyst or designer. Many BI tools still require SQL knowledge or design experience, making dashboarding feel out of reach for smaller teams or non-technical users.
Ultimately, these challenges slow down decision-making and reduce the impact of business intelligence. The good news is that BI is evolving, and newer, more flexible tools are helping businesses overcome these hurdles.
The Shift Toward Self-Service BI
Business Intelligence (BI) is no longer reserved for data scientists and technical teams. As organizations aim to become more data-driven, there's a growing shift toward self-service BI tools and platforms that allow non-technical users to create dashboards, explore data, and generate insights without relying on IT support. In 2025, this shift will define many Business Intelligence Trends, especially the rise of accessible, customizable business management dashboards.
What’s driving the shift?
- Time pressure on data teams: As businesses scale, centralized BI teams struggle to meet the growing demand for insights.
- Increased data literacy: More employees now have a foundational understanding of metrics and KPIs, enabling them to explore data independently. This also encourages the creation of function-specific dashboards, like those seen in Power BI dashboard examples.
- Evolving workplace tools: Modern BI platforms are designed with user-friendliness in mind, offering drag-and-drop interfaces, guided templates, and natural language querying, key features in today’s leading business management dashboards.
What does this mean for your business?
- Faster decision-making: With data access from teams like HR, Sales, and Marketing, responses to market shifts become quicker.
- Less IT bottleneck: IT and data teams can focus on governance, quality, and advanced analytics instead of dashboard creation.
- More experimentation: Teams are likelier to test ideas, track small wins, and iterate faster, an essential behavior encouraged by flexible Power BI dashboard examples and other no-code data visualization tools.
How to implement self-service BI successfully:
- Train employees in data basics: Offer short workshops or tutorials on how to use your BI tools.
- Build guardrails: Ensure your team works within trusted data sources and governed environments to maintain consistency.
- Use customizable templates: Platforms like Mokkup.ai help users jump-start their dashboards using pre-built layouts tailored to specific business functions, such as finance, HR, or operations.
The future of BI lies in making data tools accessible to everyone, not just experts. Self-service BI gives organizations a competitive edge by unlocking insights faster and spreading data responsibility across the business.
Rise of No-Code Dashboard Tools
Another powerful trend shaping BI in 2025 is the surge in no-code dashboard solutions. These tools allow users to build dashboards without writing a single line of code, a significant breakthrough for startups, small teams, and business users with limited technical knowledge.
In traditional BI setups, dashboard development often meant long feedback loops, back-and-forth with developers, and weeks of delay. However, with no-code platforms, the process is simplified; users can drag, drop, and publish visual dashboards independently.
Key advantages of no-code dashboards:
- Speed to launch: Teams can build and iterate on dashboards in hours, not days.
- Lower barrier to entry: There is no need for SQL or DAX; anyone with basic data familiarity can start building.
- Consistent design standards: Predefined templates ensure all dashboards follow a structured format and meet reporting needs.
Mokkup.ai stands out in this space with its dashboard wireframing platform. Users can choose from professionally designed templates, like Recruitment Dashboards or Talent Management layouts, and customize them with charts, KPIs, and layout blocks. Recently, Mokkup launched an AI-powered feature that lets you generate dashboards simply by describing what you need. Just type a prompt like “Show me an employee attrition overview,” and the AI drafts the layout for you.
What makes Mokkup’s no-code approach work:
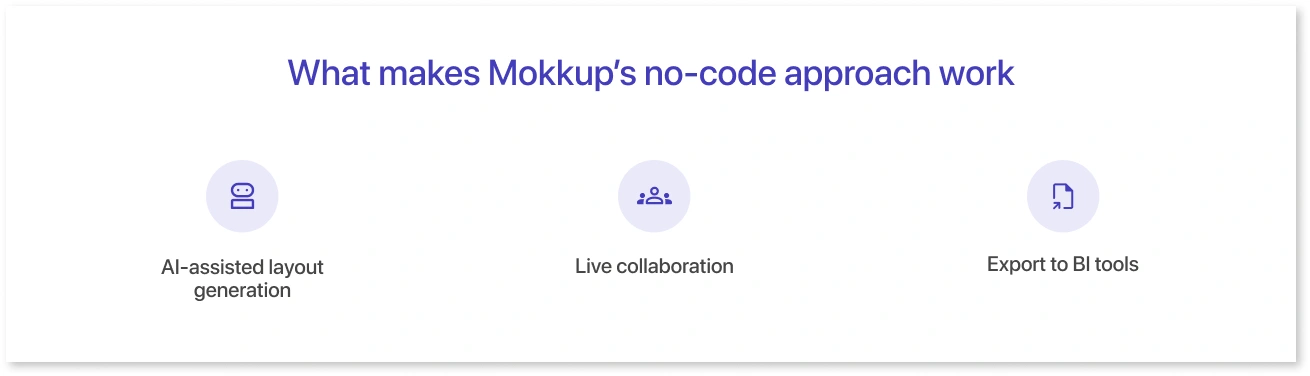
- AI-assisted layout generation: Eliminate guesswork by letting the tool structure your wireframe from a plain-language prompt.
- Live collaboration: Invite your team to edit the dashboard in real time, which is ideal for cross-functional reviews.
- Export to BI tools: Once finalized, export your design and use it in tools like Power BI or Tableau for data integration.
As businesses face tighter deadlines and leaner teams, no-code dashboards make it easier to stay agile. They reduce friction between planning and implementation, allowing teams to focus more on insights and less on design hurdles.
Role of AI in Dashboard Design and Insights
Traditional BI tools rely heavily on manual setup, finding the right data, selecting visuals, and building layouts from scratch. But with AI now entering the scene, dashboard creation is becoming smarter and faster. And tools like Mokkup are making that shift accessible to everyone.
The latest addition to Mokkup is its GenAI-powered dashboard builder, which is designed to reduce manual effort in dashboard wireframing. Instead of dragging, dropping, or selecting from countless options, you can create layouts by describing what you need.
Here’s how it works:
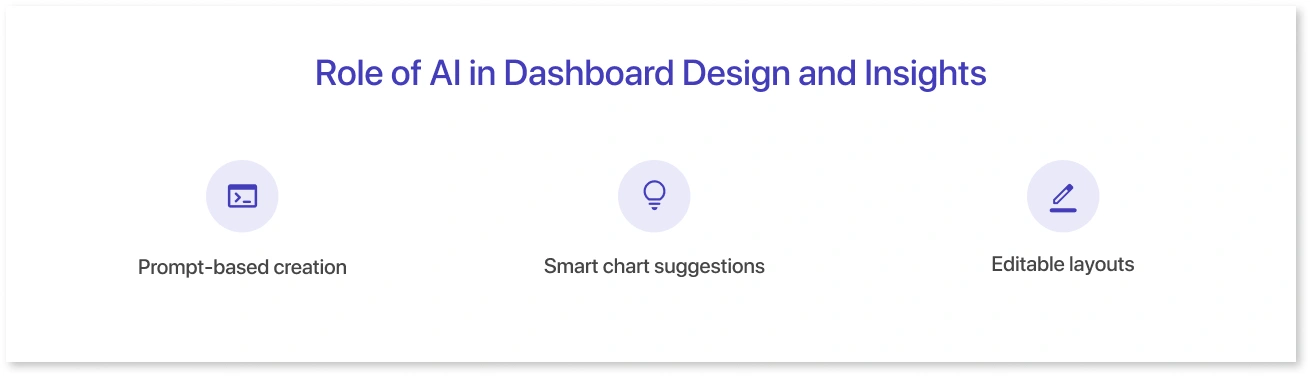
- Prompt-based creation: Type a quick prompt like “Create a dashboard to track employee attrition by department”, and the AI instantly generates a structured wireframe with relevant chart blocks.
- Smart chart suggestions: Based on your use case, the AI recommends the most suitable visuals for your metrics, bar graphs, tables, pie charts, and more.
- Editable layouts: Once the base wireframe is ready, you can fine-tune it using Mokkup’s drag-and-drop editor or choose a template to refine your idea further.
This AI-backed feature is especially useful for teams with limited design or technical skills. You can skip the drag-and-drop process entirely and let the AI handle the first draft. From there, it’s easy to tweak and personalize the layout as needed.
Combined with pre-built templates and live collaboration, AI helps reduce the time it takes to go from concept to final dashboard. Whether you're in HR, marketing, finance, or ops, you can now create and iterate on dashboard designs much faster, without waiting on analysts or design teams.
In short, AI isn’t just about automation. It’s helping teams like yours think, design, and build smarter.
Conclusion
As we move into 2025, BI dashboards will no longer be static reporting tools but dynamic, AI-powered systems that help teams make faster, smarter decisions. From embedded analytics to predictive insights and customizable layouts, businesses must stay agile to keep up with the pace of change.
Tools like Mokkup are built for this shift. Whether you’re testing out ideas, collaborating across teams, or using AI to generate dashboards from a simple prompt, Mokkup makes it easier to design and share what matters, without the usual back-and-forth. It's a more innovative way to plan dashboards in a time when clarity, speed, and flexibility are everything.
Frequently Asked Questions
In 2025, BI dashboards will become more automated, self-service-focused, and no-code friendly. AI will shape dashboard design, while real-time insights and natural language querying will make analytics more accessible to non-technical users.
Businesses can start by modernizing their BI stack, training teams in data literacy, and using tools that simplify dashboard planning. Platforms like Mokkup.ai help teams prototype dashboards faster with AI suggestions, pre-built layouts, and one-click exports to tools like Power BI.
This is very important. As decision-makers increasingly rely on phones and tablets, BI dashboards must be optimized for mobile. That means responsive layouts, simplified views, and the ability to interact with key metrics on the go.
With stricter data privacy regulations and growing complexity in data sources, BI tools are improving their governance features. Expect more role-based access controls, audit trails, and compliance-ready designs built into dashboard platforms.
Prompt it. Wireframe it with Mokkup.ai.
