
You finally have the dashboard layout everyone agrees on. The KPI cards are where they should be. The sales trend chart sits below them. Filters are grouped on the left, and the regional breakdown is exactly where your stakeholder wanted it.
You created the first version in Claude in minutes. Then you open Power BI Desktop or Tableau Desktop. And the real work begins.
Your Claude design is a visual prototype, not a BI-ready file. You still need to recreate the layout, choose the right BI-native visuals, map fields, configure calculations, and make sure the final dashboard matches what was approved.
That is the gap this workflow solves. You can use Claude Design, a Claude.ai artifact, or Claude Code to explore the dashboard idea. Then use Mokkup.ai to turn that idea into a BI-native wireframe that can be exported to Power BI or Tableau.
This matters because AI-assisted work is already part of everyday professional workflows. Microsoft and LinkedIn found that 75% of global knowledge workers were using AI at work in 2024. McKinsey's survey also found that 65% of organizations were regularly using generative AI in at least one business function.
The next step is not simply generating more AI output. It is connecting that output to the tools where the work gets delivered.
Here is how to go from a Claude dashboard wireframe to Power BI or Tableau without rebuilding the entire dashboard from scratch.
Table of Contents
- Can Claude Export a Dashboard to Power BI or Tableau?
- Why a Claude Dashboard Wireframe Still Needs a BI Handoff
- The Better Workflow: Claude for the Idea, Mokkup for the BI Handoff
- Method 1: Convert a Claude Wireframe Using an Image Upload
- Method 2: Rebuild from the Prompt Instead of the Image
- Which Method Should You Use?
- What Carries Over from Claude and What Does Not
- The Full Claude-to-BI Workflow
Can Claude Export a Dashboard to Power BI or Tableau?
Claude Design can export designs as PDF, PPTX, Canva, standalone HTML, or share them through an organization-scoped URL. It can also create a handoff bundle for Claude Code. Claude Design is currently powered by Claude Opus 5 and Fable 5 and is available as a research preview. But none of these exports is a Power BI .pbix or .pbit file, or a Tableau .twbx workbook.
Claude.ai artifacts can also produce interactive HTML or code-based prototypes, but that still does not give a BI-ready Power BI or Tableau file. So the problem is not creating the dashboard idea. The problem is getting that idea into the environment where your BI team actually builds and publishes dashboards.
That requires a bridge between the design and the BI tool.
Why a Claude Dashboard Wireframe Still Needs a BI Handoff
A Claude-generated dashboard can show you what the final report should look like. But a BI developer needs more than appearance.
For example, a KPI tile in a Claude prototype may look like a Power BI KPI visual. But Power BI's KPI visual has specific requirements around the base measure, target, and trend axis.
The same applies to tables. A generic table in a prototype does not automatically become a Power BI matrix with hierarchies, totals, and expand/collapse behavior. Power BI's matrix visual is specifically designed to organize data across rows, columns, values, and hierarchical levels.
The same problem appears with filters, calculated fields, measures, and data connections. So when a Claude wireframe reaches the BI developer, several decisions still have to be made:
- Which BI visual should represent each element?
- Which fields belong on each axis?
- Which filters or slicers are required?
- Which metrics need calculations?
- How should the dashboard respond to different data states?
- How should the layout translate into Power BI or Tableau?
Claude did its job: it helped you get to a visual direction quickly. The next job is translating that direction into BI-native components. That's when you need Mokkup.ai.
The Better Workflow: Claude for the Idea, Mokkup for the BI Handoff
Think of the workflow as three stages: Claude → Mokkup → Power BI/Tableau
Claude helps you explore the dashboard. Mokkup turns that idea into a dashboard wireframe built around BI-friendly components. Power BI or Tableau becomes the final development environment.
Instead of recreating the Claude design element by element, you carry the design into Mokkup and let Mokkup handle the BI-specific structure and export.
There are two ways to do this.
Method 1: Convert a Claude Wireframe With an Image Upload (Recommended)
Mokkup.ai's Conversational AI accepts a reference image, reads the layout, and rebuilds it out of BI-native components. Same structure, different building blocks, and these ones export.
Step 1. Capture the Claude wireframe as an Image
From Claude Design, export the canvas to HTML or PDF and screenshot the rendered page. From a Claude.ai artifact, screenshot the rendered preview in one frame with no cropping or scrolling, since Mokkup needs the full layout in a single image.
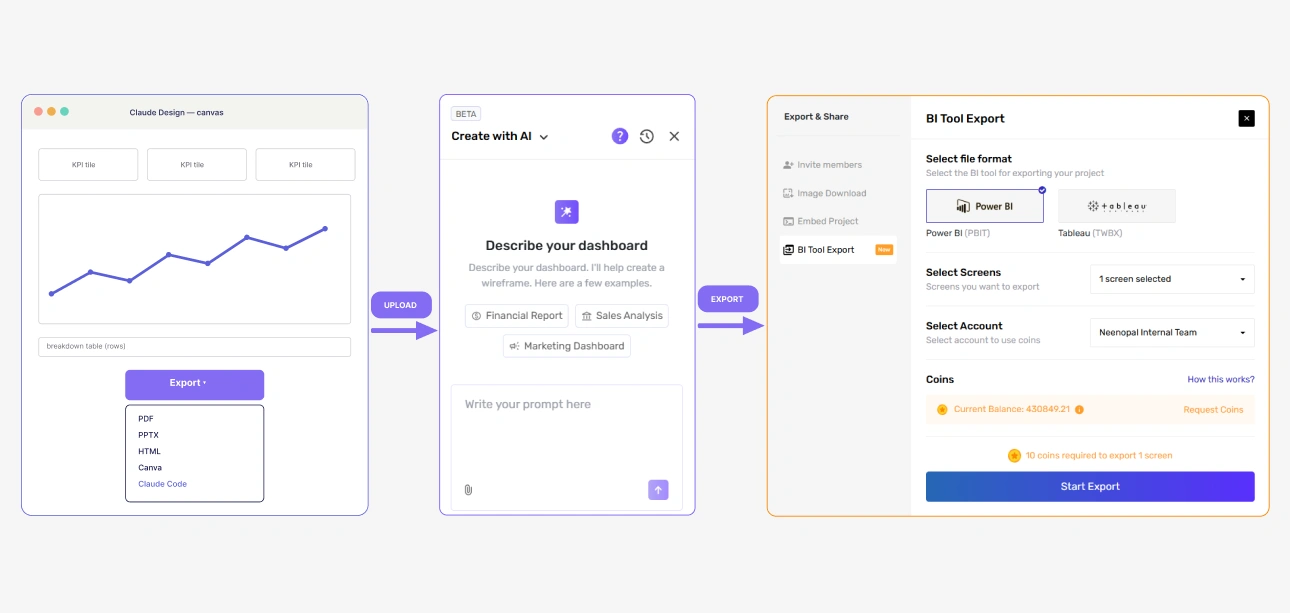
Mokkup accepts JPG or PNG only, up to 2 MB per file, and one image per message. A full 4K screenshot usually exceeds; downscale to roughly 1600px wide before uploading, or it fails.
Step 2. Upload the Image into Mokkup's Conversational AI
Open Mokkup's Create with AI chat panel, attach the image, name your target tool, audience, and metrics in the same message.
"Rebuild this layout as a Power BI dashboard for a regional sales manager. Keep the four KPI tiles across the top. Metrics: revenue, pipeline value, win rate, average deal size".
Every element Mokkup places, including the KPI card, the slicer, the matrix, and the chart types, is already built to export to both Power BI and Tableau. You pick the tool at export, and the same wireframe gives you either one.
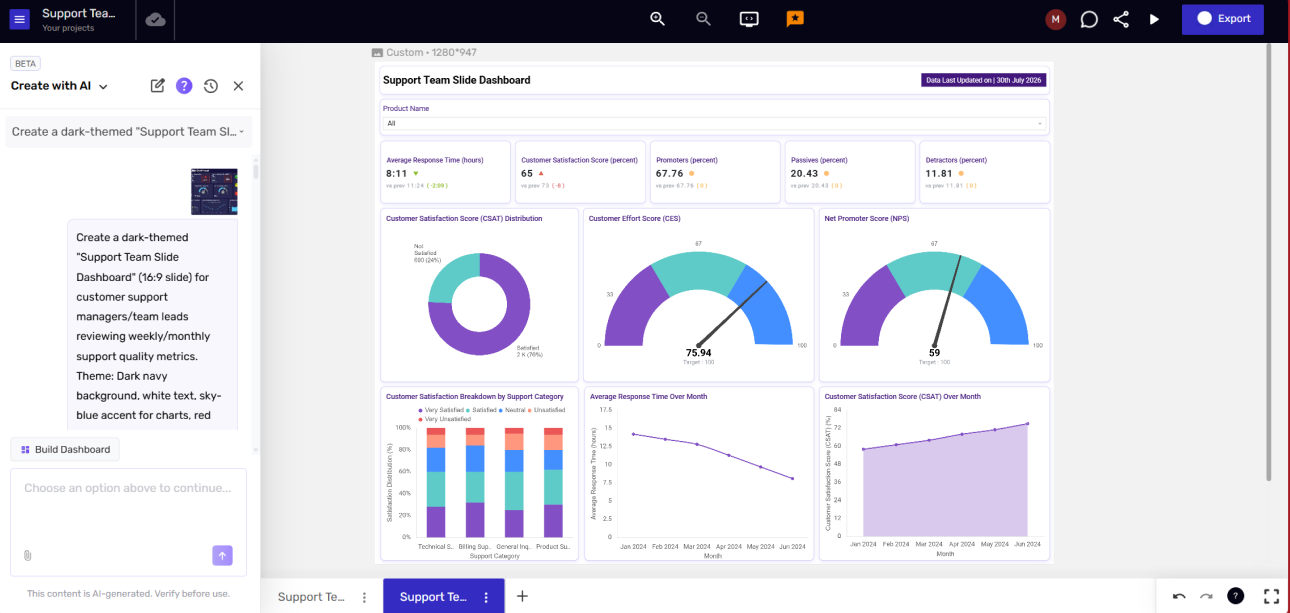
The AI asks a few clarifying questions, then a Build Dashboard button appears once it has enough context. Leading with a persona like "I'm a Head of Sales" will skip most of the questions. Each build creates a new screen and never overwrites an existing one. The free plan gives you one project, three screens, and 25 AI coins. A generated screen costs 2 coins; so this workflow fits comfortably.
Step 3. Attach Your CSV or Excel File So the Export Carries Real Structure
Attach a CSV or Excel file to the same chat. Mokkup reads your column names and data types, then lays out the wireframe using your real field names with sample data. Now the fields on the canvas match the fields in your model. Use a sample file that looks like your schema, not real production data.
Limits are CSV up to 30 MB and .xlsx up to 5 MB, one file per message. Mokkup only reads your column names and data types. It never opens or stores the rows themselves, which is the answer your security team will ask for.
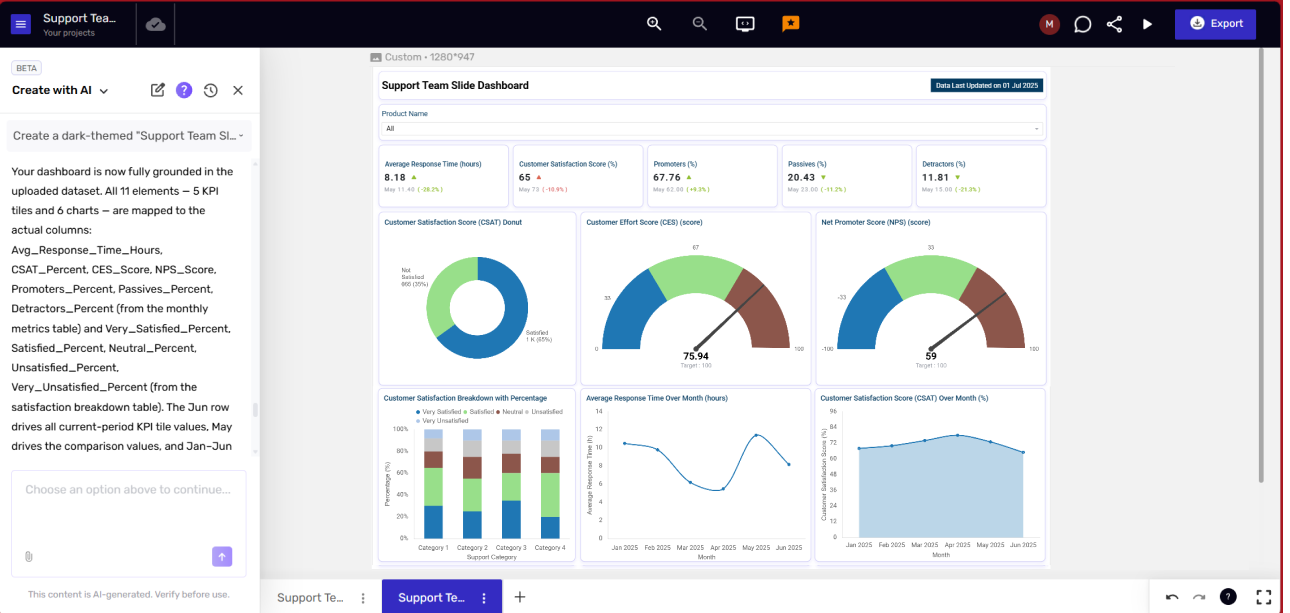
Step 4. Fix What the AI Does Not Place
The AI output is a starting point, not a finished BI wireframe. Open the generated screen in the Mokkup canvas and utilize Mokkup properties to tweak the output.
While Claude may use a specific color palette, typography, or web-style interactions, these elements may not translate directly into Power BI or Tableau. You can apply the required styling and formatting in the BI tool during the final build.
Mokkup's value here is different. Its components are designed for BI workflows, so the wireframe can be structured around the types of elements your developers will actually use in Power BI or Tableau. You are not trying to make a web prototype look like Power BI. You are creating the Power BI or Tableau version of the idea.
Step 5. Share the Link and Get Sign-Off Before You Build
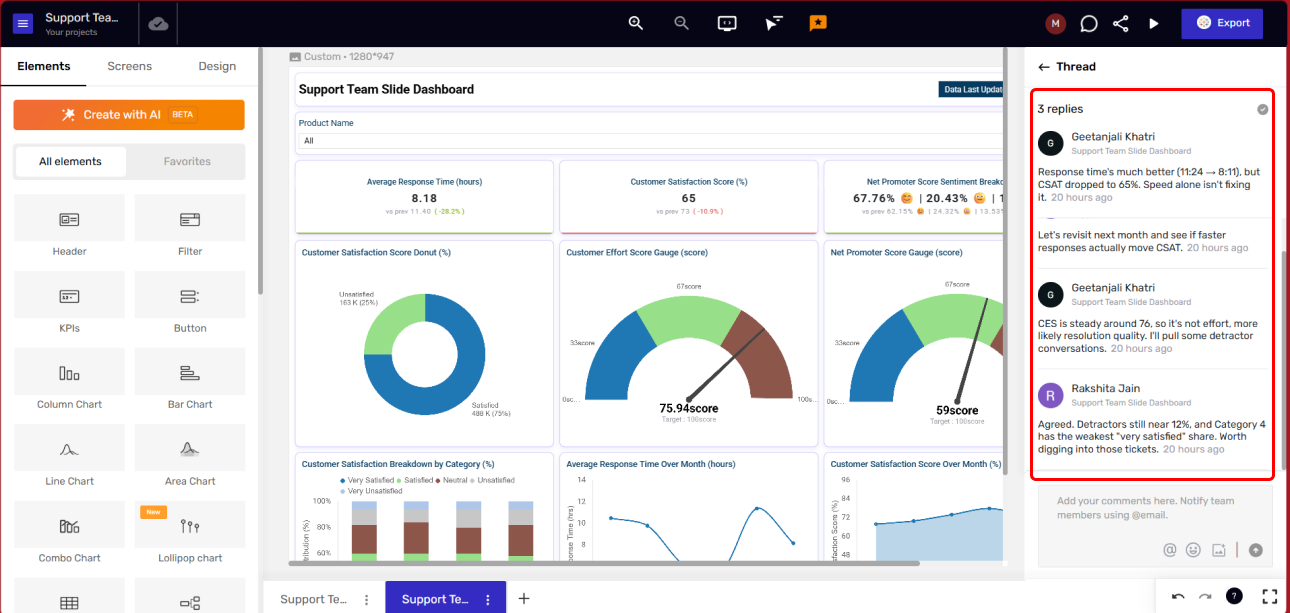
This step saves the most time. A screenshot in Slack isn't a review loop. You can send the live Mokkup wireframe link, let the stakeholder comment on the layout, and settle the argument before a single DAX measure gets written. Rework after the build costs days; rework at the wireframe costs minutes.
Step 6. Export to Power BI or Tableau
One click gives you a real BI file. The Mokkup Semantic Layer is live for both Power BI and Tableau wherein attaching your data in CSV or Excel format gives you wireframe with data and formulas attached.
As a result, your .pbix or .twbx carries the full layout, the chart structure, the measures and calculated fields you set up while wireframing. Your developer will then open a ready-made template in Power or Tableau, not an empty canvas. After that, swap the sample data for your real source, check it against the wireframe, and publish.
Also, if you don't attach data, the wireframe comes with some dummy data, meaning you still get a Power BI or Tableau file but with dummy data that you can replace later.
Method 2: Rebuild from the Prompt Instead of the Image
Not every Claude design needs to be preserved pixel for pixel. Sometimes the Claude dashboard was only an exploration. You were testing different layouts, deciding which KPIs mattered, or trying to explain an idea to a stakeholder. In that case, do not spend time perfecting the screenshot. Take the idea directly into Mokkup. You can reuse the original Claude prompt or ask Claude to turn it into a structured dashboard specification.
For example:
"Create a Power BI dashboard for a regional sales manager.
Audience: Regional sales managers
Primary goal: Monitor revenue and pipeline performance
KPIs: Revenue, revenue growth, pipeline value, win rate
Charts: Monthly revenue trend, pipeline by stage, revenue by region, product performance matrix
Filters: Date, region, product, sales rep
Layout: KPI cards at the top, trend charts in the middle, detailed matrix at the bottom".
Paste that specification into Mokkup's Conversational AI. This route gives Mokkup the business requirements directly instead of asking it to interpret another tool's visual design.
Choose this method when:
- The Claude layout was exploratory.
- You do not need to preserve the exact layout.
- You want BI-native structure from the first generation.
- You want to start with a clean dashboard structure.
Method 2 gives up the exact layout Claude designed. Often that is the point: you wanted the idea, not the pixels. For a deeper look at when a rebuild beats a straight wireframe, see Tableau and Power BI dashboard vs. wireframing on Mokkup.
Which Method Should You Use?
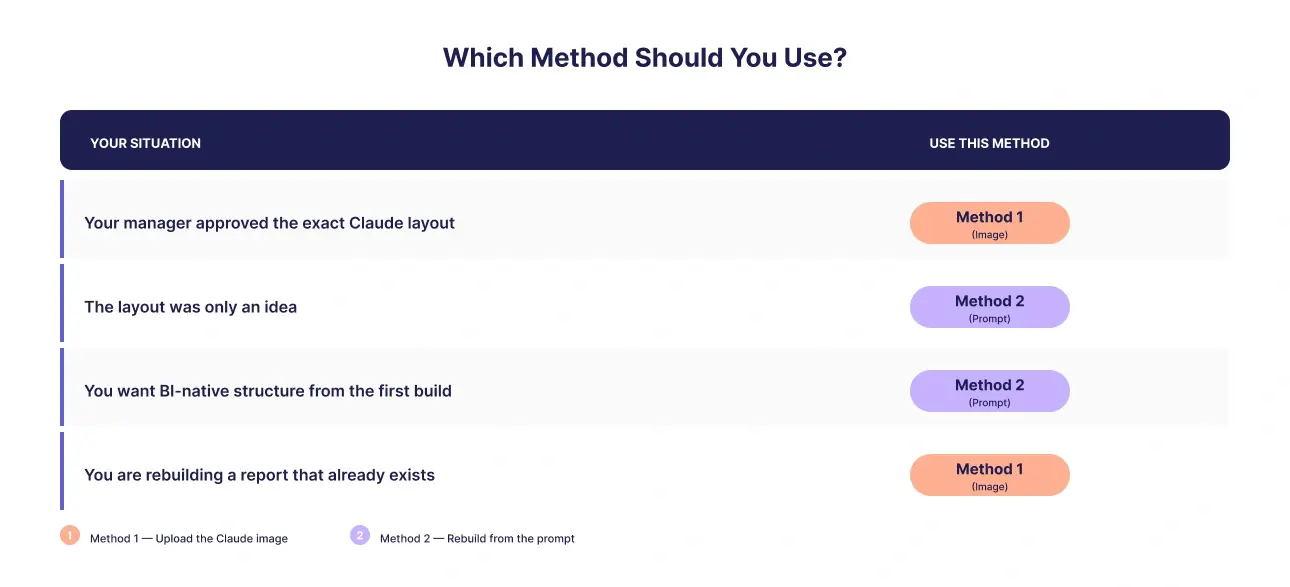
If the Claude dashboard already represents the layout your stakeholder wants, preserve it with the image-upload workflow. If Claude was mainly used to explore the dashboard idea, take the prompt and requirements into Mokkup instead.
The important point is that you do not have to choose between Claude and Mokkup. You can use both for different parts of the workflow. Your Claude dashboard wireframe to BI tool handoff is really a handoff of intent, not exact layout.
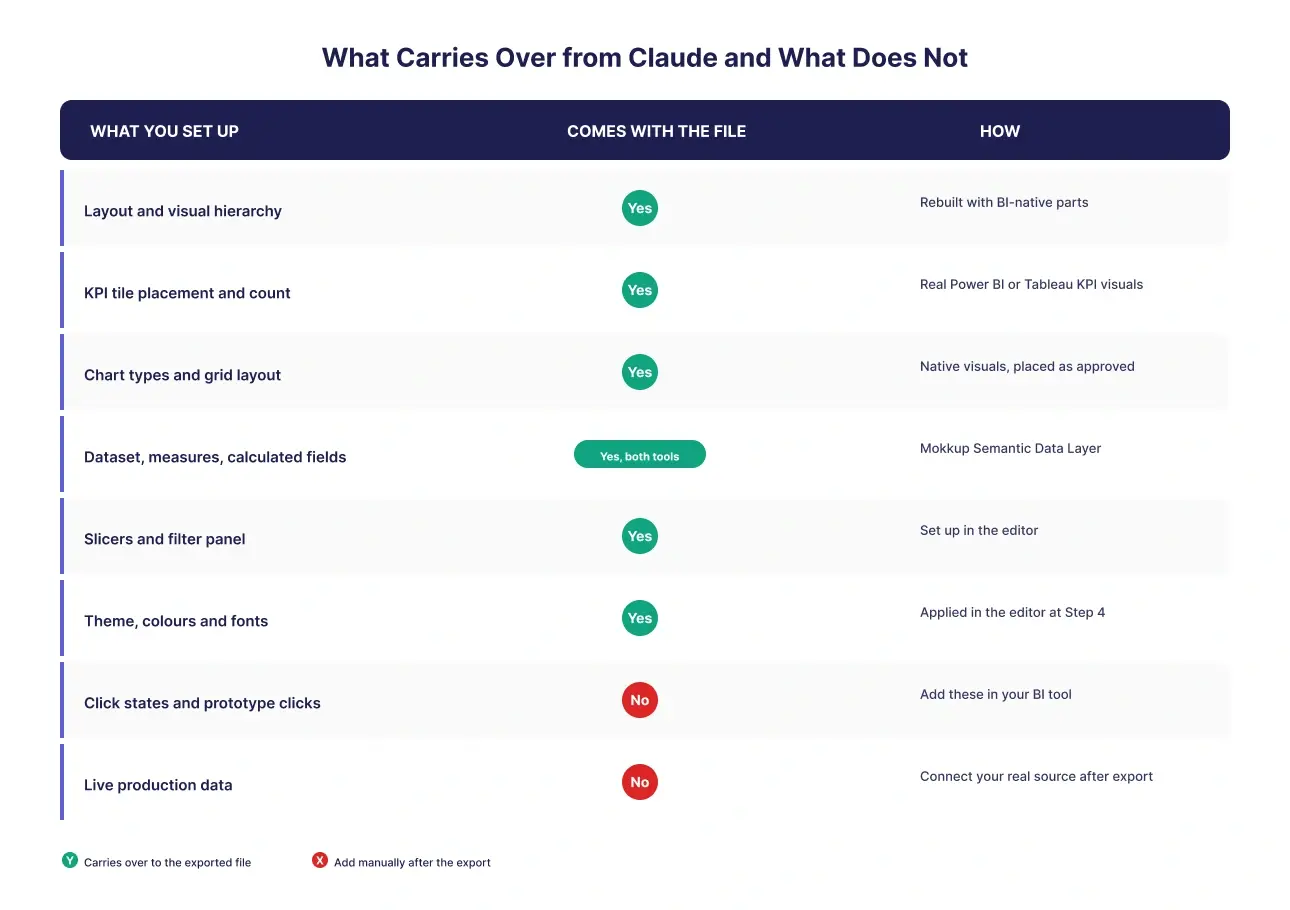
What Carries Over from Claude and What Does Not
Here's exactly what a Claude dashboard wireframe to BI tool conversion keeps and what it doesn't.
The Full Claude-to-BI Workflow, End to End
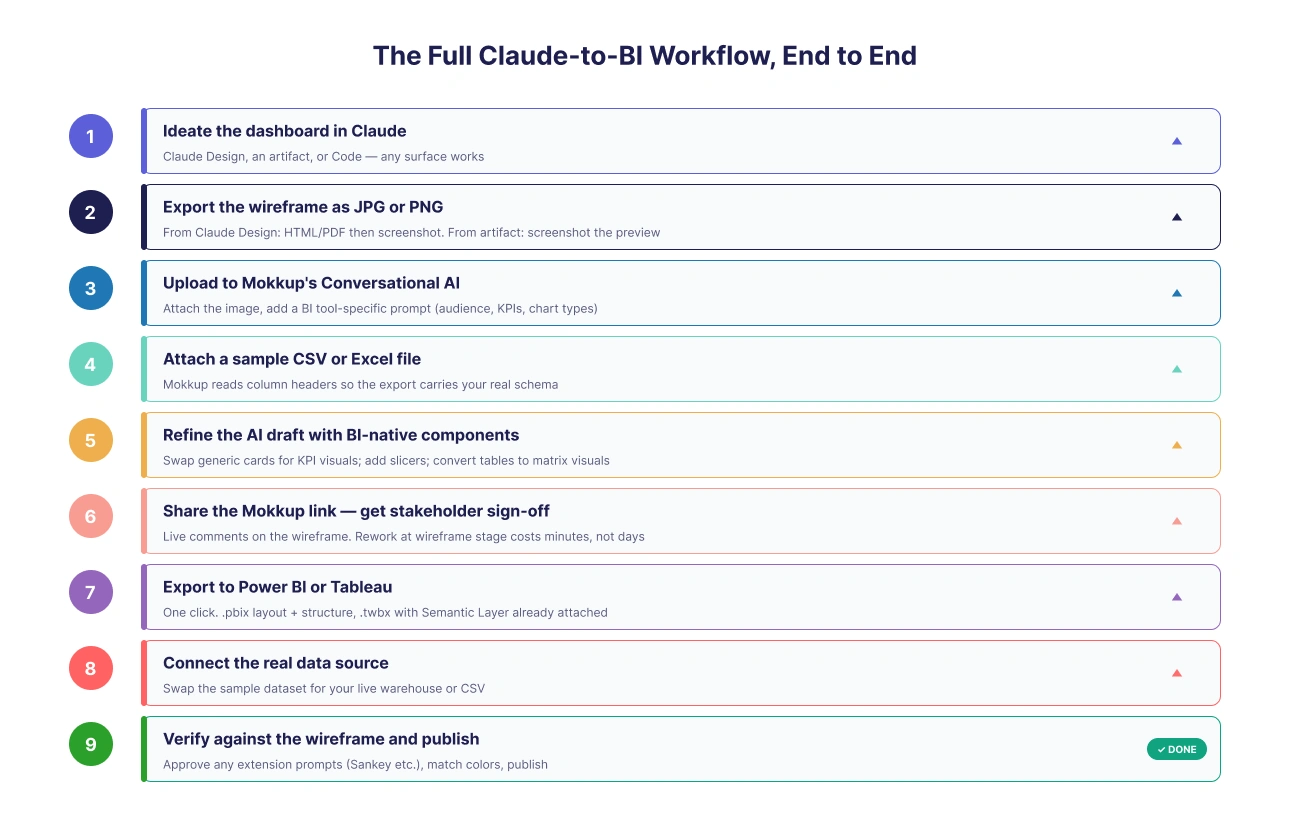
Total time for this Claude dashboard wireframe to Power BI conversion, start to finish: about fifteen minutes once you know the steps. The free Mokkup plan covers the entire workflow. No paid tier required to get from prompt to exported file.
Conclusion
Claude is genuinely fast at getting a dashboard to a layout everyone can react to and genuinely can't produce a BI file. That's a scope boundary, not a bug, and the fix is a bridge tool, not a cleverer prompt. Method 1 turns a screenshot of your Claude wireframe into a Power BI or Tableau export in minutes. Method 2 rebuilds the dashboard directly from your prompt, giving you a BI-native, pixel-perfect wireframe without having to preserve the original Claude layout. Whichever route you take, the goal is the same: turn your Claude dashboard wireframe into a real Power BI or Tableau file that is ready for data and further development.
Frequently Asked Questions
No. Claude Design, Claude.ai artifacts and Claude Code give you a dashboard mockup, not a .pbix file. Mokkup.ai closes that gap. It rebuilds your layout with BI-native Power BI parts and exports a working .pbix with your dataset and measures attached.
Not directly. There is no native path. Screenshot the artifact, upload it to Mokkup's Conversational AI with a Power BI prompt, refine the wireframe in the editor, and export. You get a working .pbix in minutes.
Claude Design gives you a layout, but it only exports to PDF, PPTX, HTML, Canva or a Claude Code handoff. Never a .twbx. Upload the layout image to Mokkup instead. It rebuilds the design with native Tableau parts and exports a .twbx with the Semantic Layer attached.
JPG or PNG, up to 2 MB, one image per message. Full-size Claude Design and artifact screenshots are often too big, so resize to about 1600px wide first. If the file is still too large, use Method 2 instead.
Yes. Mokkup's free plan includes 1 project, 3 screens, and 25 AI coins, and those coins cover prompts and the BI export. A generated screen costs 2 coins, and the export costs 10 coins. So one full conversion will consume about 12 coins, which are enough to run this workflow twice on the free plan.
Yes, it is live for both Power BI and Tableau. Upload a CSV or Excel file, and the .pbit and .twbx exports carry your dataset, measures, and calculated fields. If you skip that upload, Mokkup attaches generic dummy data instead, so your developer still starts from an empty data model.
Prompt it. Wireframe it with Mokkup.ai.
