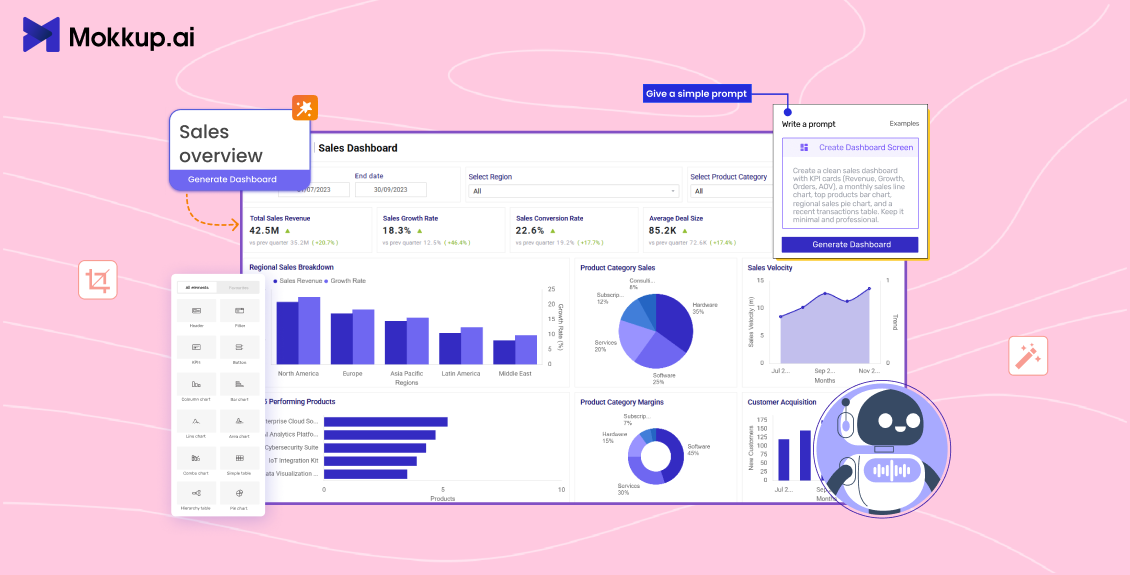
Dashboard wireframing is the first step in designing any dashboard. It helps you plan the layout, structure, and key elements before building the final version. Traditionally, this process could take a long time and many revisions.
In 2026, artificial intelligence is changing that. AI tools can now turn simple text prompts into dashboard wireframes, suggest layouts, and reduce manual work. This makes it much faster and easier for teams to create better designs. Today, more teams prefer to create wireframes with AI instead of starting from scratch.
AI is no longer rare in creative work. According to a recent global report by Adobe, about 86% of creators around the world are using generative AI in their workflows, and 81% say it helps them create things they otherwise could not have.
In this blog, we will explain what AI dashboard wireframing is, how it works, and why more teams are adopting it in 2026.
Table of Contents
- What is AI Dashboard Wireframing?
- How AI Dashboard Wireframing Works
- Key Benefits of AI Dashboard Wireframing
- Best Practices for AI Dashboard Wireframing
- Common Mistakes to Avoid in AI Dashboard Wireframing
- The Future of AI Dashboard Wireframing
What is AI Dashboard Wireframing?
AI dashboard wireframing is the process of developing dashboard layouts using artificial intelligence. Instead of manually putting charts, filters, and KPIs one by one, define your requirements, and the AI wireframe generator will recommend a systematic arrangement.
For instance, you may type: "Create a sales performance dashboard with revenue trends, top products, regional filters, and monthly comparison."
The AI then generates a wireframe with the right sections, visual placeholders, and logical data grouping. Traditional wireframing depends heavily on manual design skills and repeated revisions.
AI reduces this effort by:
- Suggesting layouts automatically.
- Organizing data in a clear hierarchy.
- Recommending suitable chart types.
- Speeding up the first draft creation.
This does not replace designers. Instead, it helps teams move from idea to structure much faster.
How AI Dashboard Wireframing Works
AI dashboard wireframing turns a simple idea into a structured dashboard layout within minutes. Instead of starting from a blank screen, you begin with a smart draft using modern AI wireframing tools.
1. Enter a Simple Prompt
You describe the dashboard you want to create.
For example: “Create a sales dashboard with monthly revenue trends, top performing products, regional comparison, and year-over-year growth.”
The clearer your input, the better the layout suggestion.
2. AI Understands the Requirements
The AI identifies:
- Key KPIs
- Suitable chart types
- Logical grouping of information
- Proper data hierarchy
It ensures that important metrics appear at the top and supporting visuals are placed logically below.
3. Automatic Wireframe Generation
Tools like Mokkup.ai allow you to generate dashboard wireframes instantly using AI. Based on your prompt, the platform creates:
- KPI cards
- Bar, line, or pie chart placeholders
- Filters and slicers
- Structured layout sections
This removes the need to manually drag and align every component.
Another key advantage is that the generated dashboard wireframes can be exported in formats aligned with tools like Power BI and Tableau. This makes it easier for BI teams to move from wireframe to actual dashboard development without redesigning the layout from scratch.
4. Customize and Refine
After the wireframe is generated, refinement becomes important. Mokkup includes an AI Review feature that analyzes your dashboard layout and provides suggestions to improve structure and clarity.
It can help you:
- Improve visual hierarchy
- Balance spacing and alignment
- Reduce clutter
- Ensure logical grouping of metrics
This makes it easier to polish the layout before sharing it with stakeholders or developers.
AI does not replace designers. It supports them by speeding up the draft process and guiding improvements so teams can focus on better insights and usability.

Key Benefits of AI Dashboard Wireframing
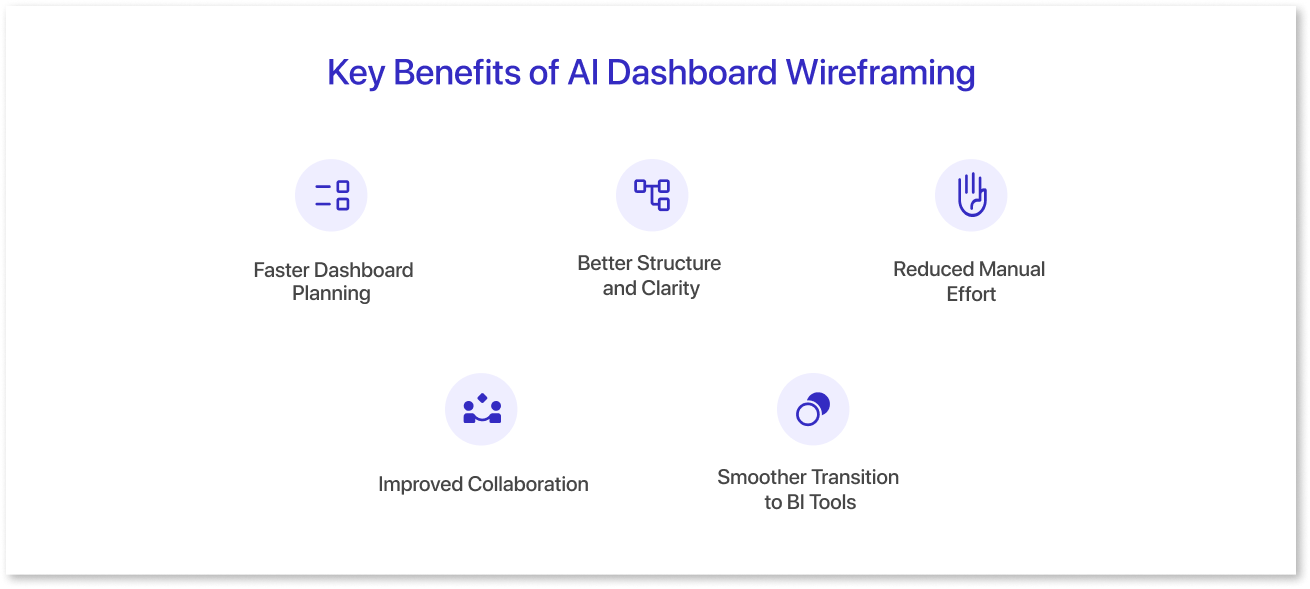
AI wireframing involves more than just speed. It improves the overall design process and allows teams to work more effectively.
1. Faster Dashboard Planning:
AI eliminates the need to start from scratch. With an AI wireframe generator, teams can generate a structured layout within minutes. This speeds up early-stage planning and clearly demonstrates how an AI wireframe generator improves workflows by reducing time spent on initial drafts.
2. Better Structure and Clarity:
AI recommends logical grouping of KPIs, visualizations, and filters. It contributes to the maintenance of a good visual hierarchy, making essential measurements easier to spot.
3. Reduced Manual Effort:
Instead of painstakingly dragging and aligning each element, AI builds a ready to edit framework. This reduces repetitive work and shows how an AI wireframe generator improves workflows by automating layout creation while still allowing customization.
4. Improved Collaboration:
A clear wireframe makes it easier for designers, analysts, and stakeholders to discuss requirements. Everyone can see the structure before development begins, which reduces misunderstandings later.
5. Smoother Transition to BI Tools:
When wireframes can be exported to platforms like Power BI and Tableau, the handoff to development is faster. This makes BI dashboard wireframing more efficient and reduces redesign cycles.
Overall, AI dashboard wireframing helps teams move from idea to execution faster, with better structure and fewer revisions.
Best Practices for AI Dashboard Wireframing
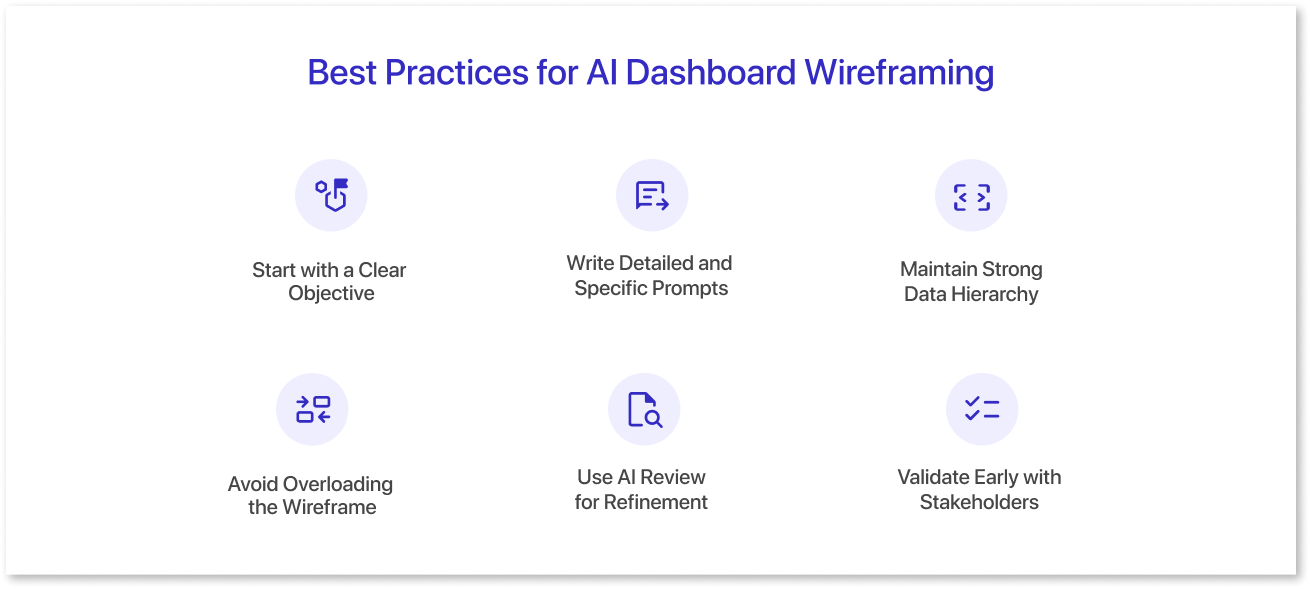
AI can generate dashboard layouts quickly, but the quality of the result depends on how you guide it. Following best practices ensures your wireframe is clear, organized, and ready for development.
1. Start with a Clear Objective:
Before writing a prompt, define the purpose of the dashboard. Ask yourself:
- Who will use this dashboard?
- What decisions will it support?
- What are the top 3 to 5 metrics that matter most?
If the objective is not clear, even AI will produce a layout that feels generic. A focused goal leads to a more meaningful wireframe.
2. Write Detailed and Specific Prompts:
AI works best when instructions are clear. Instead of writing: “Create a marketing dashboard,”
Try:
“Create a monthly marketing dashboard showing campaign performance, cost per lead, conversion rate, and channel comparison with filters for region and time period.”
Specific prompts help AI:
- Choose relevant chart types
- Organize KPIs properly
- Avoid unnecessary components
The better the input, the better the output.
3. Maintain Strong Data Hierarchy:
Every dashboard should follow a logical visual flow:
- Top section: Key KPIs
- Middle section: Trend charts and comparisons
- Bottom section: Detailed breakdowns
Even if AI generates the layout, review whether the most important numbers are immediately visible. Users should not have to search for critical insights.
4. Avoid Overloading the Wireframe:
One common mistake is adding too many visuals in the first draft. AI can generate multiple charts quickly, but more visuals do not always mean better clarity.
Keep the wireframe:
- Focused
- Balanced
- Easy to scan
You can always add more elements later if required.
5. Use AI Review for Refinement:
After generating the wireframe, refinement is important. Tools like Mokkup offer an AI Review feature that analyzes the layout and suggests improvements.
It can help identify:
- Cluttered sections
- Poor spacing
- Weak visual hierarchy
- Misaligned components
This extra step ensures the wireframe looks clean and structured before moving to development.
6. Validate Early with Stakeholders:
Share the wireframe with business users before building the final dashboard. Early feedback helps:
- Confirm metric relevance
- Align expectations
- Reduce redesign effort
Wireframes are meant for discussion. Use them to gather input before investing time in full development.
When AI is combined with clear goals, structured prompts, and thorough evaluation, dashboard wireframing becomes faster, more accurate, and scalable.
Common Mistakes to Avoid in AI Dashboard Wireframing
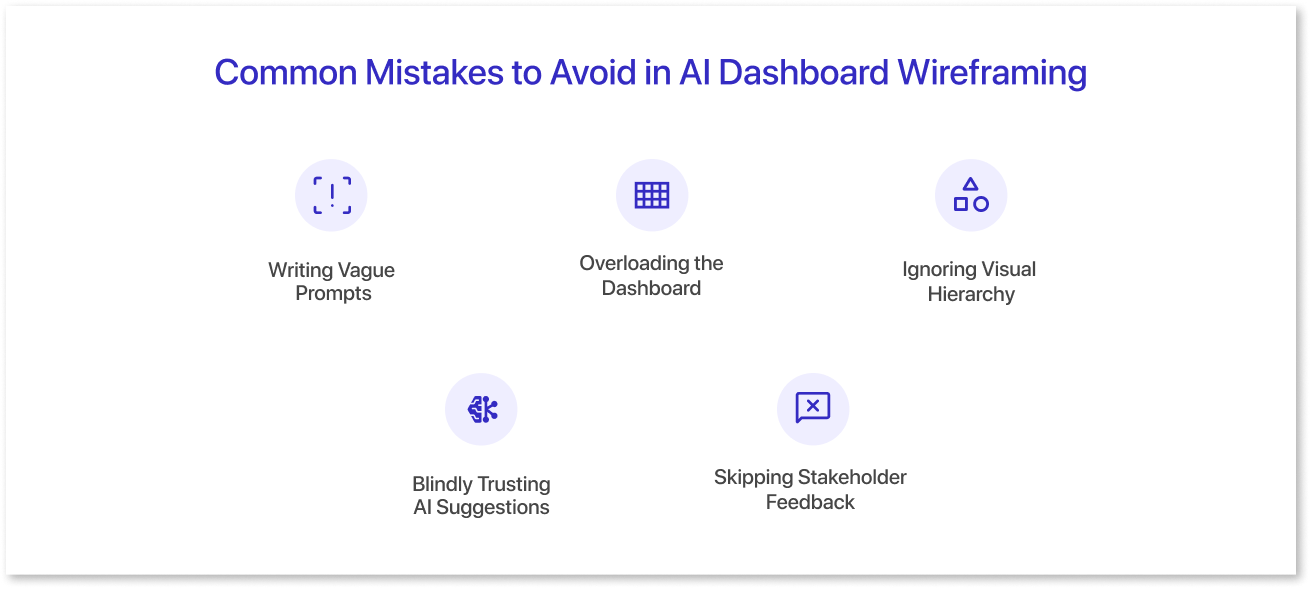
AI can speed up dashboard wireframing, but it still needs guidance. Avoiding these common mistakes will help you create more effective and user-friendly layouts.
1. Writing Vague Prompts:
A common mistake is giving very short or unclear instructions like “Create a finance dashboard.”
Vague prompts lead to generic layouts. Always mention:
- Key metrics
- Target audience
- Time frame
- Required filters
Clear inputs produce better outputs.
2. Overloading the Dashboard:
AI can quickly generate multiple charts and components. But adding too many visuals can make the layout cluttered and confusing.
Focus on:
- 3 to 5 key KPIs
- Clear supporting charts
- Simple navigation
A clean wireframe is easier to understand and refine.
3. Ignoring Visual Hierarchy:
Not all metrics have equal importance. If every element looks the same size and style, users will struggle to find critical insights.
Make sure:
- Primary KPIs are at the top
- Trend charts are easy to scan
- Detailed breakdowns appear later
AI helps with structure, but human review ensures clarity.
4. Blindly Trusting AI Suggestions:
AI provides a starting point, not a final solution. Accepting every layout suggestion without reviewing it can lead to poor usability.
Always:
- Check alignment and spacing
- Review logical grouping
- Confirm business relevance
Using tools like AI Review features can help refine the layout before finalizing it.
5. Skipping Stakeholder Feedback:
If you move directly from wireframe to development without validation, you may face redesign requests later.
Share the wireframe early to:
- Confirm metric relevance
- Align on layout expectations
- Reduce rework
AI is a powerful assistant, but thoughtful input and review are what turn a basic wireframe into an effective dashboard design.
The Future of AI Dashboard Wireframing
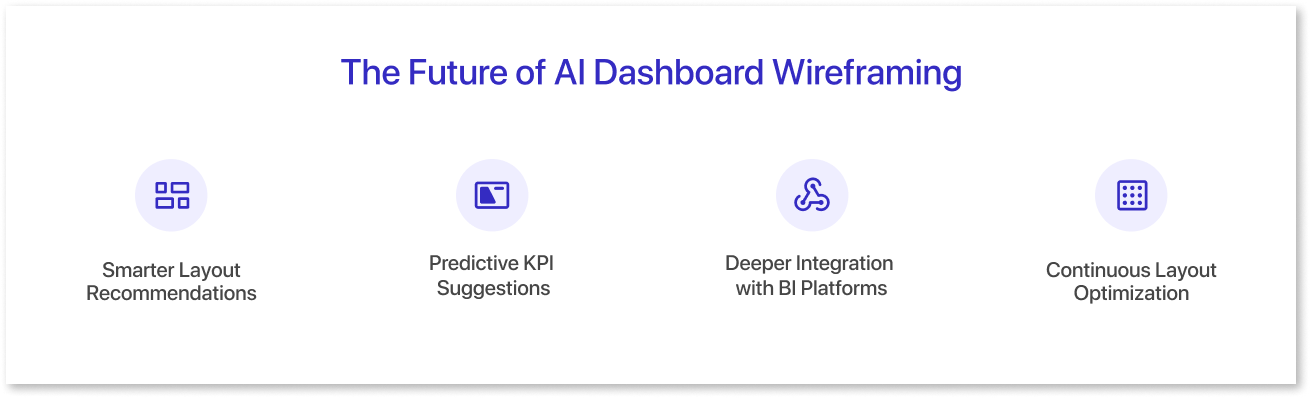
AI wireframing is still evolving. In the coming years, it will become even smarter and more integrated with business tools. As of 2025, over 75 % of UX teams are already using AI tools in their design process, and wireframing is among the areas most transformed by this shift, showing how quickly AI is reshaping foundational design workflows.
1. Smarter Layout Recommendations:
Future AI systems will not just place charts on a screen. They will understand industry context and business goals. Based on your data type, they may suggest optimized layouts automatically.
For example, a finance dashboard may prioritize variance analysis, while a marketing dashboard may highlight campaign trends and funnel metrics.
2. Predictive KPI Suggestions:
Instead of waiting for you to define every metric, AI could recommend KPIs based on:
- Industry standards
- Historical dashboard usage
- Similar business models
This will help teams identify insights they may otherwise overlook.
3. Deeper Integration with BI Platforms:
AI wireframing tools will continue improving integration with platforms like Power BI and Tableau. The gap between design and development will become smaller.
This means:
- Faster implementation
- Fewer redesign cycles
- Better alignment between layout and final dashboard
4. Continuous Layout Optimization:
In the future, AI may analyze how users interact with dashboards and suggest improvements automatically. If certain charts are rarely viewed, the layout could be optimized for better engagement.
The future of AI dashboard wireframing is not just about speed. It is about creating smarter, more user-focused dashboards with less effort and better results.
Conclusion
AI dashboard wireframing is changing the way dashboards are planned and designed. What once required hours of manual layout work can now be done in minutes with structured prompts and intelligent suggestions.
From generating the first draft to refining layouts with AI review features, modern tools are helping teams move faster and work more efficiently. Export compatibility with platforms like Power BI and Tableau further reduces the gap between design and development.
However, AI works best when combined with clear objectives, a strong data hierarchy, and stakeholder feedback. It supports designers and data teams by simplifying repetitive tasks, but thoughtful review remains essential.
As AI continues to evolve, dashboard wireframing will become more intelligent, more integrated, and more user-focused. Teams that adopt AI early will be able to design dashboards faster, improve collaboration, and deliver insights with greater clarity.

Frequently Asked Questions
AI dashboard wireframing is the process of creating dashboard layouts using artificial intelligence. Instead of manually placing charts and KPIs, users can describe their requirements in simple language, and the AI generates a structured wireframe automatically.
No, AI does not replace designers. It helps speed up the initial layout creation and provides suggestions. Designers still play an important role in refining structure, ensuring usability, and aligning the dashboard with business goals.
Yes, some AI dashboard wireframing tools allow exports aligned with platforms like Power BI and Tableau. This helps teams move from design to development without recreating the layout from scratch.
There are several tools that help users create wireframes with AI for dashboards. Examples include Mokkup.ai, Uizard, and Figma’s AI features. These platforms act as an AI wireframe generator by turning prompts into structured layouts and supporting export or handoff to BI tools.
Prompt it. Wireframe it with Mokkup.ai.
