No wonder why chief finance officers (CFOs) and financial professionals have become essential architects for leveraging data through market trends and economic indicators. Each data point collected from the market acts as a driving force for deriving meaningful insights that later aid strategic decisions.
Now that finance data is complex, the prominence of financial performance dashboards can be overlooked.
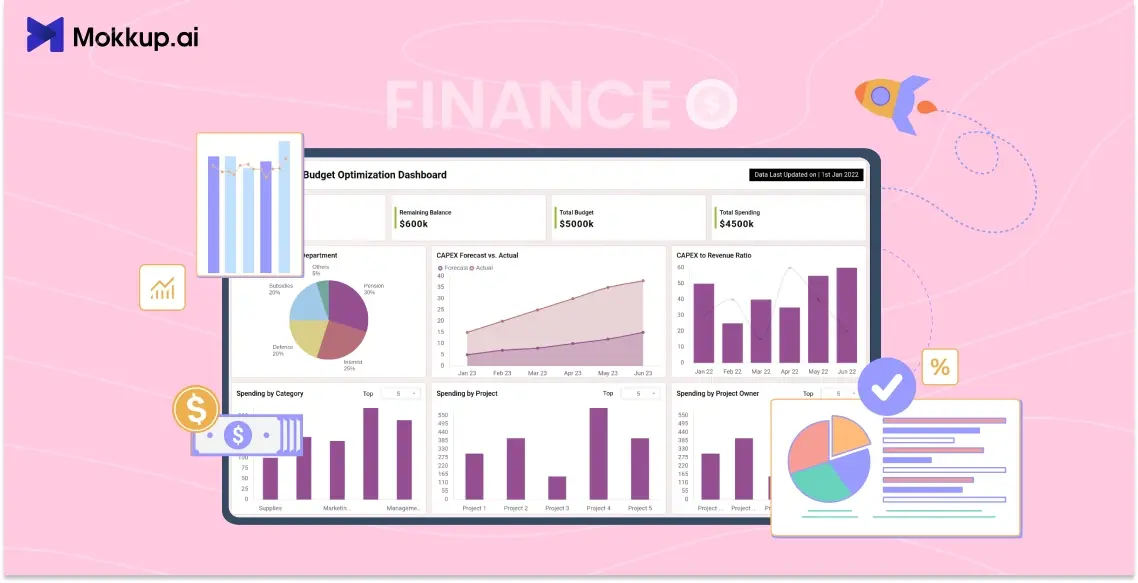
This article will articulate various finance dashboard templates and examples by Mokkup.ai to help you understand financial data. Later, we will explain how these templates can be used in minutes to keep your data analysis ready.
Let us begin with the basic understanding of the finance dashboard.
Table of Contents
- What is a Finance Dashboard?
- Benefits of Financial Dashboards
- Types of Finance Dashboards with Templates & Examples
- Free vs Premium Finance Dashboard Templates
- How to Choose the Right Financial Dashboard Template
- Best Tool to Build Finance Dashboards – Mokkup.ai
- Tips for Effective Finance Dashboard Design
What is a Finance Dashboard?
A finance dashboard contains all the primary metrics or KPIs that track the organization's financial performance. Various financial analytics dashboards coherently synthesize accounting data to explore cost reduction opportunities and revenue improvement.
At Mokkup, you will find a plethora of financial dashboards that streamline your work to create a perfect report, be it a profit and loss report or a budgeting report. You can also jot down your complex financial data into an easy-to-understand format, such as charts, maps, or graphs, to make the interpretation easy and superficial.
Benefits of Financial Dashboards
Using dashboards for your strategic planning or analysis can be a real game-changer. Combining data from multiple sources can provide a clear picture of your financial status, which can help you undertake major intelligent decisions. Here are a few benefits of an AI finance dashboard if you make it a habit for analysis:
- Keeping your financial KPIs on track: With the right financial dashboard, you can get a bird's-eye view of the organization's fiscal health. Instead of spreadsheets or custom reports, you can get your metrics in real-time to pinpoint areas that need attention and others that are performing.
- Identifying trend & goal tracking: One of the key advantages of using a financial dashboard is that you can uncover trends by tracking historical data. Additionally, you can set the financial goals based on the performance measurement and set the targets that actually support the long-term objectives.
- Increasing profitability: Even if you review your reports regularly, you still lag in reaching the profitability range. Thankfully, financial dashboards can make your reporting smoother as they compile data from numerous sources so that you can make your adjustments faster and take a step ahead in earning more profits.
- Save time on big decisions: A well-defined financial dashboard saves the most time gathering data from individual sources. You can skip the unnecessary time of creating a detailed 30-page report and instead generate a dashboard that includes the key metrics that matter.
Types of Finance Dashboards with Templates & Examples
Many of the real-time financial reporting dashboards are mission-critical that drive better financial decisions. Let’s look at some finance dashboard examples and types by Mokkup.ai to get inspiration for your own dashboard:
1. Budget Optimization Dashboard
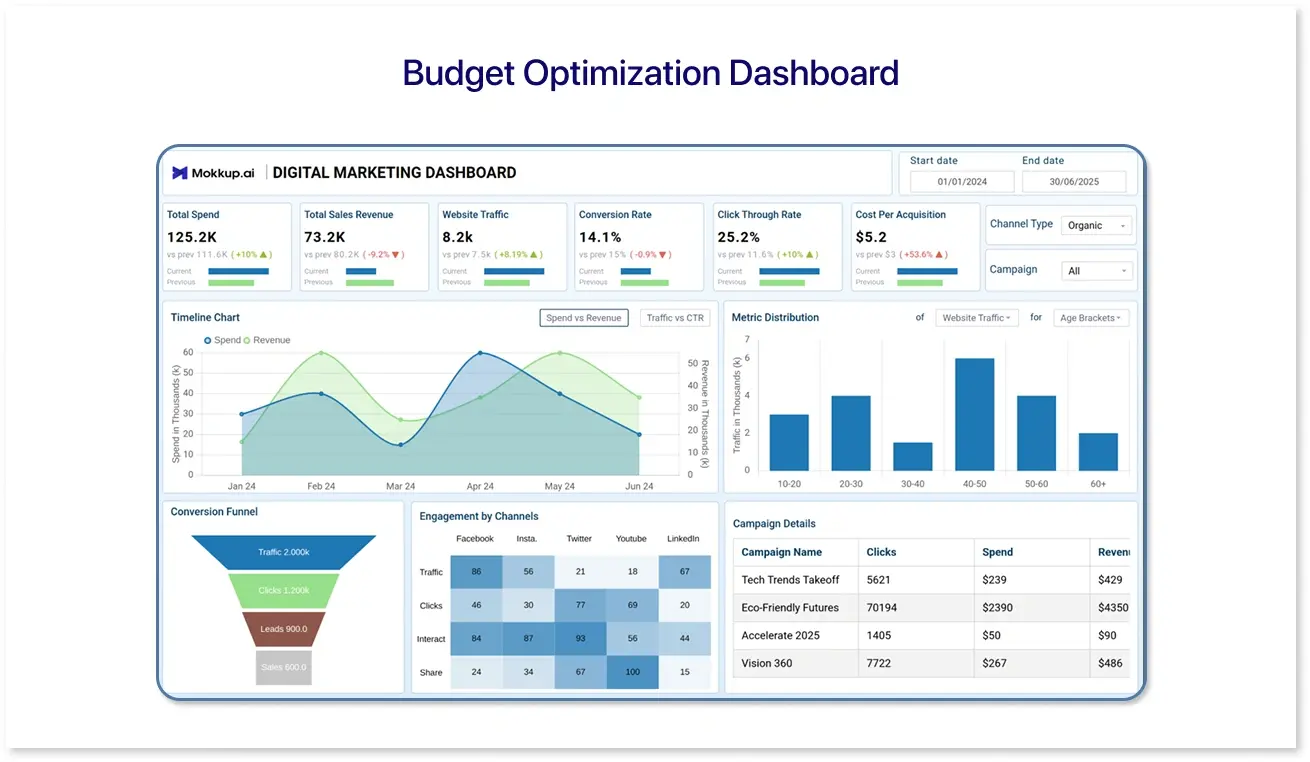
The budget optimization dashboard is a type of finance dashboard that accurately articulates the capital expenditures. By analyzing spendings by projects, owners, department, and category, it can provide a wholesome view of the budget and thereby financial outcomes. The project detail table will provide a quick oversight of the financial performance by looking at the annual budgets. This budget tracking dashboard can help stakeholders make informed decisions and achieve optimal utilization of financial resources.
2. Financial Summary & Analysis
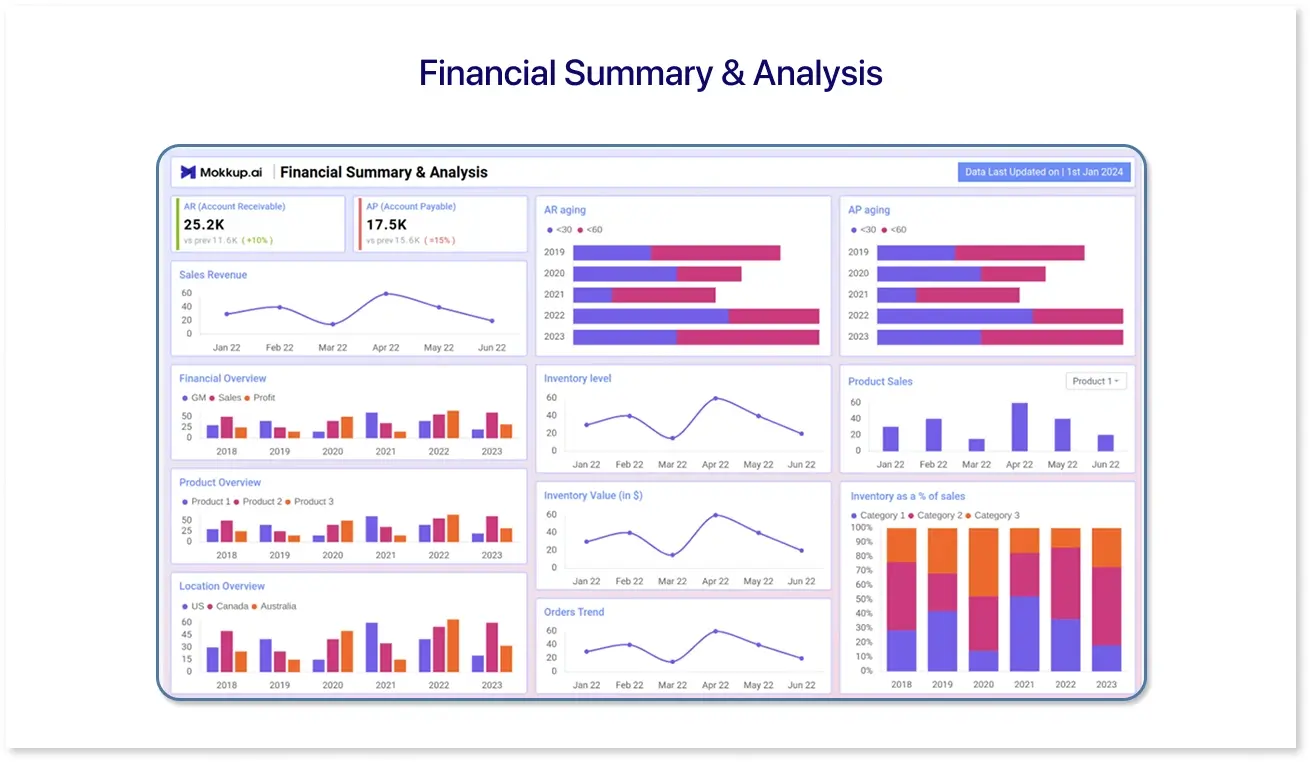
This dashboard contains an array of essential financial metrics that inform crucial strategic decisions. The financial summary & analysis dashboard wireframe caters to the needs of CFOs to get insights into the sales revenue, outstanding expenses, inventory levels, and more, to empower them with the correct data.
3. Profit & Loss Detailed Report
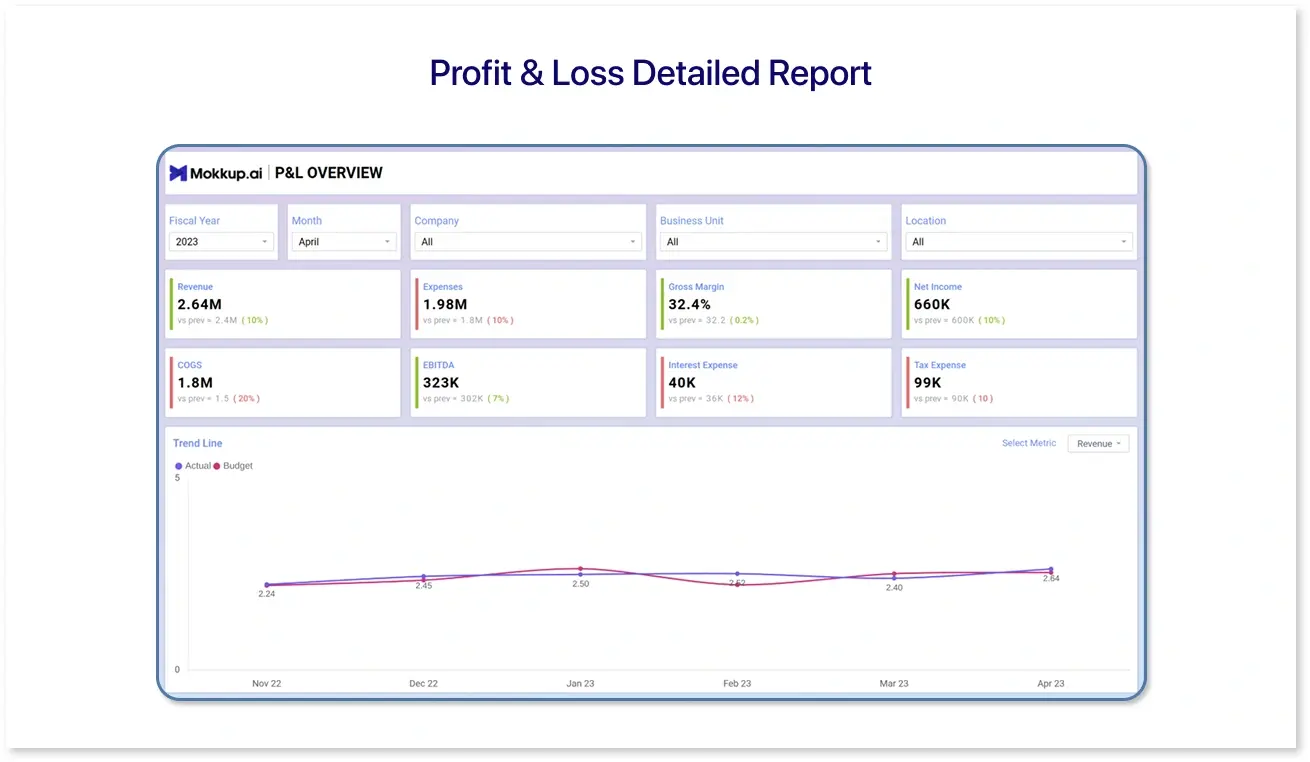
This kind of dashboard is driven by tracking incomes and expenses that directly impact the company's profits or losses. The profit & loss detailed report is typically used to grasp the detailed performance of the unit by measuring profitability and analyzing the financial swings over time. By eliminating the need for cumbersome paperwork, it can help financial analysts meet compliance requirements through customized reporting.

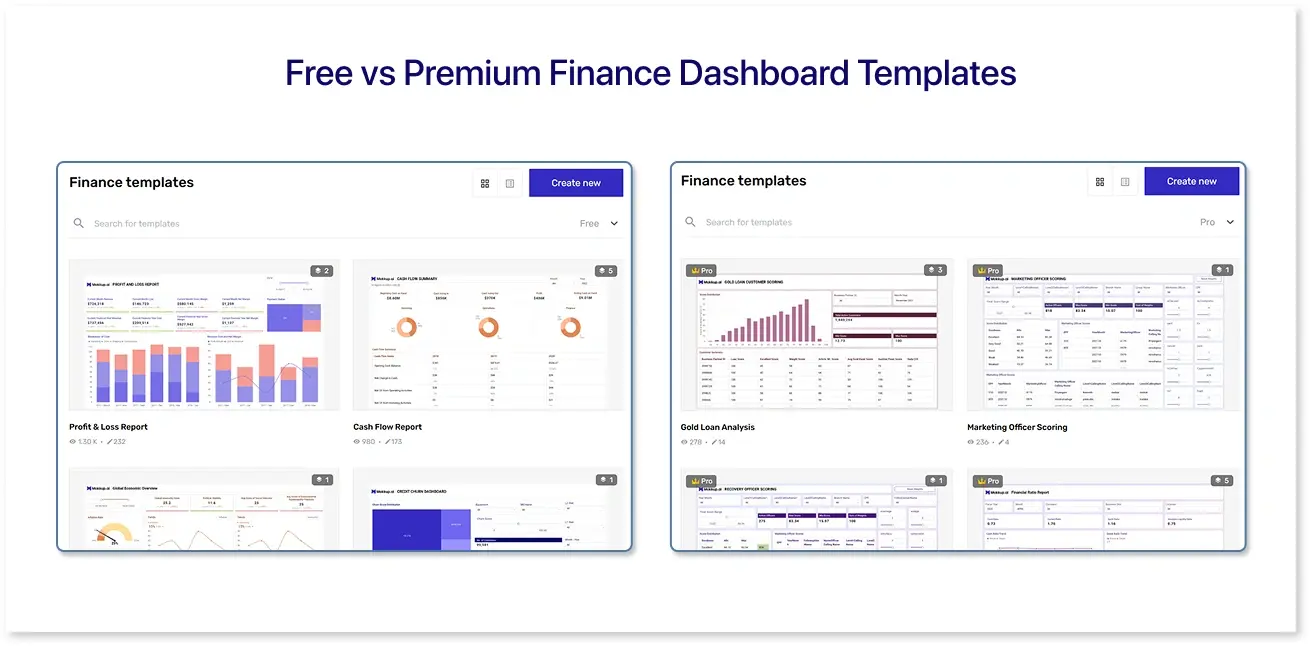
Free vs Premium Finance Dashboard Templates
Mokkup is one of the best finance dashboard software that has free and premium templates for breaking down the financials. You can choose among the free and premium CFO dashboard templates depending on your needs and budget. Here is a breakdown to help you decide:
Free Templates:
1. Cash Flow Report
This is the basic Mokkup.ai finance dashboard that manages your cash and plans for the future. You can use this cash flow report to indicate the cash going out, cash coming in, and cash in hand at the end of the financial year to strategize debits and ensure financial stability. The dashboard contains an interactive simulation to adjust revenues, expenses, and cash flows to optimize financial performance and mitigate risks.
2. Personal Budget Tracker
This is another free dashboard template that categorizes your expenses and incomes in a digestible format. The personal budget tracker gives you actionable insights into operational efficiency and gauges customer satisfaction by tracking NPS, CAC, and CLTV. To use this template, you need to apply data filters like range, product, and region to get started with the visualizations that accelerate strategic planning and analysis.
Premium Templates
1. Financial Ratios Report
This dashboard wireframe by Mokkup tracks the essential ratios to give a clearer view of the organization's liquidity. It allows you to compare your liabilities and assets to make critical business decisions. The financial ratios report is a premium template that allows you to enter your details and apply filters by company, business unit, or location to get a detailed overview of profitability ratios.
2. Healthcare Payment Analysis
The healthcare payment analysis dashboard is another pro template that integrates major KPIs like medical billing trends, collection rates, and patient payment data. Organizations make quick clinical decisions backed by data. You can consider it a healthy plate for tracking incomes and expenses and pinpointing inefficiencies in the claim management process. Use it as a cost-to-care breakdown to make accurate predictions and ensure operational efficiency.
How to Choose the Right Financial Dashboard Template
You must consider multiple factors while choosing the right financial dashboard for your analytical needs. Obviously, there is more to look at in a dashboard than interactivity. Here are a few factors that you should take into consideration:
- Your Specific Needs: First, you need to be clear about the objective of your dashboard. Determine if you want to track your profits, do financial reporting, or use specific analytics like forecasting. Then, you can jump straight to understanding users' needs and hard-pressing their roles to design dashboards.
- Desired Features/ Functionalities: Functionalities can be decided based on your needs. For example, real-time reporting can be the apt feature if you want live updates. If you want to represent data thoroughly, you can integrate drill-down capabilities into the dashboard.
- UI/UX Design Elements & Usability: Prioritizing user experience, you should choose a finance dashboard with an intuitive interface and clear and concise visualizations. Ensure the dashboard is user-friendly and free of clutter to make the interpretation more relevant.
- Scalability & Support: Since the objective is to make the right financial decisions, the dashboard should track the right metrics to support your long-term goal. Plus, the vendor should be able to provide detailed documentation of the dashboard design support resources for a smooth dashboarding journey.
Best Tool to Build Finance Dashboards – Mokkup.ai
Mokkup is the best Visual finance dashboard builder to streamline your dashboard development process and help you reach your financial goals. Here are a few reasons why we are the right choice for your data visualization needs:
- An Array of Ready-to-Use Templates: Mokkup has an expansive library of pre-built templates that cover industries like finance, marketing, logistics, customer service, and more. By putting your data into the templates, you can get started with the visualization in no time.
- Unlimited Customizations: We have numerous visuals, charts, and maps to customize your dashboards with the details you need while having complete control over the dashboard wireframe. Interactive color schemes and elements allow the flexibility of bringing your vision to life.
- Download Directly to Your BI Tool: With Mokkup, BI analysts don't have to do back-and-forth to develop functional dashboards. This is because our BI Export feature allows you to download the dashboard wireframe directly to your preferred BI tool, such as Tableau or Power BI.
- Workspace Controls: Another new feature of Mokkup, workspace management, enables users to collaborate seamlessly by controlling who can edit, access, or comment on the project. You can empower your team to contribute their input, which enhances accountability in dashboard design projects.
Tips for Effective Finance Dashboard Design
Let’s look at five top tips to design your finance dashboard, whether you are developing it from scratch or redesigning the old one:
- Get a thorough understanding of the use case or target audience: If you know your dashboard's purpose, you can better impact your stakeholders. Knowing your audience and knowledge levels lets you prioritize the prominent metrics in their decision-making process.
- Select the Right KPIs: It is essential to align your KPIs or metrics with the overall financial goal. In addition, focus on KPIs that provide real-time updates so that you can monitor progress and proactively manage risks.
- Focus on Presentation using the right charts and maps: Since the dashboard aims to present complex data in a digestible format, judicious use of charts and maps will only lead to better insights. Also, labels, titles, or descriptions should be added to give context to the data and make the interpretation much easier.
- Intuitive design: To develop a fully functional and user-friendly financial dashboard, consider focusing on user-centric design principles to enhance its capabilities. Additionally, use consistent design elements like layout, color schemes, and fonts to make it look professional.
- Data Accuracy is the key: Major strategic decisions depend on the data points presented through the dashboard. You need to keep the dashboard current with all real-time updates to ensure accurate information is used to frame decisions that impact the high-level objectives.
Conclusion
Financial dashboards are key in understanding the dynamics and complexities of financial decisions to ensure stability and growth. Using the right data visualization tool, you can track the crucial financial KPIs related to budget, revenue, and profits through a consistent design layout. This reduces the time financial analysts spend hovering over the custom reports and spreadsheets. Finally, Mockup’s capabilities can enable you to visualize data in a user-friendly dashboard where customized elements and visuals add to data-driven decision-making.

Frequently Asked Questions
A financial dashboard consistently includes elements like Key Performance Indicators (KPIs), visuals (charts and graphs), data integration, customization, and flexibility for aggregating the organization's financial performance.
With a centralized view of key financial metrics, CFOs can leverage real-time information that drives strategic planning and crucial financial decisions.
Multiple tools, such as Mokkup, Tableau, Microsoft Power BI, Qlik Sense, and more, can be used to create finance dashboards.
Yes, there are free finance dashboard templates that you can use to visualize data with basic capabilities. For more advanced visualizations, you can update to Pro to get a more profound sense of your financial data.
Prompt it. Wireframe it with Mokkup.ai.
