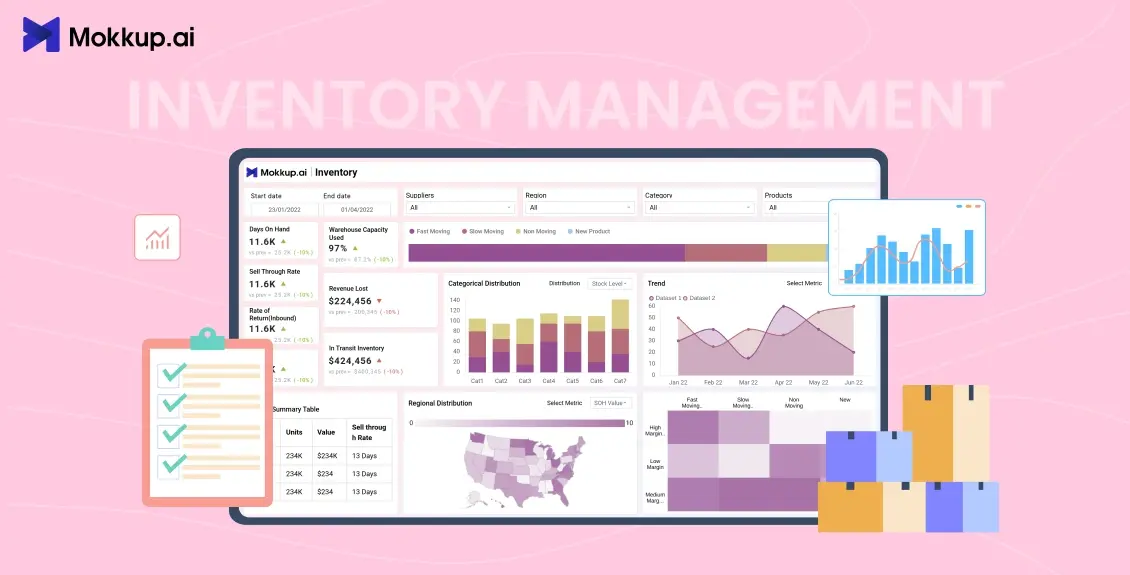
Inventory is unforgiving. If you run out of stock, customers will leave frustrated. If you order more than you need, your money will sit idle on shelves. Relying only on spreadsheets or outdated reports will usually be too late to fix the problem.
This is why businesses are turning to an inventory management dashboard. Done right, it doesn’t just show stock levels. It clarifies what’s moving, what’s stuck, and where the risks are. All this gives inventory managers the control they’ve been missing.
This guide walks you through a step-by-step flow on how to build inventory dashboards that go beyond basic reporting. We’ll cover how to integrate SQL queries data, track the right inventory KPIs, and set up real-time inventory tracking that helps you make smarter decisions.
Table of Contents
- Why Create an Inventory Management Dashboard?
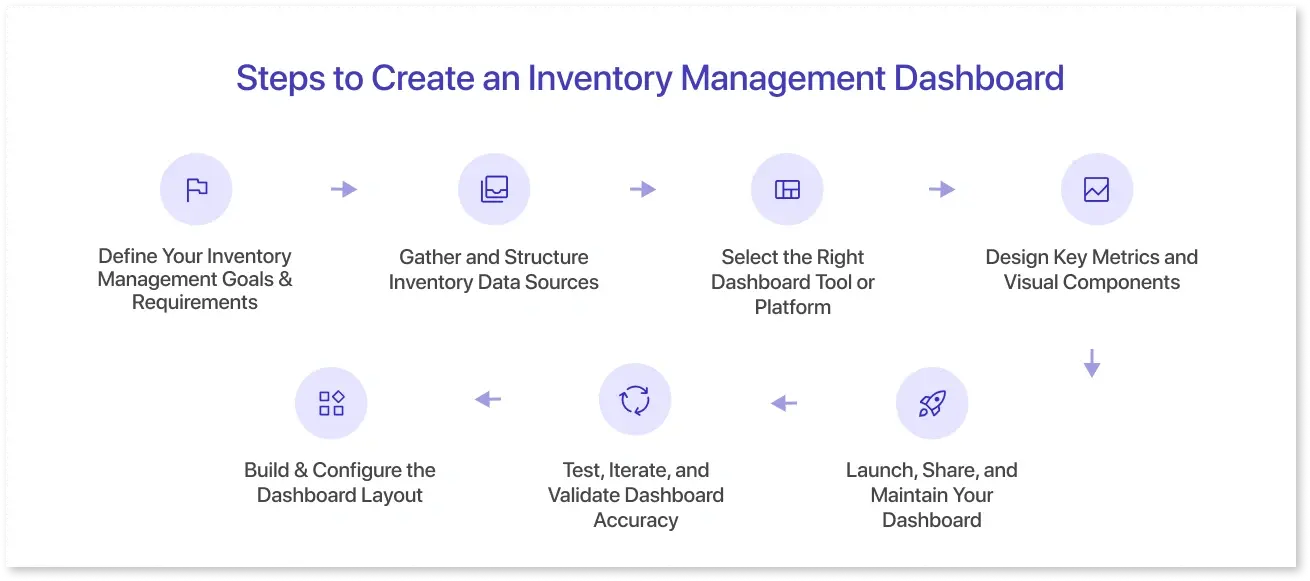
- Steps to Create an Inventory Management Dashboard
- Best Practices for Inventory Dashboard Success
Why Create an Inventory Management Dashboard?
The reason is simple: no business can afford to “guess” when it comes to inventory. A McKinsey study found that demand and supply planning are the top two priorities for digital investments. Fifty-eight percent of respondents in the same study accept prioritizing inventory optimization.
That’s a direct indicator of strong demand for digital inventory solutions like an inventory management dashboard.
With it, businesses:
- See real-time stock levels across every location.
- Spot slow-moving or dead stock before it eats into margins.
- Plan reorder points based on data, not gut instinct.
- Reduce manual reporting and free up teams for analysis.
- React faster when demand spikes or supply is disrupted.
In other words, an inventory management dashboard template helps businesses track inventory as well as manage risk.
Steps to Create an Inventory Management Dashboard
The steps to build inventory dashboards are about creating a tool people can actually use to make quicker, better decisions. Every step matters, from setting clear goals to choosing the right visuals. If you skip one, you risk ending up with a dashboard that looks good but doesn’t really help in daily operations.
Step 1: Define Your Inventory Management Goals & Requirements
The first step starts by asking yourself- Why do you need this dashboard?
For some, the goal is to reduce stockouts. For others, it’s about cutting down on carrying costs or getting visibility into multi-warehouse operations. Without clarity, you’ll build inventory dashboards that look impressive but don’t solve real problems.
At this stage, talk to the people who will be using the dashboard. A warehouse manager cares about SKU-level alerts, while leadership wants top-line KPIs. Capture both needs so you don’t build a one-sided view. This groundwork prevents wasted effort later.
Step 2: Gather and Structure Inventory Data Sources
Once goals are set, the next challenge is data. Inventory touches many systems, like ERP, warehouse management, procurement, and sales. Each system uses its own codes and formats, meaning raw exports often don’t align. For example, when SQL queries data, it helps you pull and merge different streams into one clean, consistent structure.
Gathering and structuring data via suitable tools helps merge these data streams into a clean, consistent structure. Standardize SKU codes, align units of measurement, and tag exceptions like damaged or backordered goods. If this sounds tedious, that’s because it is. But skipping it guarantees errors later. An Inventory management dashboard built on messy data is worse than no dashboard.
Step 3: Select the Right Dashboard Tool or Platform
The platform you pick will shape how effective and flexible your dashboard becomes. Many teams prefer building an inventory management dashboard for Power BI or Tableau since they’re industry standards. But they’re not always the easiest starting point, especially if you need quick prototypes or want non-technical users involved. That’s where Mokkup.ai stands out.
With it, you can generate dashboard wireframes instantly using a simple AI prompt, start with ready-to-use inventory management dashboard templates for Power BI and Tableau, or even build layouts from scratch using drag-and-drop.
Teams can customize designs in real time, make edits directly on shared screens, and then export the final wireframe into BI tools like Power BI or Tableau for advanced analytics. With such features, you get the flexibility, speed as well as variety to make the design phase less burdensome.
Step 4: Design Key Metrics and Visual Components
Deciding key metrics that maximize a dashboard’s impact is a crucial step. Pick the wrong metrics and you’ll overwhelm users with noise. The proper inventory KPIs give clarity:
- Inventory Turnover Ratio shows how efficiently stock moves.
- Days Sales of Inventory reveals how long items sit unsold.
- Stockout Rate signals gaps in demand fulfillment.
- Carrying Costs quantify the price of holding excess inventory.
Now match these to visuals. Use line charts for trends, warehouse space heat maps, and reorder points alerts. Keep the design clean, as your goal is clarity, not decoration. Implement dashboard UI best practices to ensure high-quality output.
Step 5: Build & Configure the Dashboard Layout
A dashboard is not a dumping ground for charts. The layout needs structure. Start by grouping related metrics. For example, turnover, DSI, and stockouts can live in one section. Place critical data dashboard KPIs at the top so they’re visible without scrolling.
Color coding matters, too. Use consistent signals, like green for healthy and red for risk. Another often-overlooked step is role-based views. While executives don’t need SKU-level details, warehouse staff might. Thus, configure views by role to make the Inventory dashboards far more usable.
Step 6: Test, Iterate, and Validate Dashboard Accuracy
Don’t fall in love with your first draft. It will almost always be wrong somewhere. Cross-check the numbers with your ERP reports. Check if the SQL queries' data outputs correctly. And if you really want peace of mind, compare it with actual physical counts in the warehouse.
Next, present it to the people who’ll use it daily. Check if they understand the story the charts tell, or if alerts go off at the right time. A dashboard that impresses developers but leaves warehouse staff scratching their heads won’t last long.
Once you figure out the loopholes, test and tweak your Inventory management dashboard templates accordingly. Such feedback-based iteration makes a huge difference in the life cycle of your data dashboard.
Step 7: Launch, Share, and Maintain Your Dashboard
A dashboard is only valuable if people use it. When launching, don’t just send out a link. Spend some time training teams on how it helps them day to day. Show how it saves reporting time or prevents costly stockouts. Adoption will climb when users see personal benefit.
But launch is not the finish line. Inventory systems evolve. New SKUs appear, new warehouses open, and business models change. Schedule quarterly reviews to update KPIs and validate accuracy. Make sure your inventory dashboards adapt with time.
Best Practices for Inventory Dashboard Success
In addition to the above steps to create an effective Inventory management dashboard, you can try to follow some best practices that further strengthen the chances of your dashboard's success.
Some of these practices are:
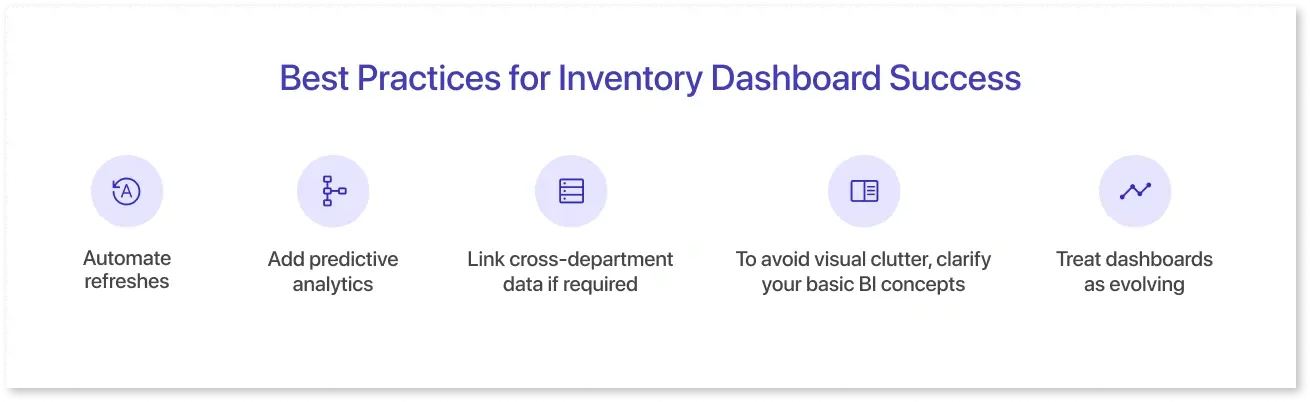
- Automate refreshes so you’re always working with real-time inventory tracking.
- Add predictive analytics to inventory management systems, like Walmart and Target. As per Business Insider, these retail giants are already using AI based predictive analytics to prevent stockouts and manage inventory.
- Link cross-department data if required. For instance, procurement lead times and sales forecasts can be paired to give a more realistic view.
- To avoid visual clutter, clarify your basic BI concepts, such as the difference between charts and graphs, to pick the right visualization.
- Treat dashboards as evolving. Look for inspiration in other established dashboard examples that changed the game for businesses.
Conclusion
An inventory management dashboard is more than charts. It’s a control system for your business. It brings together messy, scattered data and makes it usable. Follow the seven steps –set goals, structure data, choose the right tool, design smart KPIs, configure layouts, test thoroughly, and maintain regularly—and you’ll end up with something far more powerful than a report: a decision engine. Beginner-friendly dashboard designing tools like Mokkup make this process simpler by offering ready-to-use templates, drag-and-drop design, and instant export to platforms like Power BI and Tableau. Following the right process and toolkit is the key to build effective inventory dashboards in 2025.
Frequently Asked Questions
It centralizes real-time stock data, highlights issues like stockouts or overstocking, and tracks inventory KPIs to guide better decisions.
Start with clear goals and clean data using SQL queries, and then build using a BI tool that suits your team’s needs, such as Power BI, Tableau, or Mokkup.ai.
Key ones include turnover ratio, days' inventory sales, stockout rate, carrying costs, and reorder alerts. Choose those that match your business objectives.
Power BI and Tableau are widely used, while Mokkup is strong for prototyping and design. The best choice depends on complexity, integrations, and user skills.
By pulling data in real-time, dashboards expose mismatches quickly, reduce reporting delays, and provide alerts that keep teams ahead of errors.
Prompt it. Wireframe it with Mokkup.ai.
