
You choose a BI tool, plan the rollout, and set expectations high. But even with all the right pieces in place, sometimes, dashboards gather dust, users grow frustrated, and teams quietly revert to spreadsheets.
The reason usually traces back to a few common BI implementation mistakes that aren’t always obvious at the start but have a lasting impact.
This article explores those mistakes in depth. Not just the ones you’ll find in manuals, but the subtle challenges that derail BI projects even in the most data-driven teams. Avoiding them is easier when you know what to look for.
Table of Contents
- What is BI Implementation and Why It’s Crucial for Success?
- Why Do BI Implementations Fail: Common Challenges
- How Wireframes Help Prevent BI Implementation Mistakes?
- How Does Mokkup Streamline BI Dashboard Planning and Collaboration?
- Best Practices for a Successful BI Implementation
What is BI Implementation and Why It’s Crucial for Success?
BI implementation stands for Business Intelligence Implementation. It means setting up the right tools, processes, and teams to turn raw data into something useful for a team to act on. But it isn’t just about installing software. It involves defining business goals, preparing data sources, building dashboards, and ensuring the right people can easily use them.
For example, a retail company facing inconsistent inventory levels can implement BI to set up suitable tools that track real-time stock data across all inventories. As a step further, it can also build a personalized dashboard that shows actionable insights like best-sellers, seasonal trends, and possible supply-chain delays, in one view.
If done right, BI implementation helps organizations make informed decisions, improve operational efficiency, and drive revenue growth. However, if BI implementation challenges overtake the process, it may backfire and cause delays, losses, and bad decisions.
In a world where gut instinct is insufficient, more organizations are turning to structured, data-driven approaches. Strong BI solutions set the stage for that shift by reducing the risk of project failures and improving the impact of data visualization tools.
Why Do BI Implementations Fail: Common Challenges
When BI projects don’t meet expectations, it's rarely because of the software. It’s usually a mix of mistakes like poor planning, unclear goals, or a team disconnect.
Below, we explore these common BI implementation mistakes, some obvious and others less so. But all can spoil the results of even the most promising BI initiatives.
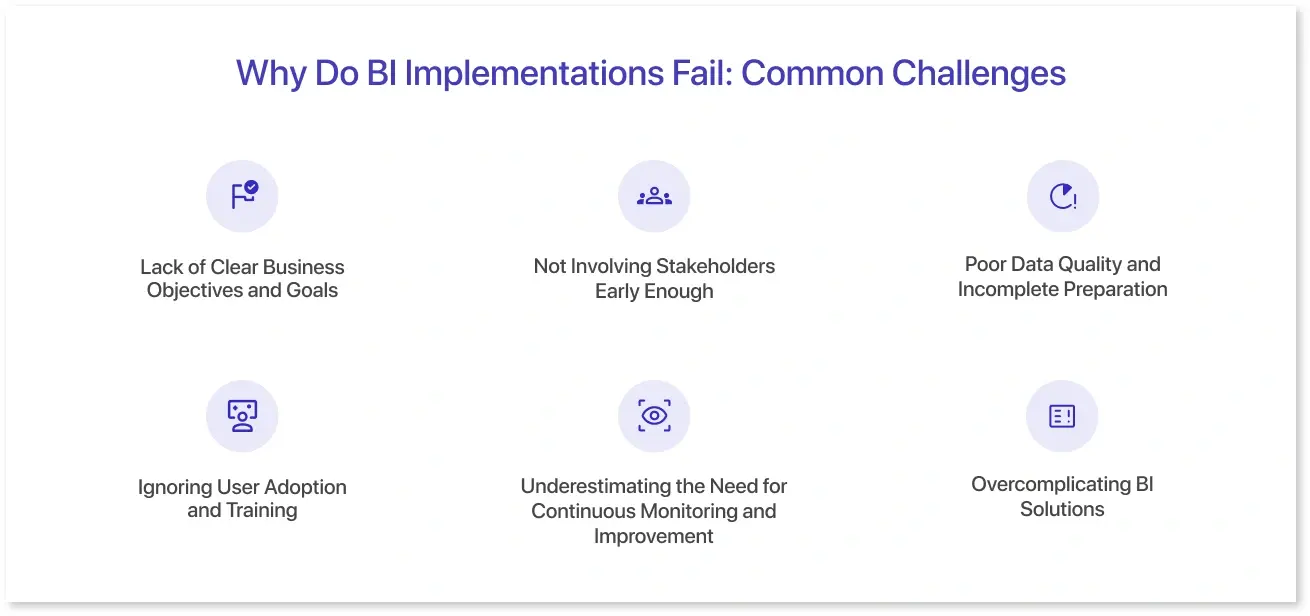
1. Lack of Clear Business Objectives and Goals
Not having a clear idea of the goals is a basic yet most repeated BI implementation mistake because teams often skip defining what they’re trying to achieve. Due to this lack of clarity around outcomes, it becomes easy to fall into the trap of building dashboards that look complete on the surface but offer little value when it’s time to make decisions.
For example, consider a fast-growing SaaS company that set out to create a “performance dashboard” for its support team. The project had a budget, tools, and executive backing, but no one clearly defined “performance.” Was it faster resolution times, higher CSAT scores, or fewer reopened tickets? Then the team might end up with a flashy BI dashboard that showed everything but solved nothing.
This is how confusion begins:
- Business questions aren’t asked and written down.
- KPIs are selected based on the database instead of what matters to decision-makers.
- No one has a clear answer for the expected alignment between the dashboard and the decisions it’s expected to support.
Such gaps in the initial discovery phase can create costly BI implementation challenges later. A BI dashboard isn’t helpful unless it answers a fundamental question someone in the business needs answered.
2. Not Involving Stakeholders Early Enough
BI isn't just a data team work. It's a business initiative to uplift operations, marketing, finance, and more. Yet too often, BI projects begin in isolation, involving only technical teams instead of people who will actually use the dashboards later. As a result, dashboards miss the mark.
Moreover, a lack of clear communication between business teams and BI developers may deepen the disconnect. For instance, stakeholders might expect revenue to be calculated with specific fields included or excluded, like ignoring refunds or internal transfers. If that expectation isn’t clearly communicated, developers might make assumptions that lead to incorrect metrics. When feedback comes in, it's either too late or too expensive to fix. This disconnect is one of the most common BI implementation mistakes.
Bringing stakeholders in early helps avoid this rework and ensures that dashboards match real workflows. Thus, to work on avoiding BI mistakes, start by inviting the right voices into the room at every crucial discussion.
3. Poor Data Quality and Incomplete Preparation
No matter how robust your BI tool is, the insights will be flawed if the data it pulls is insufficient, outdated, or incorrect. Still, this is where many teams cut corners.
Let’s say you’re a retail chain trying to analyze store-level sales performance. However, your customer records contain duplicate IDs, the timestamps in your data are in different formats, and some stores categorize product returns differently. All these inconsistencies can quietly make the BI implementation unreliable because the analyzed data is of poor quality. And it’s not a minor issue. Gartner estimated that poor data quality leads to an average annual loss of over $12.9 million for organizations. Yet this is still one of the most common pitfalls in BI implementation.
Clean and correct data isn’t just a best practice. It’s the foundation of any successful BI project.
4. Ignoring User Adoption and Training
Even the cleanest dashboards will go unused if teams don’t understand how to use them or don’t see the value.
This issue arises when the builders assume that once the dashboard is live, professionals will naturally start using it. In reality, that rarely happens without a structured adoption plan.
Warning signs include:
- Users are still exporting everything into Excel.
- Teams are continuing to request manual reports from analysts.
- Leaders are bypassing dashboards for outdated methods.
A tailored training program to drive adoption helps avoid that. The program should include short videos, hold Q&A sessions, and assign internal experts to support their peers. It also helps to give users the tools they need to feel confident while using the dashboard. A simple data dictionary that explains what each metric actually means can go a long way in clearing confusion. Alongside that, a basic user manual with step-by-step guidance on things like filtering, drilling down, or exporting data gives users something to fall back on when they’re stuck. These strategies build confidence and reduce resistance, making adopting BI tools smoother and easier for teams. Remember, change is hard. Without the right support, users will quietly reject the new system and return to old habits.
5. Underestimating the Need for Continuous Monitoring and Improvement
Many teams approach BI implementation like a one-time procedure. They set up systems, train users, and move on. But BI is dynamic. Metrics evolve, teams change, and questions shift. Without ongoing reviews, dashboards become outdated, and KPIs lose relevance.
Signs of neglect include:
- Dashboards still show old product lines or outdated geographies.
- Stakeholders complain they don’t trust the analysis anymore.
- Teams become unable to update and find relevant data with the expected efficiency.
To avoid such decay, treat BI like a product, set up review cycles, and keep evolving your dashboards. Ask for user feedback every quarter. These steps keep your work relevant and valuable.
6. Overcomplicating BI Solutions
The key purpose of BI is to facilitate data-based decision-making. But sometimes, teams go overboard and build dashboards packed with dozens of unnecessary filters and elements that no one asked for. This kind of overdesign leads to what’s often called analysis paralysis.
Here’s where Dashboard wireframing helps. Sketch the dashboard before development begins and clarify the question each screen should answer.
Following a standard wireframe design guide helps you focus on purpose over aesthetics. If you're unsure how to avoid BI mistakes like visual clutter, ask users what they actually need to see. Sometimes, less is truly more.
These are some of the most common BI implementation mistakes that initially seem small but grow into real blockers. Understanding these BI implementation challenges is the first step toward knowing how to avoid BI mistakes in your own organization. Whether you're dealing with Challenges faced in Power BI or working with other Data Visualization tools or softwares, one thing is consistent: good implementation comes from clarity, structure, and a strong focus on people and data.
How Wireframes Help Prevent BI Implementation Mistakes?
Many BI teams skip wireframes because they assume dashboards can be built on the go. But that often leads to rework, missed expectations, delays, and confusion later. Wireframes solve this early. They help your team agree on layout, flow, and priorities before the design or development phase begins.
This simple step gives both developers and business users something tangible to discuss. Instead of vague requests, teams can point, adjust, and align. It’s one of the most overlooked business intelligence implementation tips, yet it directly avoids common pitfalls in BI, like overengineered visuals or misaligned KPIs.
If you’re building in Power BI or similar tools, wireframes also make the development process smoother. You’re no longer guessing what the end user wants; you already know.
Platforms like Mokkup.ai make this even easier. You can create dashboard wireframes, work on them with your teams, and export the final version to your preferred BI tool. It reduces the friction between the idea and execution.
Wireframes don’t just save time. They save entire projects from going off track.
How Does Mokkup Streamline BI Dashboard Planning and Collaboration?
Many issues in BI projects begin long before development, often during planning, layout design, or handovers between teams. This is where Mokkup.ai comes in. It's built to simplify those early steps that typically go overlooked but make a big difference later.
- Create dashboard wireframes quickly: Instead of starting from a blank screen, teams can map out layouts early, agree on what matters, and avoid misaligned builds later. To speed things up, they can leverage Mokkup’s AI feature to generate dashboard wireframes instantly using simple prompts. This accelerates the design process, helps teams visualize ideas quickly, and ensures everyone is on the same page before development begins. Soon, Mokkup will let them easily ideate dashboard concepts from scratch as well.
- Use templates built for real industries: Mokkup offers ready-made wireframe templates tailored for domains like retail, SaaS, logistics, and healthcare, helping teams focus more on what to measure and less on how to design.
- Work together in real time: Business and data teams can collaborate directly on the wireframe. This cuts down on back-and-forths and ensures the dashboard fits actual workflows.
- Export straight into BI tools: Once aligned, teams can push wireframes into tools like Power BI or Tableau, reducing manual rework.
- Prompt-based wireframes (coming soon): A new Gen AI feature that allows users to create dashboard drafts using just a prompt, removing the need for design research.
Lack of early planning is why Harvard Business Review lists user alignment and planning as leading causes of BI project failure. Data from Kantata shows that 71% of projects miss their goals on time, on budget, or on scope. Mokkup's above features address these two common BI project failure drivers before they become a problem.
Best Practices for a Successful BI Implementation
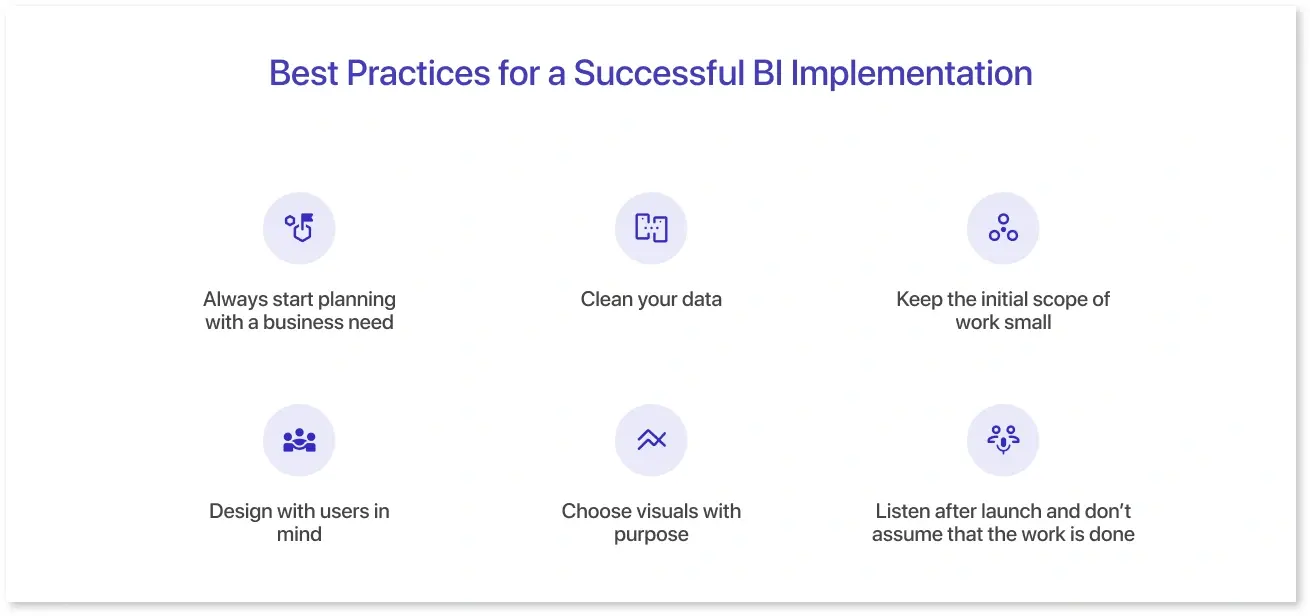
The most common pitfalls in BI happen when teams skip the basics. Avoiding them requires sticking to some best practices, like:
- Always start planning with a business need. Don’t begin with tools or data. First, figure out the question your BI should help answer.
- Clean your data, as messy inputs will fail even the best dashboards. Invest time in getting your sources consistent and data reliable.
- Keep the initial scope of work small. Focus on one clear use case. Get that right before expanding to multiple objectives.
- Design with users in mind. Whether a manager uses a Power BI dashboard or a field executive checks mobile reports, the dashboard layout should match how they work.
- Choose visuals with purpose. There are certain things to remember when choosing visualizations for a dashboard that help you pick charts that clarify insights rather than confuse them.
- Listen after launch and don’t assume that the work is done. Set up regular check-ins or surveys to catch what’s not working.
Conclusion
BI projects don’t fail overnight, but they go off course gradually. A missed conversation with a stakeholder, a vague metric, or a cluttered dashboard can quietly snowball into a tool nobody uses. However, these common BI implementation mistakes are avoidable. Good planning, clear priorities, clean data, and continuous iteration set successful BI rollouts apart. Wireframe designing platforms like Mokkup.ai help teams align early by clarifying layout, key questions, and user needs before building begins. That step alone can mean distinguishing between a forgotten report and a dashboard that drives real action.
Frequently Asked Questions
When implementing business intelligence, avoid starting without clear goals, ignoring data quality, excluding key stakeholders, and overcomplicating dashboards. These mistakes can lead to low adoption and inaccurate insights.
BI wireframes help teams clarify requirements early, reduce rework, and align stakeholders before development begins. They offer a low-risk way to visualize layouts and ensure your dashboards are built around real decision-making needs.
Teams can reduce BI setup pitfalls by avoiding working on the technical aspects of the BI implementation right away. Instead, they should start with clear business questions, simplify visuals, and clean the data.
Yes. Mokkup.ai is explicitly built to help teams design BI dashboard wireframes. It offers ready-to-use templates, real-time collaboration, and seamless export to tools like Power BI, making the design process faster and more effective.
Yes. With Mokkup, teams collaborate on a shared wireframe, review it together, and finalize it before moving to tools like Power BI. This upfront clarity means fewer last-minute changes, misunderstandings, and less time spent redoing dashboards that miss the mark.
Prompt it. Wireframe it with Mokkup.ai.
