
What are BI Dashboards?
Business Intelligence (BI) dashboards are visual tools that help businesses understand and analyze their data quickly. They display key information like sales figures, customer trends, and performance metrics in an easy-to-read format. By using charts, graphs, and tables, BI dashboards make complex data more accessible and actionable. They help businesses make informed decisions by providing real-time insights and tracking important metrics. In short, BI dashboards are essential for monitoring business health, spotting trends, and guiding strategic actions based on data.
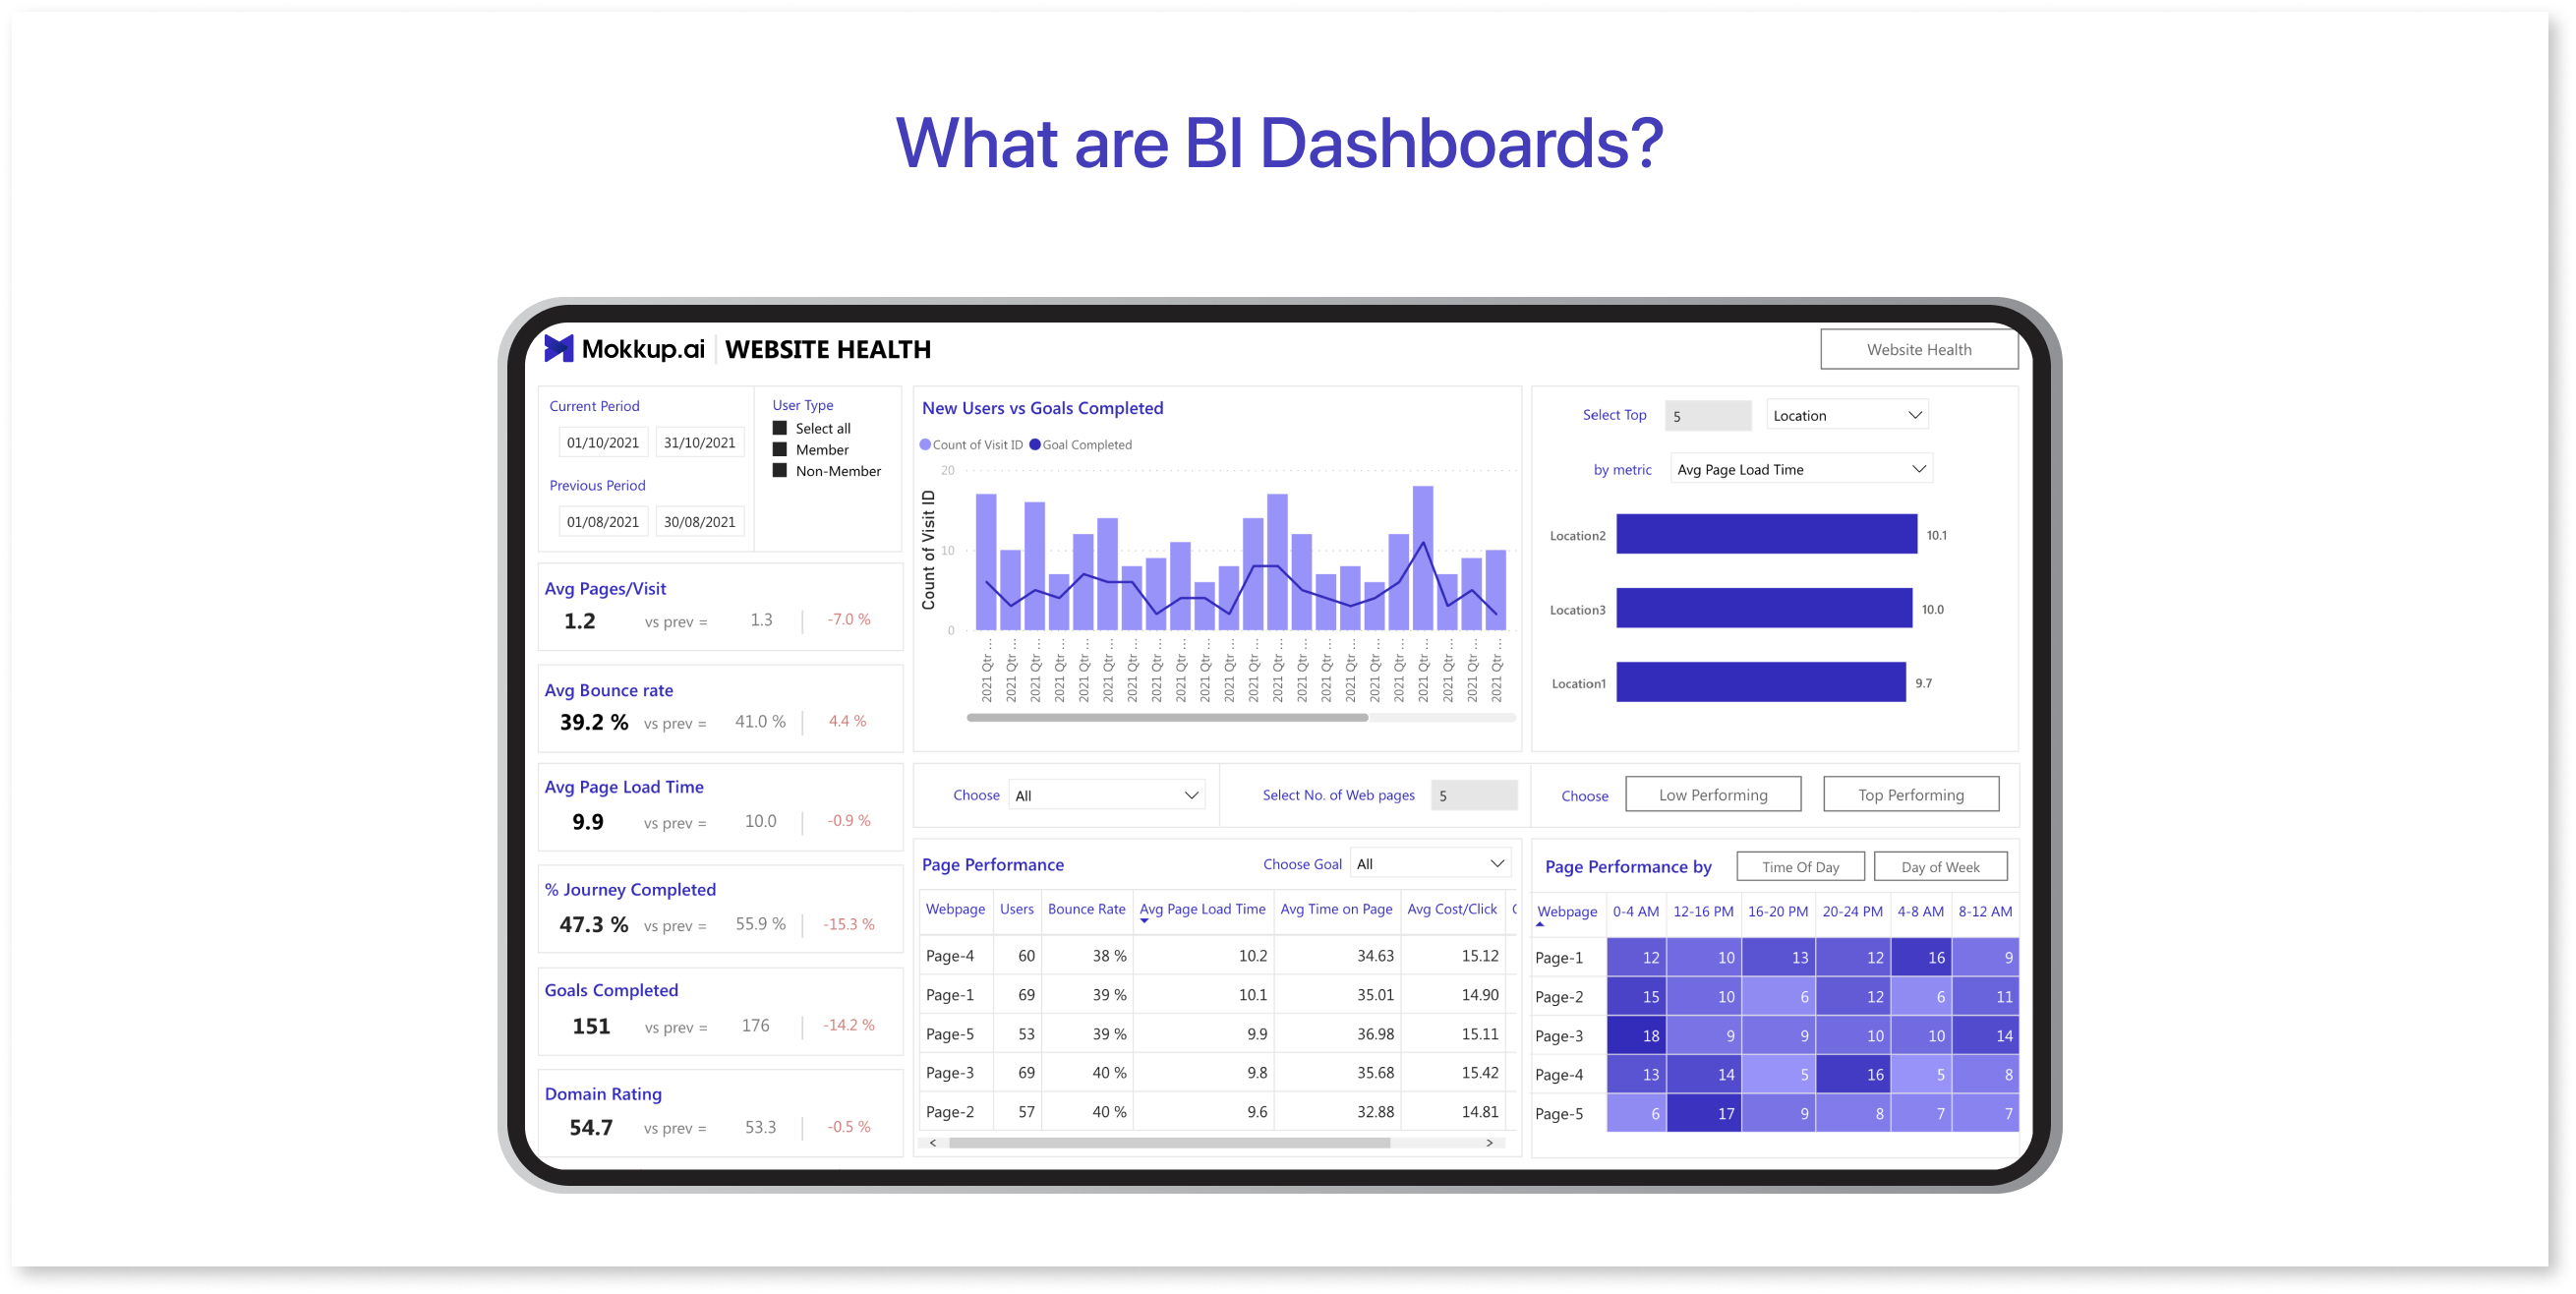
Table of Contents
- Importance of Business Intelligence Dashboards
- Types of Dashboards for Business
- Why are Dashboards Important?
Importance of Dashboards in Business Intelligence
Dashboards provide real-time insights into significant business ideas. They align everyone with the same accurate picture of business performance metrics, focusing on the significant impact. Making timely and informed decisions based on examining the company's actual position is vital for successful business administration. Hence, a business dashboard provides personnel with essential information using machine learning for better and quicker decision-making.
Let’s look at the three common and compelling cases for business intelligence and data visualization:
1) Convert Data into Information:
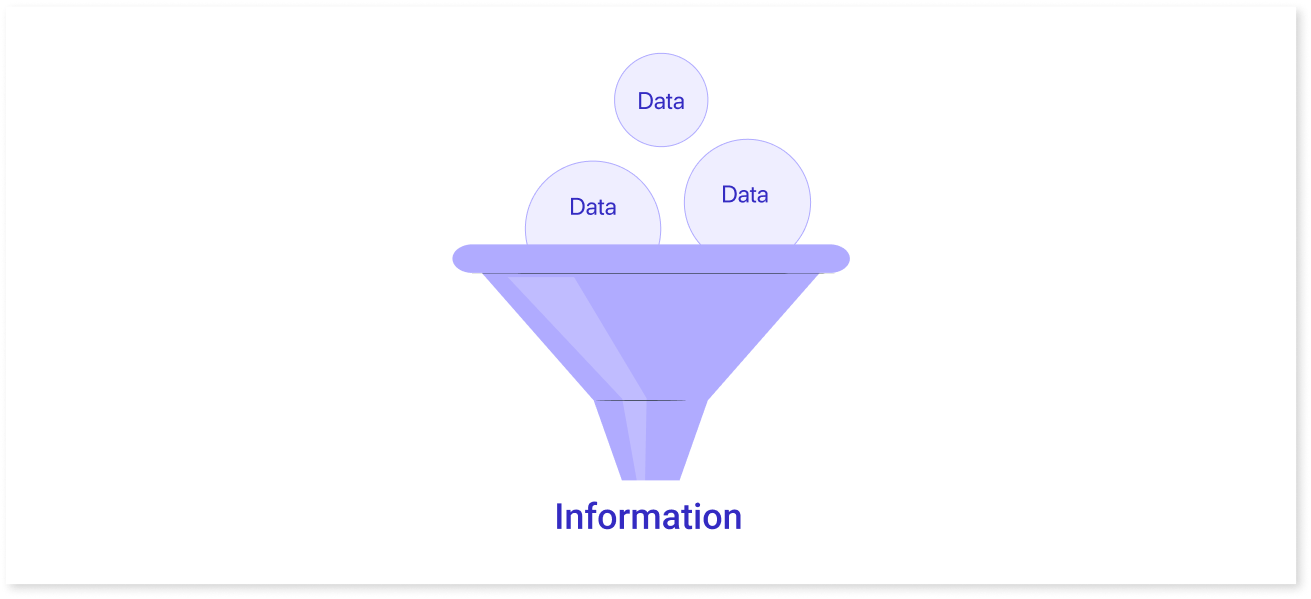
We agree that big data is a company’s most valuable asset. However, it’s often more challenging to convert this vast reservoir of data into actionable insights. A well-designed visual dashboard may give on-demand access to critical company information and can enlighten sales teams at all levels of the organization hierarchy.
2) Integrate & Automate Multiple Touch Points to Increase Efficiency:
A business plan needs crucial insights from different departments; therefore, it makes sense to collect information from multiple touch points. By reducing the time and effort required to log into several analytics platforms (such as Salesforce, Google Analytics, etc.), compile frequently stored data in different formats, and prepare data manually.
3) Consider Ways Your Dashboard Can Offer Real-Time Visibility for Optimization & Alignment:
The dashboard can offer real-time visibility for optimization and alignment by providing a centralized platform where relevant data is aggregated, processed, and displayed in an intuitive and user-friendly format. The dashboard can be configured to collect data from various sources, such as customer relationship management (CRM) systems, supply chain management tools, financial systems, social media platforms, and other data sources for customer lifetime value.
Types of Dashboards for Business
The dashboards can be divided into four general categories:
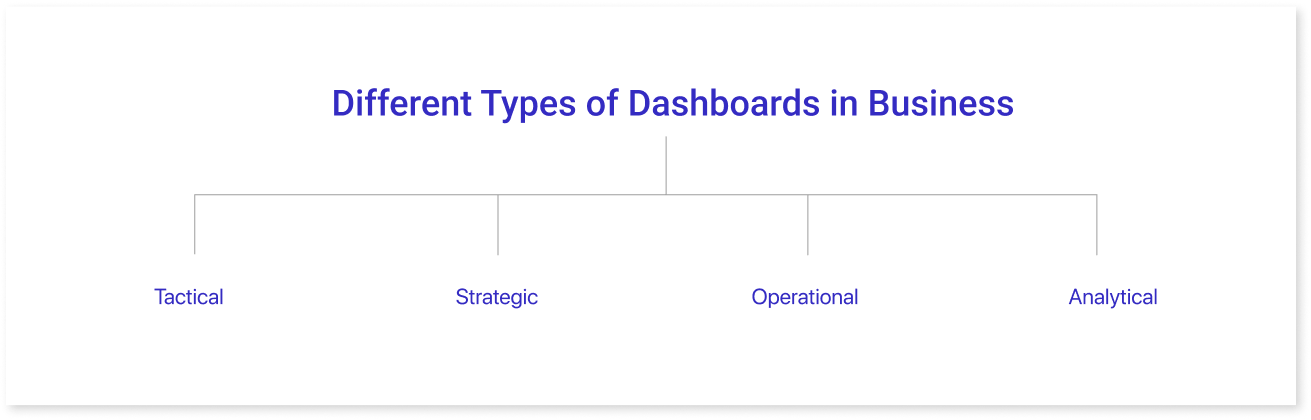
1) Tactical Dashboards:
Mid-level management analyzes and keeps track of processes with the help of a tactical dashboard. After that, a company successfully monitors the progress of its goal and provides analytical recommendations for future strategies. They are excellent for keeping an eye on the procedures that support the company's strategic goals and assist in making decisions. A few business dashboard examples are:
- Social Media Management Dashboard: It can help save time and effort to access and manage social media marketing through a single user-friendly interface while creating customized reports.
- HR Management Dashboard: An HR dashboard compiles vital performance indicators (KPIs) and records to monitor, evaluate, and report performance.
2) Strategic Dashboards:
Strategic dashboards track long-term organizational strategies and critical KPIs. They are typically complicated to create, impact a business on a large scale, and are primarily used by senior-level decision-makers. These dashboards typically present progress over predetermined periods, such as the previous month, quarter, or year.
- Management Strategic KPI Dashboard: Top managers frequently use strategic KPI reports to assess the organization's performance in critical areas.
- SaaS Management Dashboard: SaaS dashboards provide a way to identify strengths and weaknesses, spot data-driven trends, and make informed decisions to guide businesses toward success.
3) Operational Dashboards:
An operational dashboard helps monitor short-time operations and improve business performance.
- Inventory Management Dashboard: Inventory dashboards offer a live view of the amount of stock that a company currently has. Operations teams and warehouse managers can use this to plan new orders better and manage product availability.
4) Analytical Dashboard:
An analytical dashboard is a vital tool for analyzing and visualizing data, data scientists, and managers who need to make decisions and examine the performance of their business area.
- Financial Overview: An effective cash flow strategy can be achieved with the aid of a financial dashboard, which also makes it possible to track expenses, sales, and net profit margin in great detail to accomplish and surpass the organization's financial metrics.
- Procurement Dashboard: A procurement dashboard enables managers to effectively track, assess, and optimize all acquisition processes within a business.
Why are Dashboards Important?
Dashboards for business intelligence BI play a vital role in the organization and interpretation of data visualization. To begin with, they link users to crucial, quickly accessible information relevant to their business decisions. Additionally, a dashboard design is essential in visualizing various key performance indicators that every business requires. Lets us look at some of the benefits of dashboard reporting.
Key Benefits of Dashboards:
Dashboard reporting tools offer several advantages when used correctly and with the appropriate tools and experience.
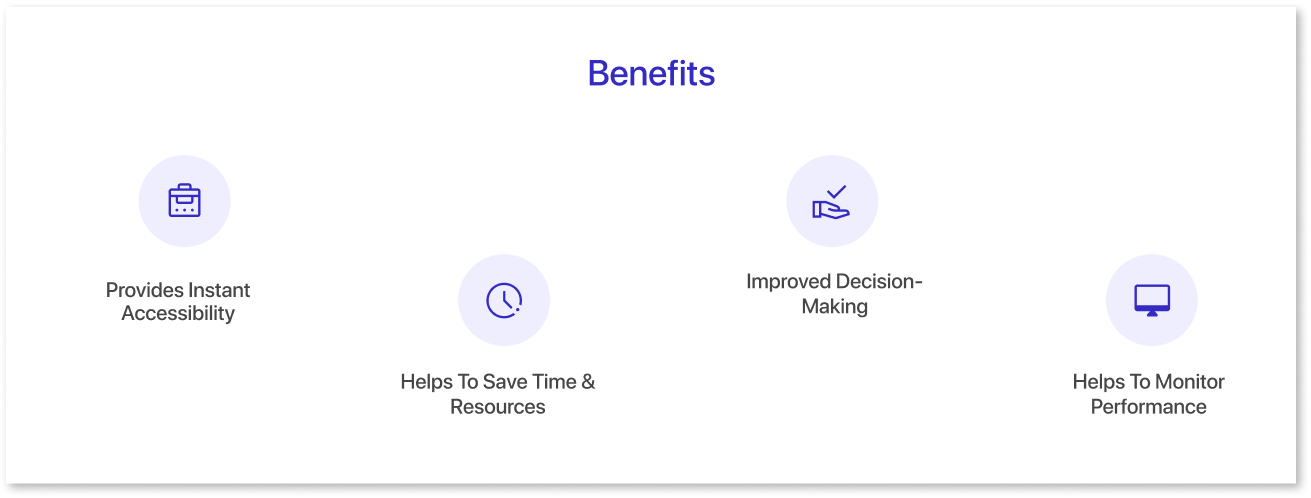
- Provides Instant Accessibility: Even the most complex key metrics can be easily read and interpreted with the help of good BI tools, which also offer on-demand visibility and insight. A dashboard provides current data. This allows you to monitor the app development and changes of a department or business operation. You no longer have to wait for a monthly report from data analysis.
- Helps To Save Time & Resources: Dashboard reporting displays up-to-date results for each report, saving valuable time and resources. It eliminates unnecessary hours spent on formatting individual reports or the need for technical assistance.
- Improved Decision-Making: Businesses can quickly decide what to do and take action when they have immediate access to information. There's no need to ask developers for data, wait for the data, get the report, and then try to act on it. Instead, dashboard reports are immediate and straightforward to share between users, allowing for the free exchange of information between essential parties.
- Helps To Monitor Performance: Identifying potential risks and opportunities can help you take proactive measures. This will help boost the overall success of your business. Using BI dashboard helps to make data-driven decisions that produce better outcomes, giving you a competitive edge in your industry.
Key Challenges of Dashboards:
While integrating dashboards into a business can offer several advantages, companies may overlook potential challenges and difficulties. Some issues may be immediately apparent, while others may only emerge after establishing a functional dashboard or reporting technology.
One major challenge when building dashboards is the lack of proper planning, which often slows down the process and leads to delays. Without wireframes, teams may jump straight into development without a clear visual layout, resulting in numerous iterations and revisions. This not only wastes time but can also lead to miscommunication between stakeholders. Wireframes act as a blueprint for dashboard design, allowing teams to visualize the final product before investing time and resources into development.
Mokkup's pre-built templates and drag-and-drop features make it easy to create detailed wireframes that showcase the structure, data flow, and design elements early on. This reduces guesswork, minimizes rework, and ensures that all stakeholders are aligned from the start. By clarifying expectations upfront, wireframes help speed up the design phase, significantly cutting down on development time and avoiding potential setbacks.
Let's examine a few of these potential challenges.
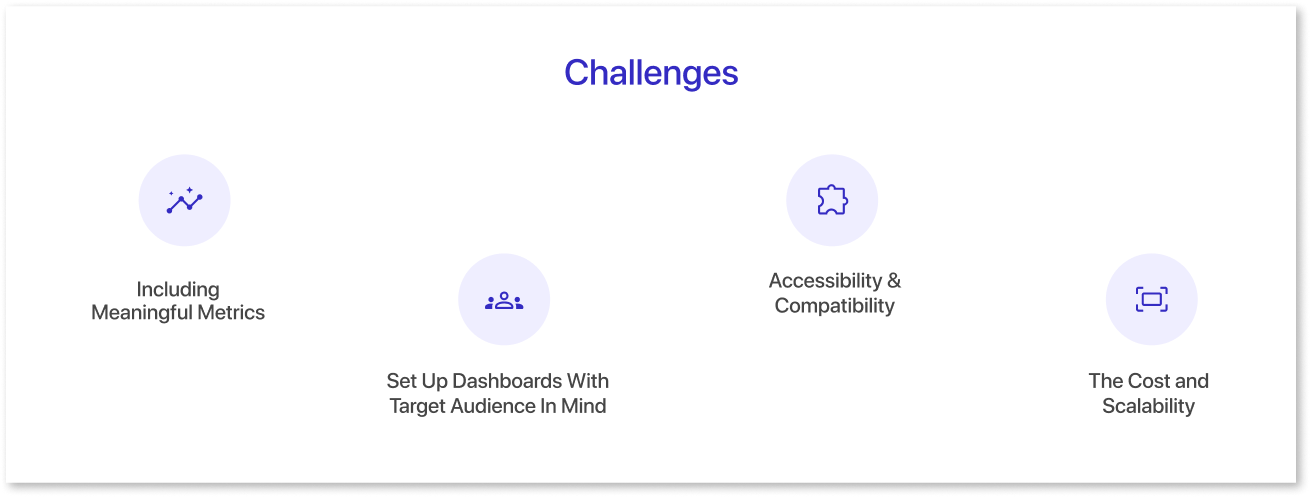
- Including Meaningful Metrics: Ensuring that your dashboard incorporates meaningful metrics is essential to measure performance effectively. It requires a clear understanding of the critical business intelligence analysis you wish to achieve. For instance, high-level metrics such as "net income" may not provide valuable information. Instead, consider more granular metrics as they can significantly impact the business's overall performance.
- Set Up Dashboards With Target Audience In Mind: When setting up dashboard reporting, companies should consider the end-users and design the dashboard to meet their unique needs. You must create the dashboard to provide valuable insights and data relevant to the user's organizational role and responsibilities. This successful business intelligence strategy guarantees that the dashboard is user-friendly and that the information displayed is clear and valuable.
- Accessibility & Compatibility: Dashboard accessibility and compatibility are crucial factors when implementing a dashboard reporting system. All authorized users should have quick access to the dashboard from any location or device. Business performance is improved by allowing users to access their dashboards while they are away. This enables them to make quick decisions based on current data.
- The Cost and Scalability: Cost and scalability are crucial factors when implementing a dashboard reporting system. The cost of setting up and maintaining the dashboard should fit within the organization's budget. There should be more benefits than costs. Scalability is also essential because the system must handle growing data collection as the company expands without losing performance.
Wrapping Up
As mentioned earlier, a well-designed dashboard's benefits outweigh the potential drawbacks. A good dashboard should enable users to access the information they need securely and automatically. This should be done either in real-time or close to real-time. With data visualization tools, users can create a business intelligence strategy, access critical information, website traffic and act on it quickly whenever needed.
Prompt it. Wireframe it with Mokkup.ai.
