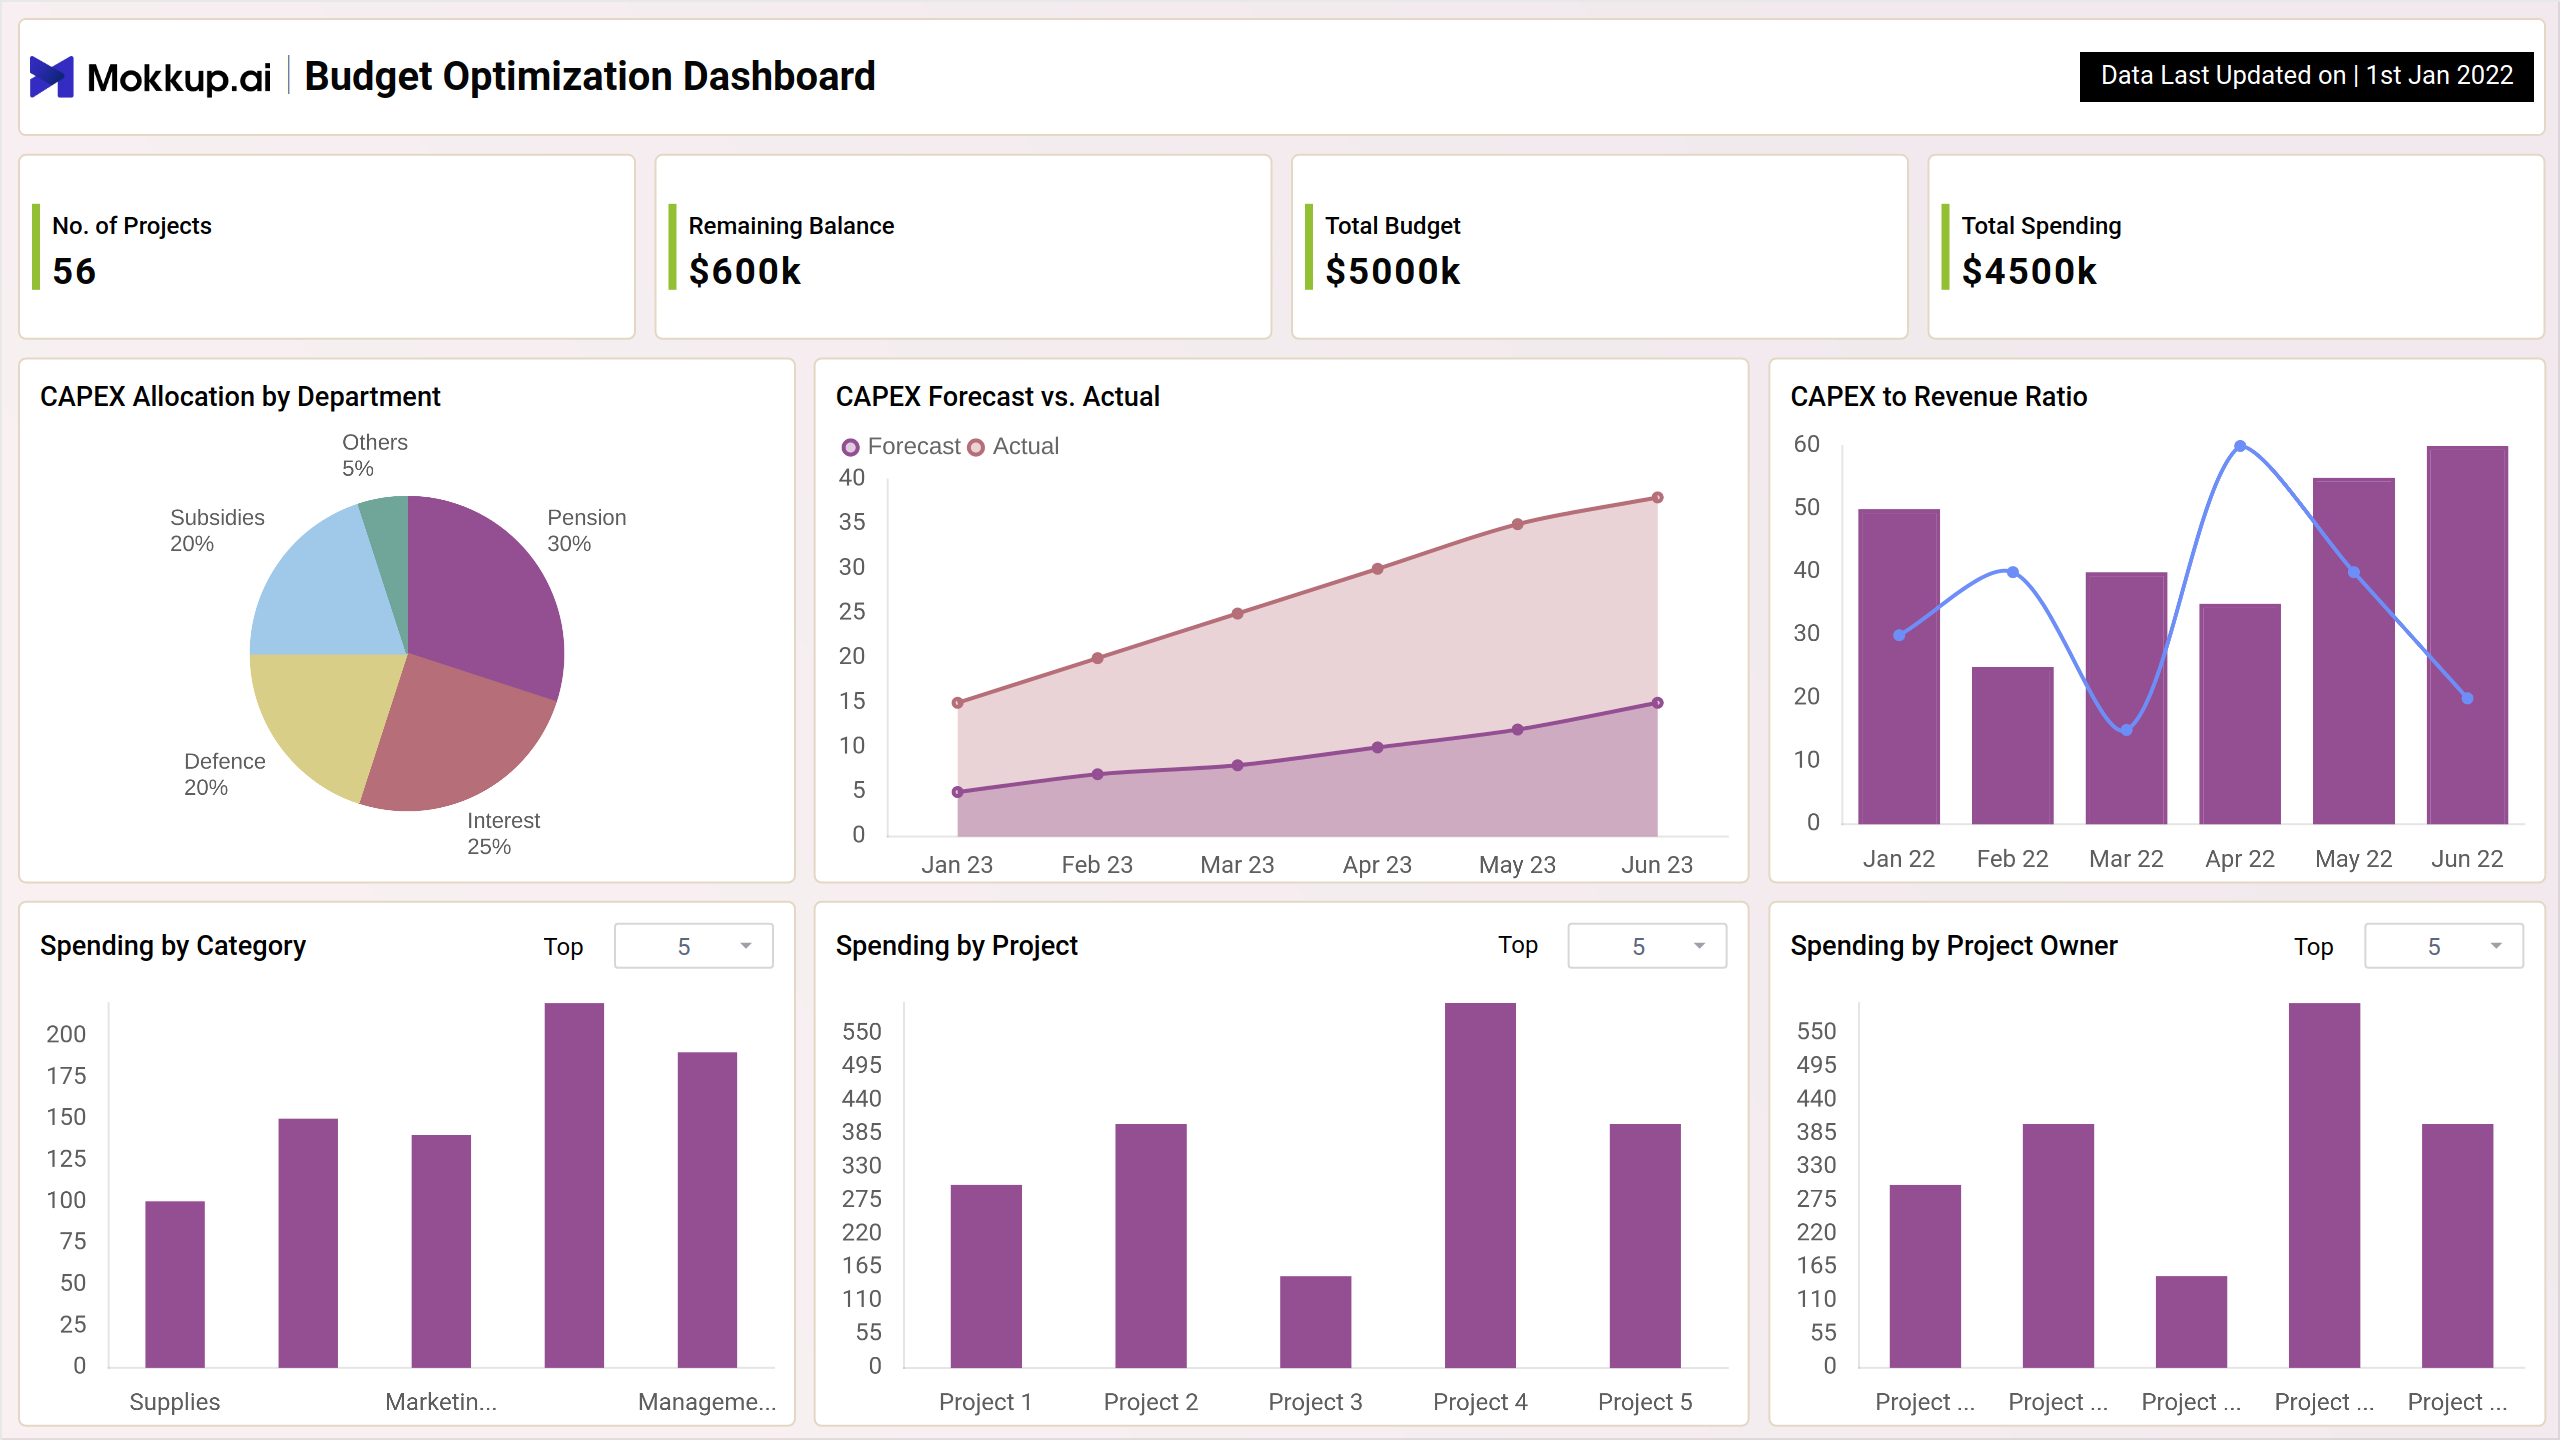
The Budget Optimization Dashboard template is a comprehensive template designed to help organizations track and manage their capital expenditures (CAPEX) effectively. By presenting key performance indicators (KPIs) such as the number of projects, remaining balance, total budget, and total spending, the dashboard wireframe offers a clear overview of financial health and budget utilization.
Key Terms to Know
- Number of Projects: Displays the total count of ongoing and completed projects.
- Remaining Balance: Shows the remaining balance in the budget after expenditures.
- Total Budget: Indicates the total budget allocated for projects.
- Total Spending: Reflects the total amount spent from the budget.
- CAPEX Allocation by Department: Visualizes the distribution of capital expenditures across different departments.
- CAPEX Forecast vs. Actual: Compares forecasted CAPEX against actual spending over time.
- CAPEX to Revenue Ratio: Illustrates the ratio of capital expenditures to revenue using a combination of columns and a line chart.
- Spending by Category: Breaks down spending into various categories, for example equipment, infrastructure, and services.
- Spending by Project: Shows spending for individual projects, allowing for detailed project cost analysis.
- Spending by Project Owners: Displays spending attributed to different project owners, helping to identify spending patterns and responsibility areas.
Budget - Screen 2
Screen 2 of the Budget Optimization Dashboard wireframe focuses on detailed project information, providing stakeholders with an in-depth view of individual project finances and status.
Key Terms to Know
- Name: Lists the names of all projects, providing an easy reference to identify each project.
- Department: Indicates the department responsible for each project, helping to understand departmental involvement and resource distribution.
- Category: Specifies the category of the project, such as infrastructure, technology, or operations, offering insights into the nature of expenditures.
- Budget Allocated: Shows the budget allocated to each project, enabling users to see the initial financial commitment.
- Spending: Displays the amount spent on each project to date, helping to track actual expenditures against the budget.
- Balance: Indicates the remaining balance for each project, calculated by subtracting spending from the allocated budget.
- Status: Provides the current status of the project, such as ongoing, completed, or on hold, to monitor progress and identify any delays or issues.
- Project Head: Lists the name of the project head or manager responsible for overseeing the project, facilitating accountability and contact.
Budget - Screen 3
Screen 3 of the Budget Optimization Dashboard wireframe provides an overview of revenue metrics and performance, helping stakeholders understand revenue generation and customer behavior. By presenting key performance indicators (KPIs) such as total revenue, total units sold, and average revenue per customer, this screen offers valuable insights into financial outcomes and customer value.
Key Terms to Know
- Total Revenue: Shows the total revenue generated over a specific period.
- Total Units Sold: Indicates the total number of units sold, providing insight into sales volume.
- Average Revenue per Customer: Reflects the average revenue generated from each customer, helping to assess customer value and spending behavior.
- Average vs. Speculated Revenue: Visualizes the comparison between actual revenue and speculated (forecasted) revenue over time.
- Revenue by Channel: Displays the distribution of revenue across different sales channels (e.g., online, retail, direct sales) in a pie chart.
- Revenue by Category: Shows the breakdown of revenue by product or service categories. This pie chart helps in understanding which categories contribute the most to overall revenue.
- Monthly Recurring Revenue: Tracks the monthly recurring revenue (MRR) over time.
- Average Revenue per Customer: Illustrates the trend of average revenue per customer over time.
- Year-over-Year (YoY) Revenue Growth: Displays the year-over-year revenue growth, helping stakeholders assess long-term growth trends and performance improvements.
Dashboard Template Insights
Gain comprehensive insights into budget allocations, spending, and project performance.
- The dashboard wireframe provides a detailed view of budget allocations, spending, and remaining balances across projects and departments for efficient financial management.
- Stakeholders can monitor project performance and track spending against budgets through a project details table, ensuring better oversight.
- Visualizations, including pie and stacked area charts, show CAPEX distribution and actual versus forecasted spending to optimize resource allocation.
Conclusion
The Budget Optimization Dashboard template is essential for the organizations seeking to optimize their financial management processes. By providing comprehensive insights into budget allocations, spending patterns, revenue performance, and project details, the dashboard wireframe helps stakeholders to make informed decisions, enhance resource allocation, and achieve financial objectives.