The Financial Ratios Report Dashboard template is designed to provide a comprehensive overview of key liquidity ratios, essential for assessing the financial health and operational efficiency of an organization. By tracking these ratios over time and comparing them to target values, the dashboard helps stakeholders identify trends, make informed decisions, and ensure the organization maintains optimal liquidity levels.
Key Terms to Know
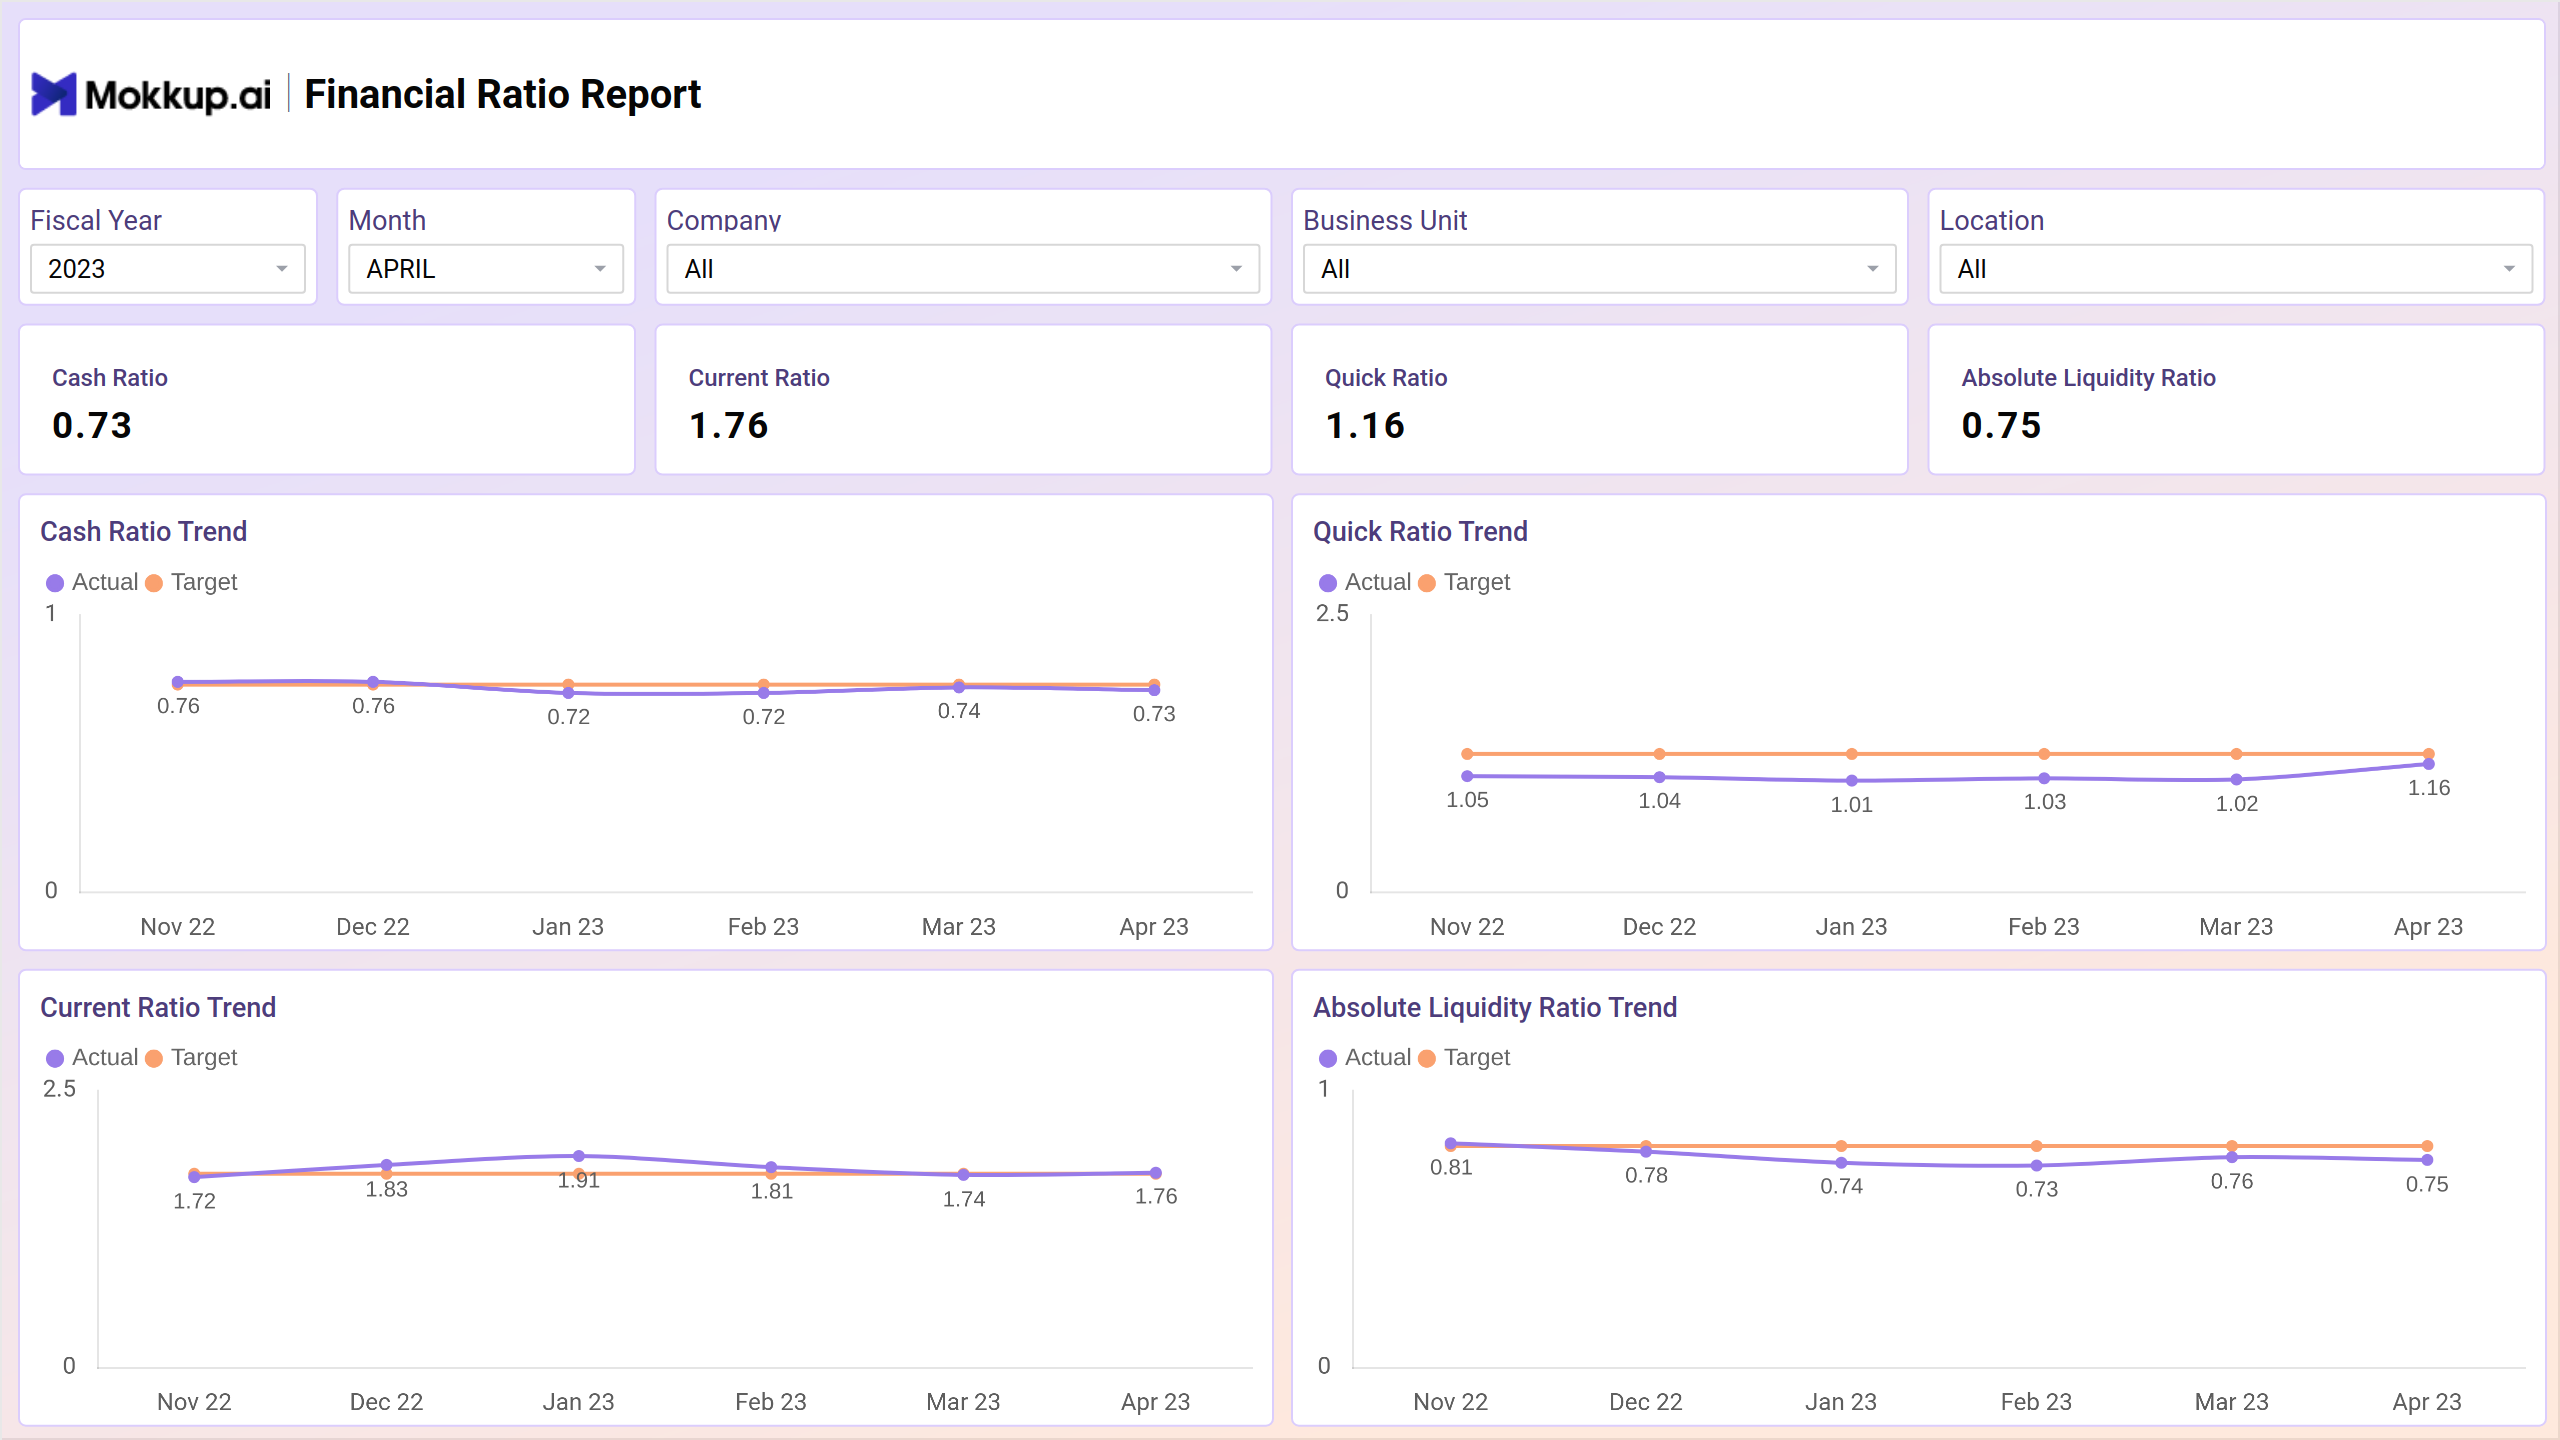
- Cash Ratio: Measures the organization's ability to pay off its short-term liabilities with its cash and cash equivalents.
- Current Ratio: Compares the organization's current assets to its current liabilities.
- Quick Ratio: Measures the ability to meet short-term obligations with its most liquid assets (excluding inventory).
- Absolute Liquidity Ratio: Measures the ability to cover short-term liabilities with cash and marketable securities.
- Cash Ratio Trend: Displays the trend of the cash ratio over time, comparing actual values to target values.
- Current Ratio Trend: Shows the trend of the current ratio over time, with actual and target values.
- Quick Ratio Trend: Illustrates the trend of the quick ratio over time, highlighting actual versus target values.
- Absolute Liquidity Ratio Trend: Presents the trend of the absolute liquidity ratio over time, showing actual and target values.
Working Capital Ratios
Screen 2 of the Financial Ratios Report Dashboard wireframe focuses on working capital ratios, providing essential insights into the efficiency and effectiveness of an organization's management of its short-term assets and liabilities.
Key Terms to Know
- Receivable Turnover Ratio: Measures how efficiently a company collects its accounts receivable.
- Debtors Turnover Ratio: Shows how many times a company’s receivables are converted into cash during a period.
- Cash Conversion Cycle: The time taken to convert inventory and other resources into cash flows from sales.
- Creditors Turnover Ratio: Measures how quickly a company pays off its suppliers.
- Receivable Turnover Ratio Trend: Displays the trend of the receivable turnover ratio over time, comparing actual values to target values.
- Debtors Turnover Ratio Trend: Shows the trend of the debtors turnover ratio over time, highlighting actual versus target values.
- Cash Conversion Cycle Trend: Illustrates the trend of the cash conversion cycle over time, showing actual and target values.
- Creditors Turnover Ratio Trend: Presents the trend of the creditors turnover ratio over time, comparing actual values to target values.
Risk Ratios
Screen 3 of the Financial Ratios Report Dashboard wireframe is dedicated to risk ratios, providing critical insights into an organization's financial risk and stability.
Key Terms to Know
- Operating Leverage: Measures the proportion of fixed costs to total costs, indicating how a change in sales volume affects operating income.
- Financial Leverage: Assesses the degree to which a company uses borrowed funds to finance its operations.
- Debt to Equity Ratio: Compares the total debt to shareholders' equity.
- Interest Cover Ratio: Measures the ability of a company to meet its interest obligations from its operating income.
- Operating Leverage Trend: Displays the trend of operating leverage over time, comparing actual values to target values. Helps in monitoring how changes in sales affect profitability and fixed cost management.
- Financial Leverage Trend: Shows the trend of financial leverage over time, highlighting actual versus target values. It provides insights into the risks associated with the company’s financing decisions.
- Debt to Equity Ratio Trend: Illustrates the trend of the debt to equity ratio over time, showing actual and target values. It enables tracking of the company’s capital structure and debt levels.
- Interest Cover Ratio Trend: Presents the trend of the interest cover ratio over time, comparing actual values to target values. Helps assess the company’s ability to meet its interest obligations from operating income.
Profitability Ratios
Screen 4 of the Financial Ratios Report Dashboard wireframe is dedicated to profitability ratios, which are crucial for assessing the financial performance and efficiency of an organization.
Key Terms to Know
- Earning Margin: Measures the percentage of revenue that becomes profit after deducting all expenses.
- Return on Investment (ROI): Evaluates the efficiency of an investment by comparing the profit gained to the cost of the investment.
- Return on Equity (ROE): Measures the return generated on shareholders' equity.
- Earnings per Share (EPS): Calculates the portion of a company's profit allocated to each outstanding share of common stock.
- Earning Margin Trend: Displays the trend of the earning margin over time, comparing actual values to target values. It helps in monitoring profitability and cost management efficiency.
- Return on Investment (ROI) Trend: Shows the trend of ROI over time, highlighting actual versus target values. It provides insights into the effectiveness of the company’s investments.
- Return on Equity (ROE) Trend: Illustrates the trend of ROE over time, showing actual and target values. Enables tracking of how well the company is using its equity to generate profits.
- Earnings per Share (EPS) Trend: Presents the trend of EPS over time, comparing actual values to target values. Helps assess the company’s profitability on a per-share basis and its attractiveness to investors.
Ratios Comparison
Screen 5 of the Financial Ratios Report Dashboard wireframe shows the comparison of key financial ratios over different periods, providing a comprehensive view of the organization’s financial performance over time.
Key Terms to Know
- Earnings Margin PY: Measures the percentage of revenue that became profit in the previous year after all expenses were deducted.
- Return on Equity Current: Measures the return generated on shareholders' equity in the current year.
- Earnings Margin Current: Measures the percentage of revenue that has become profit in the current year after all expenses have been deducted.
- Return on Equity PY: Measures the return generated on shareholders' equity in the previous year.
- Earnings Margin Trend: Displays the trend of the earnings margin over time.
- Return on Equity Trend: Shows the trend of return on equity over time, highlighting actual versus target values for both the current and previous years.
Dashboard Template Insights
Let’s have a look at the some of the important insights:
- The dashboard wireframe provides a holistic view of the organization's financial health by covering various financial ratios, including liquidity, working capital, risk, and profitability ratios.
- The trend analysis of financial ratios helps identify patterns and areas needing attention.
- Comparing actual values against target values helps in assessing performance again and identifying gaps.
- Insights into working capital, risk, and profitability ratios support cash flow optimization, risk mitigation, and strategic decision-making.
Conclusion
The Financial Ratios Report Dashboard template provides comprehensive insights into various aspects of an organization's financial health. By leveraging KPIs and trend analysis, stakeholders can effectively monitor performance, manage risks, optimize operational efficiency, and enhance profitability. The dashboard wireframe’s ability to compare actual performance against targets and evaluate year-over-year changes makes it an invaluable resource for informed decision-making and strategic planning.