
What is a Stormwater Management Water Quality Runoff Monitoring Dashboard?
A Stormwater Management Water Quality Runoff Monitoring Dashboard is a specialized analytical tool designed for environmental engineers, municipal water managers, and compliance teams who need to track, assess, and report on the quality of stormwater discharged into local waterways. By consolidating key water quality indicators, treatment cost data, and geographic hotspot intelligence into a single view, this stormwater runoff water quality monitoring dashboard eliminates the need to manually compile data from disparate field reports and lab results. Teams can filter results by year, geographic zone, pollutant type, and infrastructure type to zero in on the conditions that matter most to their oversight responsibilities.
The dashboard is built around the core metrics that define regulatory compliance and operational performance in stormwater management. From suspended solids and bacterial contamination to heavy metal concentrations and treatment efficiency rates, every data point feeds directly into decisions about where to invest remediation resources and how to prioritize infrastructure upgrades. The urban stormwater management data visualization layer, including a geographic bubble map of water quality hotspots, makes it possible to connect field measurements to real-world locations quickly and without specialized GIS expertise. Beyond compliance reporting, this tool supports strategic planning. Environmental program managers can use the pollutant load reduction efficiency tracking tool to evaluate whether current best management practices are delivering measurable improvements over prior periods. The inclusion of cost-avoidance metrics alongside water quality indicators means finance stakeholders and program directors can assess the economic value of prevention-focused stormwater investments, making the dashboard as useful in budget discussions as it is in technical reviews.
How to Create a Stormwater Management Water Quality Runoff Monitoring Dashboard
You don't need to build your dashboard from scratch; just start with a ready-to-use Dashboard template from Mokkup. Customize it with your data and export it with ease. Here's how:
1. Create or Log in to Your Mokkup Account
Start by signing up on Mokkup.ai using your email. If you already have an account, just log in, and you'll be good to go.
2. Choose and Customize Your Dashboard Template
Find the Stormwater Management Water Quality Runoff Monitoring Dashboard template in the Templates section. Use the drag-and-drop editor to adjust KPIs, edit filters, or add elements based on your data.
3. Export to Your BI Tool
Once your dashboard wireframe is ready, use the BI Tool Export feature to send it directly to Power BI or Tableau for further analysis and enhancements. You can also download the dashboard as a PDF, PNG, or JPEG, embed it on a platform, or invite your team to collaborate.
Note: This is a Pro template. You'll need a Pro subscription on Mokkup to use and customize this dashboard wireframe. Upgrade anytime to unlock full access.
Stormwater Management Water Quality Runoff Monitoring Dashboard Example
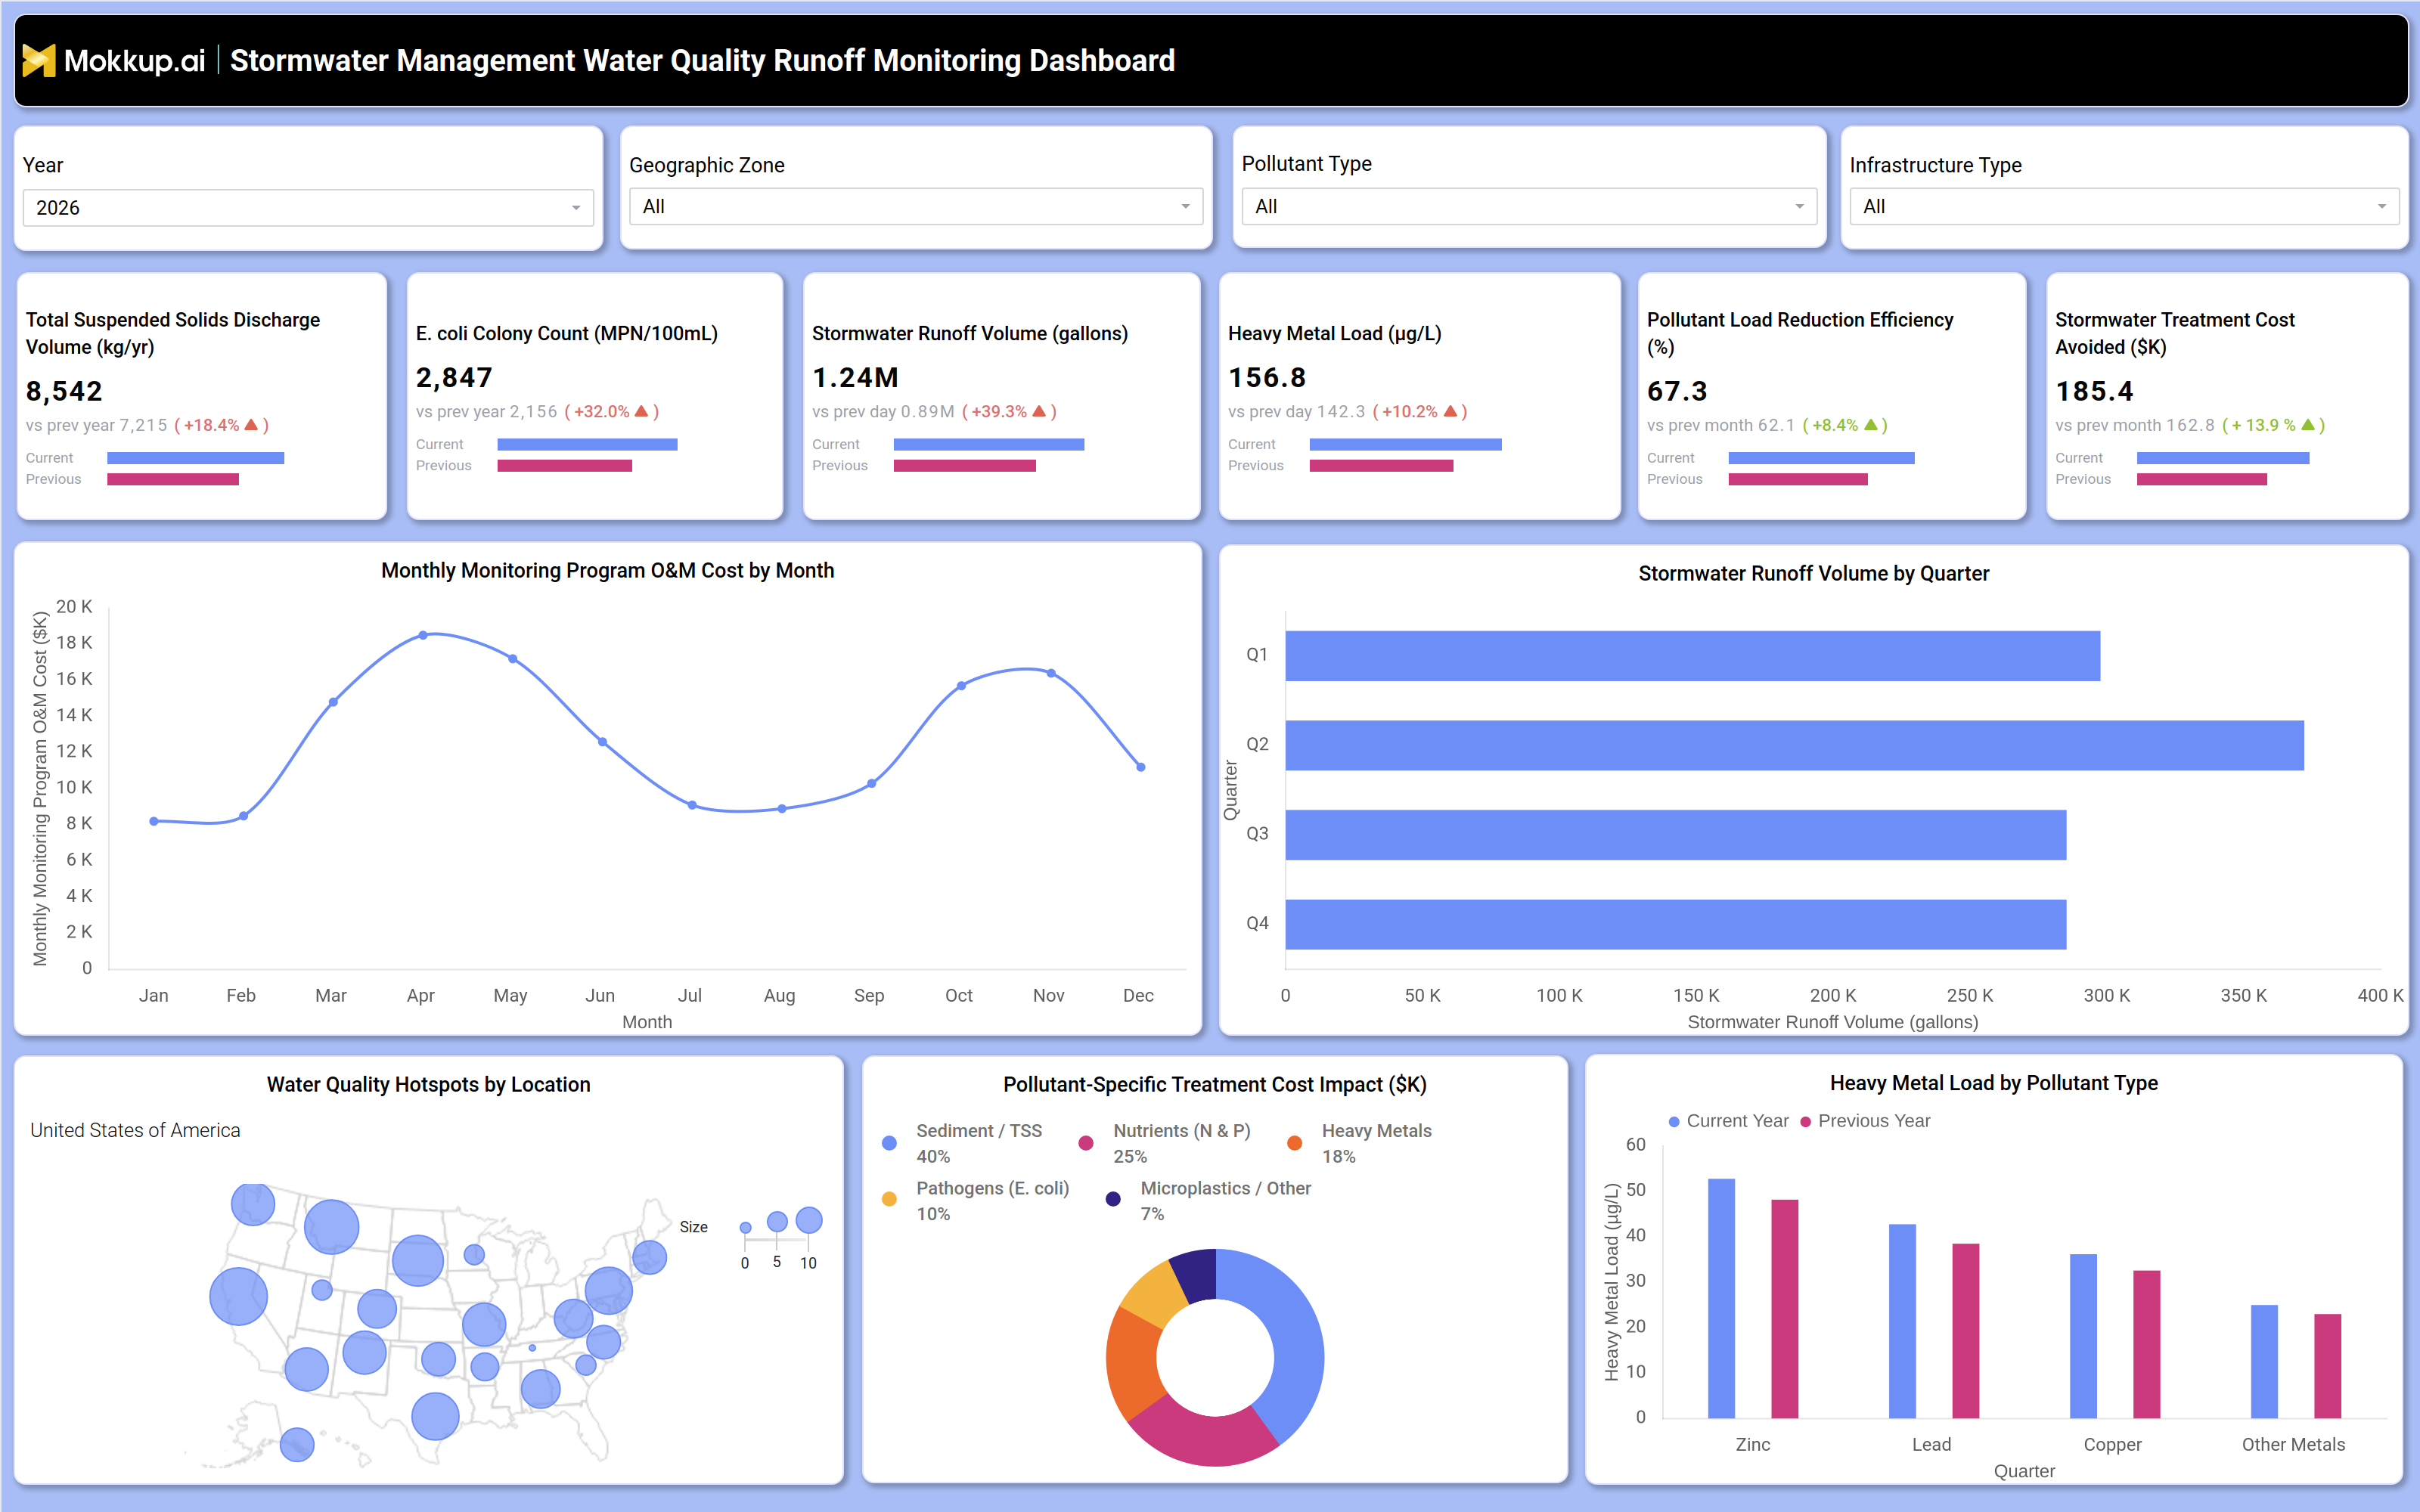
Environmental compliance managers typically begin their review by scanning the six KPI cards across the top of the dashboard. These cards surface the current state of total suspended solids discharge, bacterial colony counts, runoff volume, heavy metal concentrations, pollutant reduction efficiency, and treatment cost savings, each compared against the prior period. This immediate comparative view tells teams whether conditions are improving, holding steady, or deteriorating, and sets the agenda for deeper investigation. Filters for geographic zone, pollutant type, and infrastructure type allow analysts to isolate specific segments of the stormwater network without leaving the stormwater runoff water quality monitoring dashboard. From the KPI row, teams move into chart-level analysis. The monthly operations and maintenance cost trend helps program managers identify seasonal cost spikes and plan budget allocations accordingly.
The quarterly runoff volume breakdown gives engineers a structured view of how precipitation patterns translate into system load across different parts of the year. Together, these temporal views support the kind of stormwater treatment cost analysis dashboard workflows that justify capital project timelines and maintenance schedules to municipal leadership. Geographic teams rely on the water quality hotspot identification and tracking map to direct field inspections and remediation crews. Bubble size encoding communicates relative severity across monitoring sites distributed across the service area, allowing program leads to prioritize which locations require immediate attention versus ongoing observation.
How to Analyze Data in a Stormwater Management Water Quality Runoff Monitoring Dashboard
Here is how you can analyze data from this dashboard:
- Apply the Geographic Zone filter to compare pollutant concentrations across different drainage basins or districts.
- Use the Pollutant Type filter to isolate specific contaminants such as heavy metals or pathogens for targeted review.
- Review the monthly O&M cost trend to identify seasonal peaks and plan maintenance budgets accordingly.
- Compare quarterly runoff volumes to assess how precipitation cycles affect system load and treatment demand.
- Cross-reference the water quality hotspot map with KPI card values to validate which locations are driving aggregate metrics.
- Analyze the donut chart to understand which pollutant categories contribute the most to total treatment costs.
- Use the grouped bar chart to compare current versus previous year heavy metal loads by metal type.
- Apply the Infrastructure Type filter to assess performance differences across catch basins, detention ponds, or bioswales.
- Track the Pollutant Load Reduction Efficiency KPI over time to evaluate whether best management practices are improving outcomes.
- Monitor the Stormwater Treatment Cost Avoided metric to quantify the financial return on prevention-focused investments.
Benefits of a Stormwater Management Water Quality Runoff Monitoring Dashboard
The following are the benefits of using this dashboard:
- Consolidates field data, lab results, and cost records into a single accessible view for faster decision-making.
- Supports regulatory compliance reporting by tracking all required water quality parameters in one place.
- Enables geographic prioritization through a visual hotspot map that directs remediation resources to the highest-impact sites.
- Reduces manual data aggregation time by surfacing period-over-period comparisons automatically across all KPI cards.
- Improves budget justification by linking treatment cost avoidance directly to pollutant reduction performance.
- Helps identify which pollutant categories are driving the most treatment expenditure through cost breakdown analysis.
- Supports cross-functional collaboration by making technical water quality data interpretable for finance and leadership audiences.
- Enables proactive infrastructure planning by revealing seasonal runoff patterns and O&M cost trends throughout the year.
KPIs to Track in a Stormwater Management Water Quality Runoff Monitoring Dashboard
The following key KPIs can be tracked by using this dashboard:
- Total Suspended Solids Discharge Volume (kg/yr): Measures the total mass of solid particles discharged through stormwater outlets, a primary indicator of sediment pollution in receiving waters.
- E. coli Colony Count (MPN/100mL): Tracks bacterial contamination levels in stormwater runoff, used to assess public health risk and compliance with water quality standards.
- Stormwater Runoff Volume (gallons): Quantifies the total volume of stormwater flowing through the monitored network, essential for capacity planning and flood risk assessment.
- Heavy Metal Load (ug/L): Measures the concentration of heavy metals in runoff, with the dashboard breaking this down by zinc, lead, copper, and other metals for pollutant-specific analysis.
- Pollutant Load Reduction Efficiency (%): Tracks the percentage reduction in pollutant discharge achieved by current best management practices compared to baseline conditions.
- Stormwater Treatment Cost Avoided ($K): Quantifies the dollar value of treatment costs prevented through effective upstream pollution controls and infrastructure investments.
- Monthly Monitoring Program O&M Cost : Track operational spending trends over time.
- Pollution Treatment Type Cost Impact ($K): Understand which contaminants drive treatment costs.
Frequently Asked Questions
1. Who should use a Stormwater Management Water Quality Runoff Monitoring Dashboard?
This dashboard is designed for environmental engineers, municipal stormwater program managers, compliance officers, and public works departments responsible for monitoring and reporting on water quality in stormwater discharge. It is also useful for sustainability teams and grant managers who need to demonstrate measurable program outcomes.
2. Can this dashboard support regulatory compliance reporting?
Yes. The dashboard tracks the key water quality parameters typically required under NPDES permits and municipal separate storm sewer system (MS4) reporting obligations, including suspended solids, bacterial counts, and heavy metal concentrations. Filtering by geographic zone and pollutant type makes it straightforward to pull the specific data needed for permit reports.
3. How does the dashboard help prioritize remediation investments?
The water quality hotspot identification and tracking map identifies which geographic locations are experiencing the highest pollutant loads, while the pollutant-specific treatment cost breakdown shows which contaminant categories are most expensive to address. Together, these views allow program managers to direct remediation budgets toward the sites and pollutants that will deliver the greatest environmental and cost impact.