
What is a Water Recycling Regulatory Compliance Dashboard?
The Water Recycling Regulatory Compliance Dashboard is a structured monitoring tool built for water utility managers, regulatory affairs teams, and environmental compliance officers who oversee recycled water programs. It consolidates key compliance indicators, including overall reuse compliance, pathogen control, and turbidity rates, into a single view, making it easier to track performance across treatment facilities. This water recycling regulatory compliance dashboard enables teams to detect non-conformances early and respond before they escalate into formal violations. By combining audit inspection readiness for water recycling with treatment validation data, the dashboard supports proactive governance rather than reactive reporting.
How to Create a Water Recycling Regulatory Compliance Dashboard
You don't need to build your report from scratch; just start with a ready-to-use dashboard template from Mokkup. Add in your data and export it however you like. Here's how to do it:
1. Create or Log in to Your Mokkup Account
Start by signing up on Mokkup.ai using your email. If you already have an account, just log in, and you'll be good to go.
2. Choose and Customize Your Dashboard Template
Find the Water Recycling Regulatory Compliance Dashboard template in the Templates section. Use the drag-and-drop editor to adjust KPIs, edit filters, or add elements based on your data.
3. Export to Your BI Tool
Once your dashboard wireframe is ready, use the BI Tool Export feature to send it directly to Power BI or Tableau for further analysis and enhancements. You can also download the dashboard as a PDF, PNG, or JPEG, embed it on a platform, or invite your team to collaborate.
Note: This is a Pro template. You'll need a Pro subscription on Mokkup to use and customize this dashboard wireframe. Upgrade anytime to unlock full access.
Water Recycling Regulatory Compliance Dashboard Example
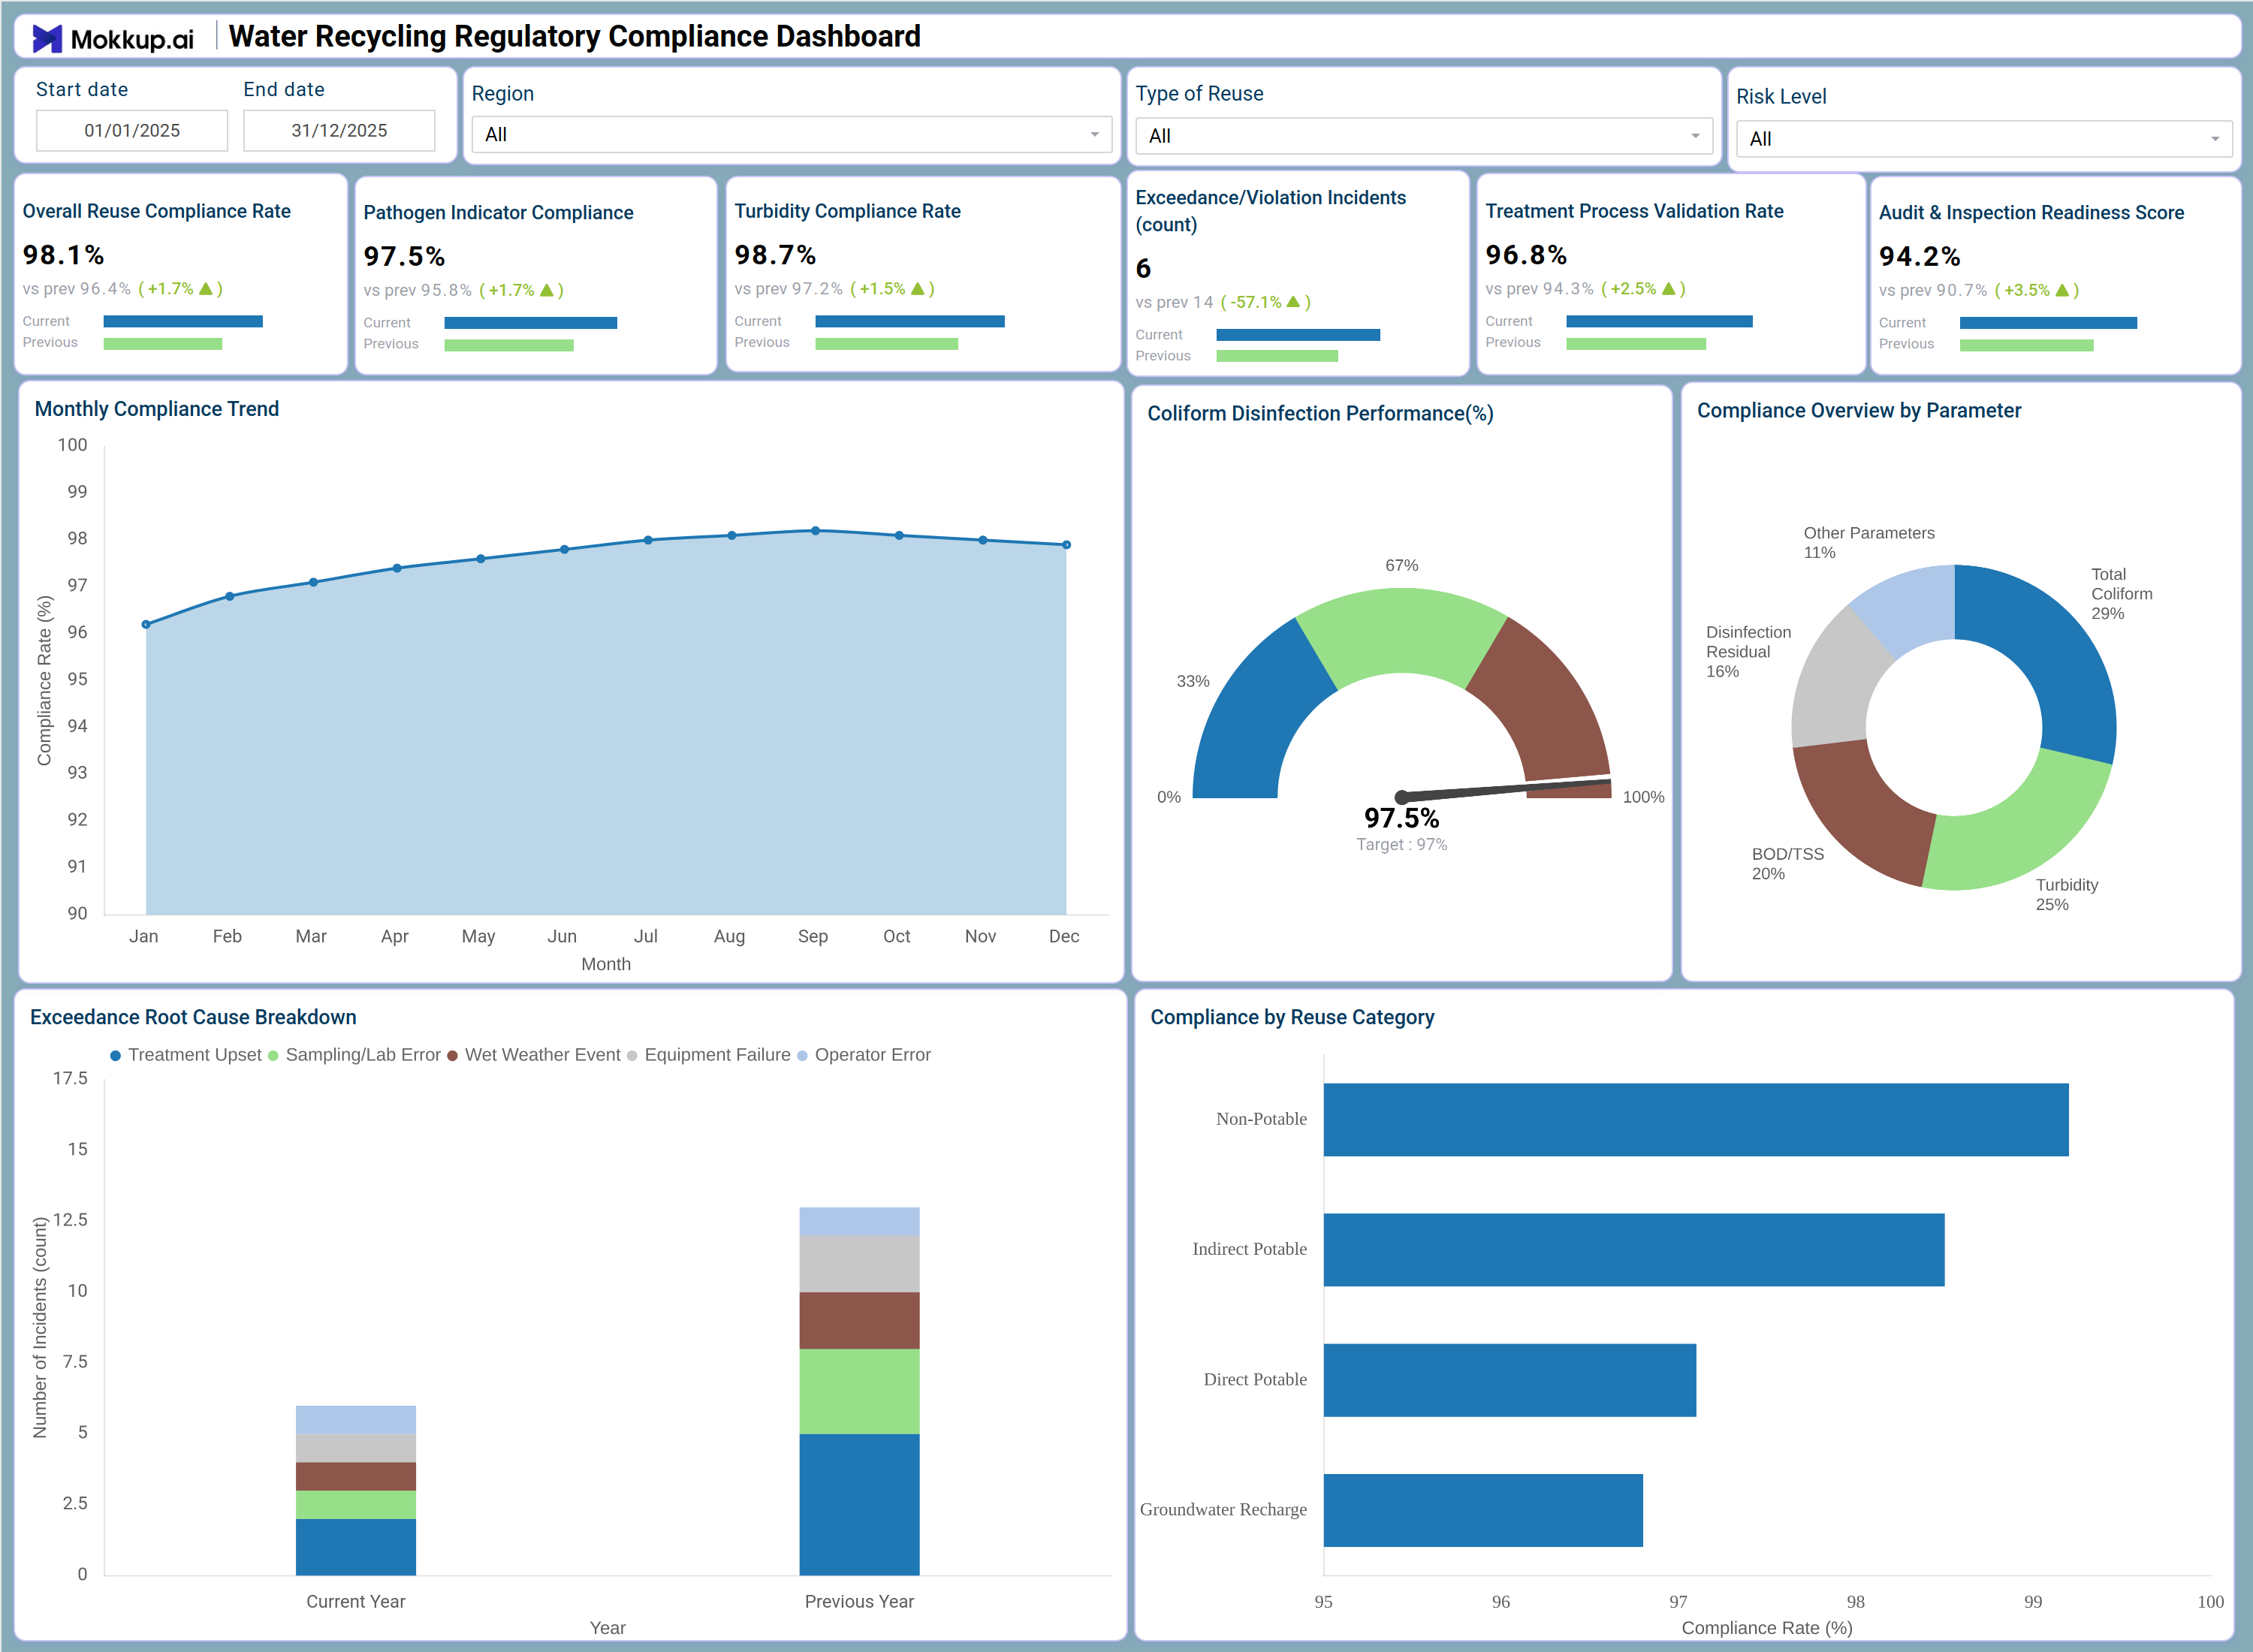
The dashboard opens with date range and region filters alongside dropdowns for Type of Reuse and Risk Level, giving teams full control over the data scope. Six KPI tiles across the top row display Overall Reuse Compliance Rate, Pathogen Indicator Compliance, Turbidity Compliance Rate, Exceedance/Violation Incidents, Treatment Process Validation Rate, and Audit and Inspection Readiness Score, each with trend indicators showing period-over-period movement.
Below the KPIs, the Monthly Compliance Trend line chart plots compliance rate across all twelve months, the Coliform Disinfection Performance gauge shows current performance against the regulatory target, and the Compliance Overview by Parameter donut chart breaks results across Turbidity, BOD/TSS, Total Coliform, Disinfection Residual, and Other Parameters. The bottom row features the Exceedance Root Cause Breakdown stacked bar chart comparing current and previous year incidents, and the Compliance by Reuse Category horizontal bar chart showing reuse compliance rate monitoring across Non-Potable, Indirect Potable, Direct Potable, and Groundwater Recharge categories.
How to Analyze Data in a Water Recycling Regulatory Compliance Dashboard
Here is how you can analyze data from this dashboard:
- Use the Region filter to isolate compliance performance for specific service areas or treatment zones.
- Monitor the Monthly Compliance Trend line chart to detect seasonal dips in compliance rate before they trigger regulatory review.
- Review the Coliform Disinfection Performance gauge to assess disinfection effectiveness and track coliform disinfection performance tracking against the regulatory target threshold.
- Use the Compliance Overview by Parameter donut chart to identify which parameter, Turbidity, BOD/TSS, Total Coliform, or Disinfection Residual, accounts for the largest share of non-compliance.
- Compare the Exceedance Root Cause Breakdown stacked bar chart across years to find whether Treatment Upset, Equipment Failure, or Operator Error incidents are trending upward.
- Analyze the Compliance by Reuse Category horizontal bar chart to identify which reuse category shows the lowest compliance rate.
- Filter by Type of Reuse to align performance views with specific permit conditions or regulatory frameworks.
- Track the Audit and Inspection Readiness Score over time to measure progress in regulatory preparedness as part of an audit inspection readiness water recycling program.
Benefits of a Water Recycling Regulatory Compliance Dashboard
The following are the benefits of using this dashboard:
- Centralizes compliance rates, violation counts, and disinfection metrics across recycled water programs in one structured template.
- Supports reuse compliance rate monitoring across Non-Potable, Indirect Potable, Direct Potable, and Groundwater Recharge categories simultaneously.
- Reduces manual data compilation for regulatory submissions with pre-built KPI tiles and chart layouts.
- Enables region-level exceedance root cause breakdown analysis to guide corrective actions and infrastructure investment decisions.
- Provides a stacked bar breakdown of incident root causes — Treatment Upset, Sampling/Lab Error, Wet Weather Event, Equipment Failure, and Operator Error — for operational efficiency planning.
- Helps compliance teams align with multiple water reuse standards without rebuilding reports from scratch each reporting cycle.
- Gives utility managers and regulatory officers a shared view of treatment validation and audit readiness performance.
KPIs to Track in a Water Recycling Regulatory Compliance Dashboard
The following key KPIs can be tracked by using this dashboard:
- Overall Reuse Compliance Rate (%): The water recycling regulatory compliance dashboard uses this KPI to measure the percentage of recycled water deliveries meeting all applicable reuse standards across active permit categories.
- Pathogen Indicator Compliance (%): Tracks the proportion of samples meeting pathogen indicator thresholds — critical for demonstrating public health protection in recycled water programs.
- Turbidity Compliance Rate (%): Quantifies the share of turbidity readings within permitted limits, supporting coliform disinfection performance tracking since turbidity directly affects disinfection efficacy.
- Exceedance/Violation Incidents (count): Measures the total number of regulatory exceedances recorded in the selected period — essential for exceedance root cause breakdown analysis and year-over-year benchmarking.
- Treatment Process Validation Rate (%): Evaluates the share of treatment processes that have passed required validation checks — the core metric for a treatment process validation rate dashboard used in permit compliance workflows.
- Audit and Inspection Readiness Score (%): Tracks facility preparedness across documentation, sampling records, and operational compliance dimensions, supporting audit inspection readiness water recycling programs.
Frequently Asked Questions
1. What industries benefit most from this Water Recycling Regulatory Compliance Dashboard?
Water utilities, municipal recycled water agencies, and industrial water reuse facilities benefit most. Regulatory compliance officers, environmental managers, and utility operations teams use it to maintain permit adherence and prepare for audits.
2. Can this dashboard track compliance across different reuse categories?
Yes. The Compliance by Reuse Category horizontal bar chart displays compliance rates separately for Non-Potable, Indirect Potable, Direct Potable, and Groundwater Recharge. Teams can pinpoint which category requires the most attention.
3. Is this dashboard suitable for regulatory audit preparation?
Yes. The Audit and Inspection Readiness Score KPI directly measures preparedness, and the Monthly Compliance Trend and Exceedance Root Cause Breakdown charts provide the supporting evidence teams need during regulatory reviews.
4. How does the Coliform Disinfection Performance gauge work?
The gauge displays current coliform disinfection performance as a percentage against a defined regulatory target. It uses a color-coded arc so operators can instantly see whether performance is within the compliant zone or approaching a threshold breach.
5. What does Treatment Process Validation Rate measure?
Treatment Process Validation Rate tracks the percentage of treatment processes that have successfully completed required validation protocols within the reporting period. This treatment process validation rate dashboard metric demonstrates to regulators that treatment trains are operating as designed and certified.