
What is a Wastewater Treatment Process Efficiency & Operational Performance Dashboard?
A wastewater treatment process efficiency dashboard is a structured visual tool that consolidates operational data from across a treatment plant into a single, trackable interface. It gives plant operators, process engineers, and facility managers a clear picture of how well the treatment system is performing from raw influent intake through screening, primary treatment, secondary treatment, tertiary treatment, and disinfection. By centralizing treatment plant operational performance KPIs tracking into one view, the dashboard eliminates the need to pull data from multiple systems or rely on manual reporting.
This dashboard is designed for facilities that need consistent oversight of treatment volumes, cycle times, and process compliance. It connects key performance metrics to the operational factors that influence them, including shift schedules, treatment plant selection, and process type, so that performance issues can be traced to specific conditions rather than diagnosed in isolation. The effluent quality compliance monitoring wastewater plant view ensures that regulatory thresholds remain in focus at all times, not just during formal audits.
How to Create a Wastewater Treatment Process Efficiency & Operational Performance Dashboard
You don't need to build your report from scratch; just start with a ready-to-use dashboard template from Mokkup. Add in your data and export it however you like. Here's how to do it:
1. Create or Log in to Your Mokkup Account
Start by signing up on Mokkup.ai using your email. If you already have an account, just log in, and you'll be good to go.
2. Choose and Customize Your Dashboard Template
Find the Wastewater Treatment Process Efficiency & Operational Performance Dashboard template in the Templates section. Use the drag-and-drop editor to adjust KPIs, edit filters, or add elements based on your data.
3. Export to Your BI Tool
Once your dashboard wireframe is ready, use the BI Tool Export feature to send it directly to Power BI or Tableau for further analysis and enhancements. You can also download the dashboard as a PDF, PNG, or JPEG, embed it on a platform, or invite your team to collaborate.
Note: This is a Pro template. You'll need a Pro subscription on Mokkup to use and customize this dashboard wireframe. Upgrade anytime to unlock full access.
Wastewater Treatment Process Efficiency & Operational Performance Dashboard Example
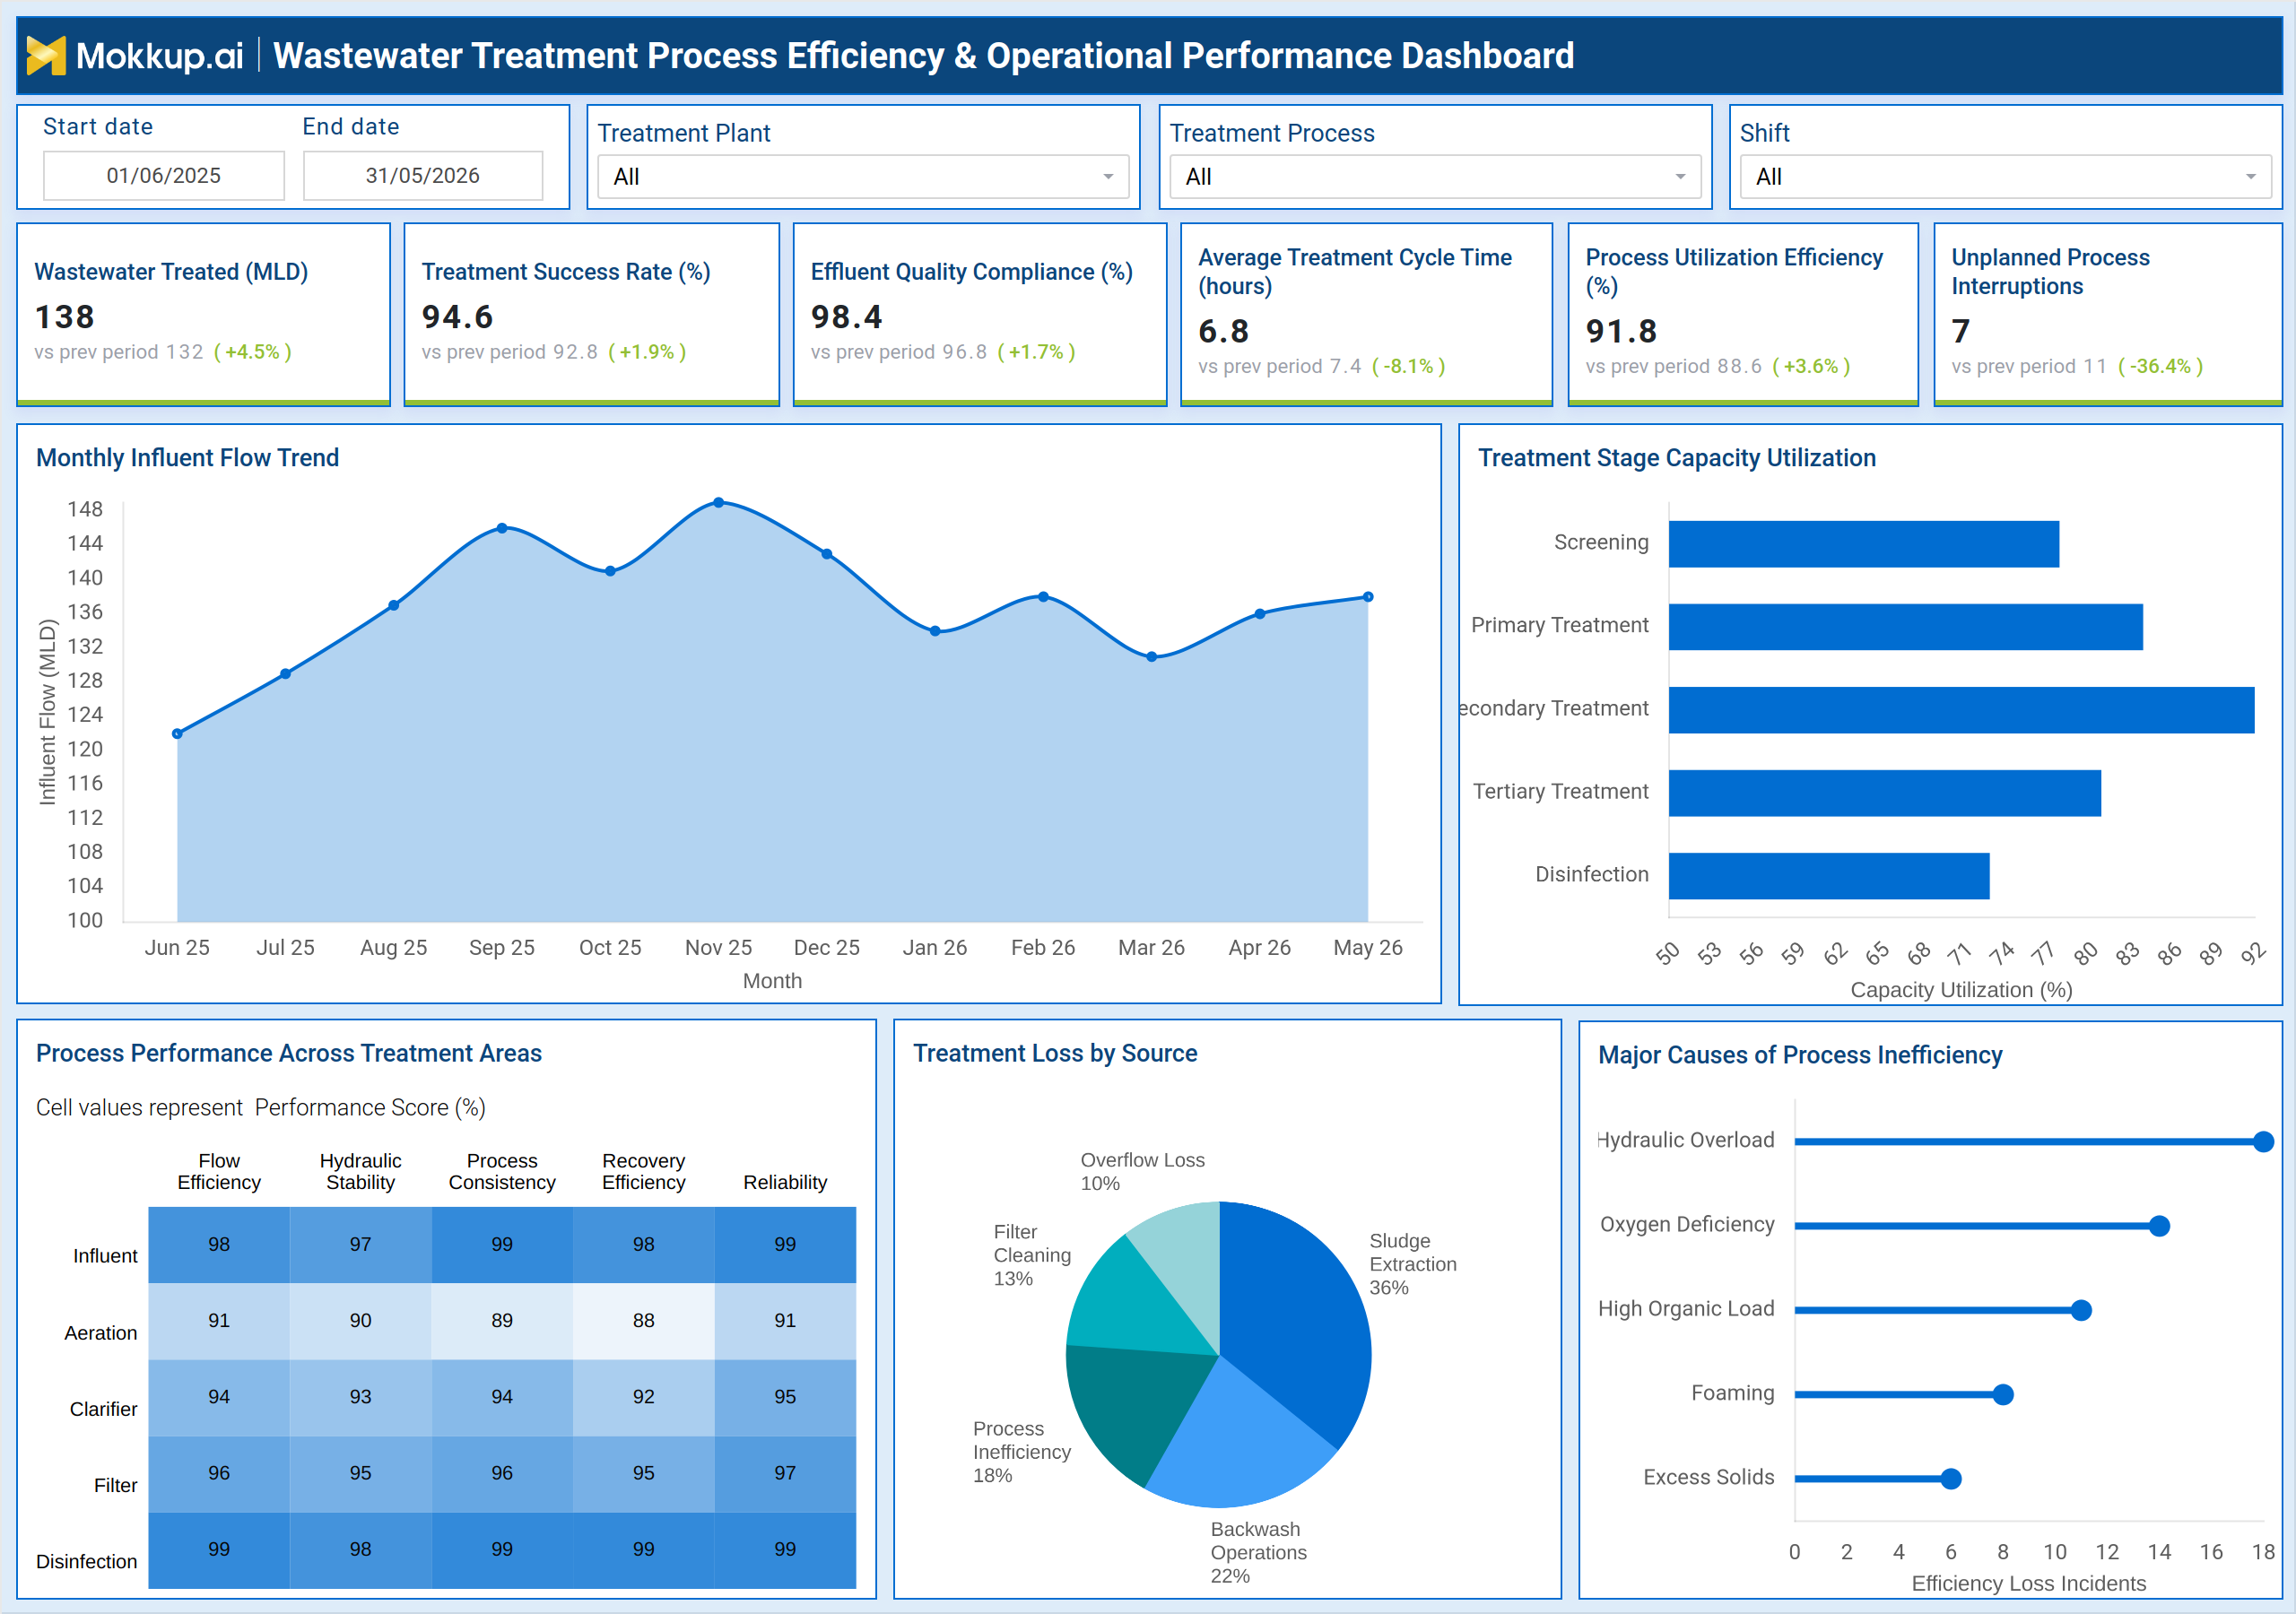
A plant supervisor opens this dashboard at the start of a shift to determine whether treatment volumes and process conditions are within acceptable operating ranges. The central question is straightforward: are all treatment stages performing at capacity without signs of stress, and is the facility on track for effluent quality compliance? With filters for treatment plant, process type, and shift, the supervisor can immediately narrow the view to the most relevant segment of operations before reviewing broader trends.
From the overview, the team can assess whether influent flow volumes have shifted over recent months and identify which treatment stages are approaching their utilization limits. When utilization spikes in a specific stage, such as secondary treatment or disinfection, operators can investigate whether the cause is hydraulic overload, oxygen deficiency, or excess solids, all of which appear as tracked causes of process inefficiency in wastewater treatment.
This narrows the diagnostic path and allows maintenance or process adjustments to be prioritized before throughput is affected. The process performance matrix allows teams to compare treatment areas across multiple dimensions simultaneously, including hydraulic stability, process consistency, and recovery efficiency. This cross-area visibility helps managers identify whether a performance gap is isolated to one unit or reflects a systemic issue across multiple stages. Treatment loss data further clarifies where volume is being lost, whether through overflow, sludge extraction, backwash operations, or filter cleaning, so that corrective actions target the right source. Over time, this dashboard supports a structured approach to wastewater treatment process efficiency improvement. By tracking unplanned process interruptions alongside treatment stage capacity utilization monitoring, plant teams can identify recurring failure patterns, schedule preventive interventions, and demonstrate sustained compliance to regulatory bodies. The result is a more stable, predictable, and efficient treatment operation.
How to Analyze Data in a Wastewater Treatment Process Efficiency & Operational Performance Dashboard
Here is how you can analyze data from this dashboard:
- Use the monthly influent flow trend to identify seasonal volume patterns and assess whether plant intake capacity is being stretched across the year.
- Review treatment stage capacity utilization across screening, primary, secondary, tertiary, and disinfection stages to spot where operational pressure is concentrated.
- Cross-reference the process performance matrix to compare hydraulic stability, process consistency, and recovery efficiency across influent, aeration, clarifier, filter, and disinfection units.
- Analyze the treatment loss donut chart to determine whether losses are driven by overflow, sludge extraction, backwash, filter cleaning, or process inefficiency.
- Track the major causes of process inefficiency, including hydraulic overload and oxygen deficiency — to prioritize corrective maintenance and process adjustments.
- Apply date range, treatment plant, treatment process, and shift filters to isolate performance data to specific operating conditions and compare across periods.
- Monitor effluent quality compliance, wastewater plant trends over time to ensure regulatory thresholds are consistently met across all treatment cycles.
Benefits of a Wastewater Treatment Process Efficiency & Operational Performance Dashboard
The following are the benefits of using this dashboard:
- Provides a unified view of treatment plant operational performance KPIs tracking across all treatment stages in a single interface.
- Reduces diagnostic time by connecting process inefficiency causes to specific operational conditions such as shift, plant, and process type.
- Supports proactive maintenance scheduling by surfacing unplanned interruptions and treatment loss patterns before they escalate.
- Enables consistent effluent quality compliance monitoring by keeping regulatory metrics visible throughout every operational period.
- Helps plant managers evaluate treatment stage capacity utilization monitoring trends and allocate resources to stages under the most pressure.
- Improves decision-making by giving process engineers a structured view of performance across multiple quality dimensions simultaneously.
- Supports documentation and reporting for regulatory audits by consolidating operational data into an exportable, structured format.
KPIs to Track in a Wastewater Treatment Process Efficiency & Operational Performance Dashboard
The following key KPIs can be tracked by using this dashboard:
- Wastewater Treated (MLD): Measures the total volume of wastewater processed in megalitres per day, indicating plant throughput and capacity usage.
- Treatment Success Rate (%): Tracks the proportion of wastewater that completes the treatment process meeting output standards, reflecting overall process reliability.
- Effluent Quality Compliance (%): Measures how consistently treated effluent meets regulatory discharge standards, a critical indicator for environmental compliance.
- Average Treatment Cycle Time (hours): Captures the average time required to complete a full treatment cycle, helping identify bottlenecks or process slowdowns.
- Process Utilization Efficiency (%): Reflects how effectively treatment capacity is being used relative to available capacity, signaling over- or under-utilization.
- Unplanned Process Interruptions: Counts unexpected stoppages or failures across treatment stages, highlighting operational reliability risks and maintenance needs.
Frequently Asked Questions
1. What makes a wastewater treatment process efficiency dashboard useful for plant operators?
It consolidates all critical performance data — from influent volumes to effluent compliance — into a single, filterable view. Plant operators can compare performance across shifts, plants, and processes without manually pulling data from multiple sources.
2. How does influent flow trend analysis wastewater help with capacity planning?
Tracking influent flow over time allows plant managers to identify seasonal peaks and recurring volume increases that strain treatment capacity. This supports informed decisions about when to scale operations or schedule preventive maintenance before capacity limits are reached.
3. Which causes of process inefficiency in wastewater treatment are tracked by this dashboard?
The dashboard tracks hydraulic overload, oxygen deficiency, high organic load, foaming, and excess solids as the primary causes of efficiency loss. Each is measured by the number of efficiency loss incidents, enabling teams to prioritize the most frequent or impactful issues.