Tracking the right KPIs helps monitor donation performance, improve operational efficiency, and optimize drive planning for better donor engagement and collection outcomes:
What is a Blood Bank Collection & Donation Drive Dashboard?
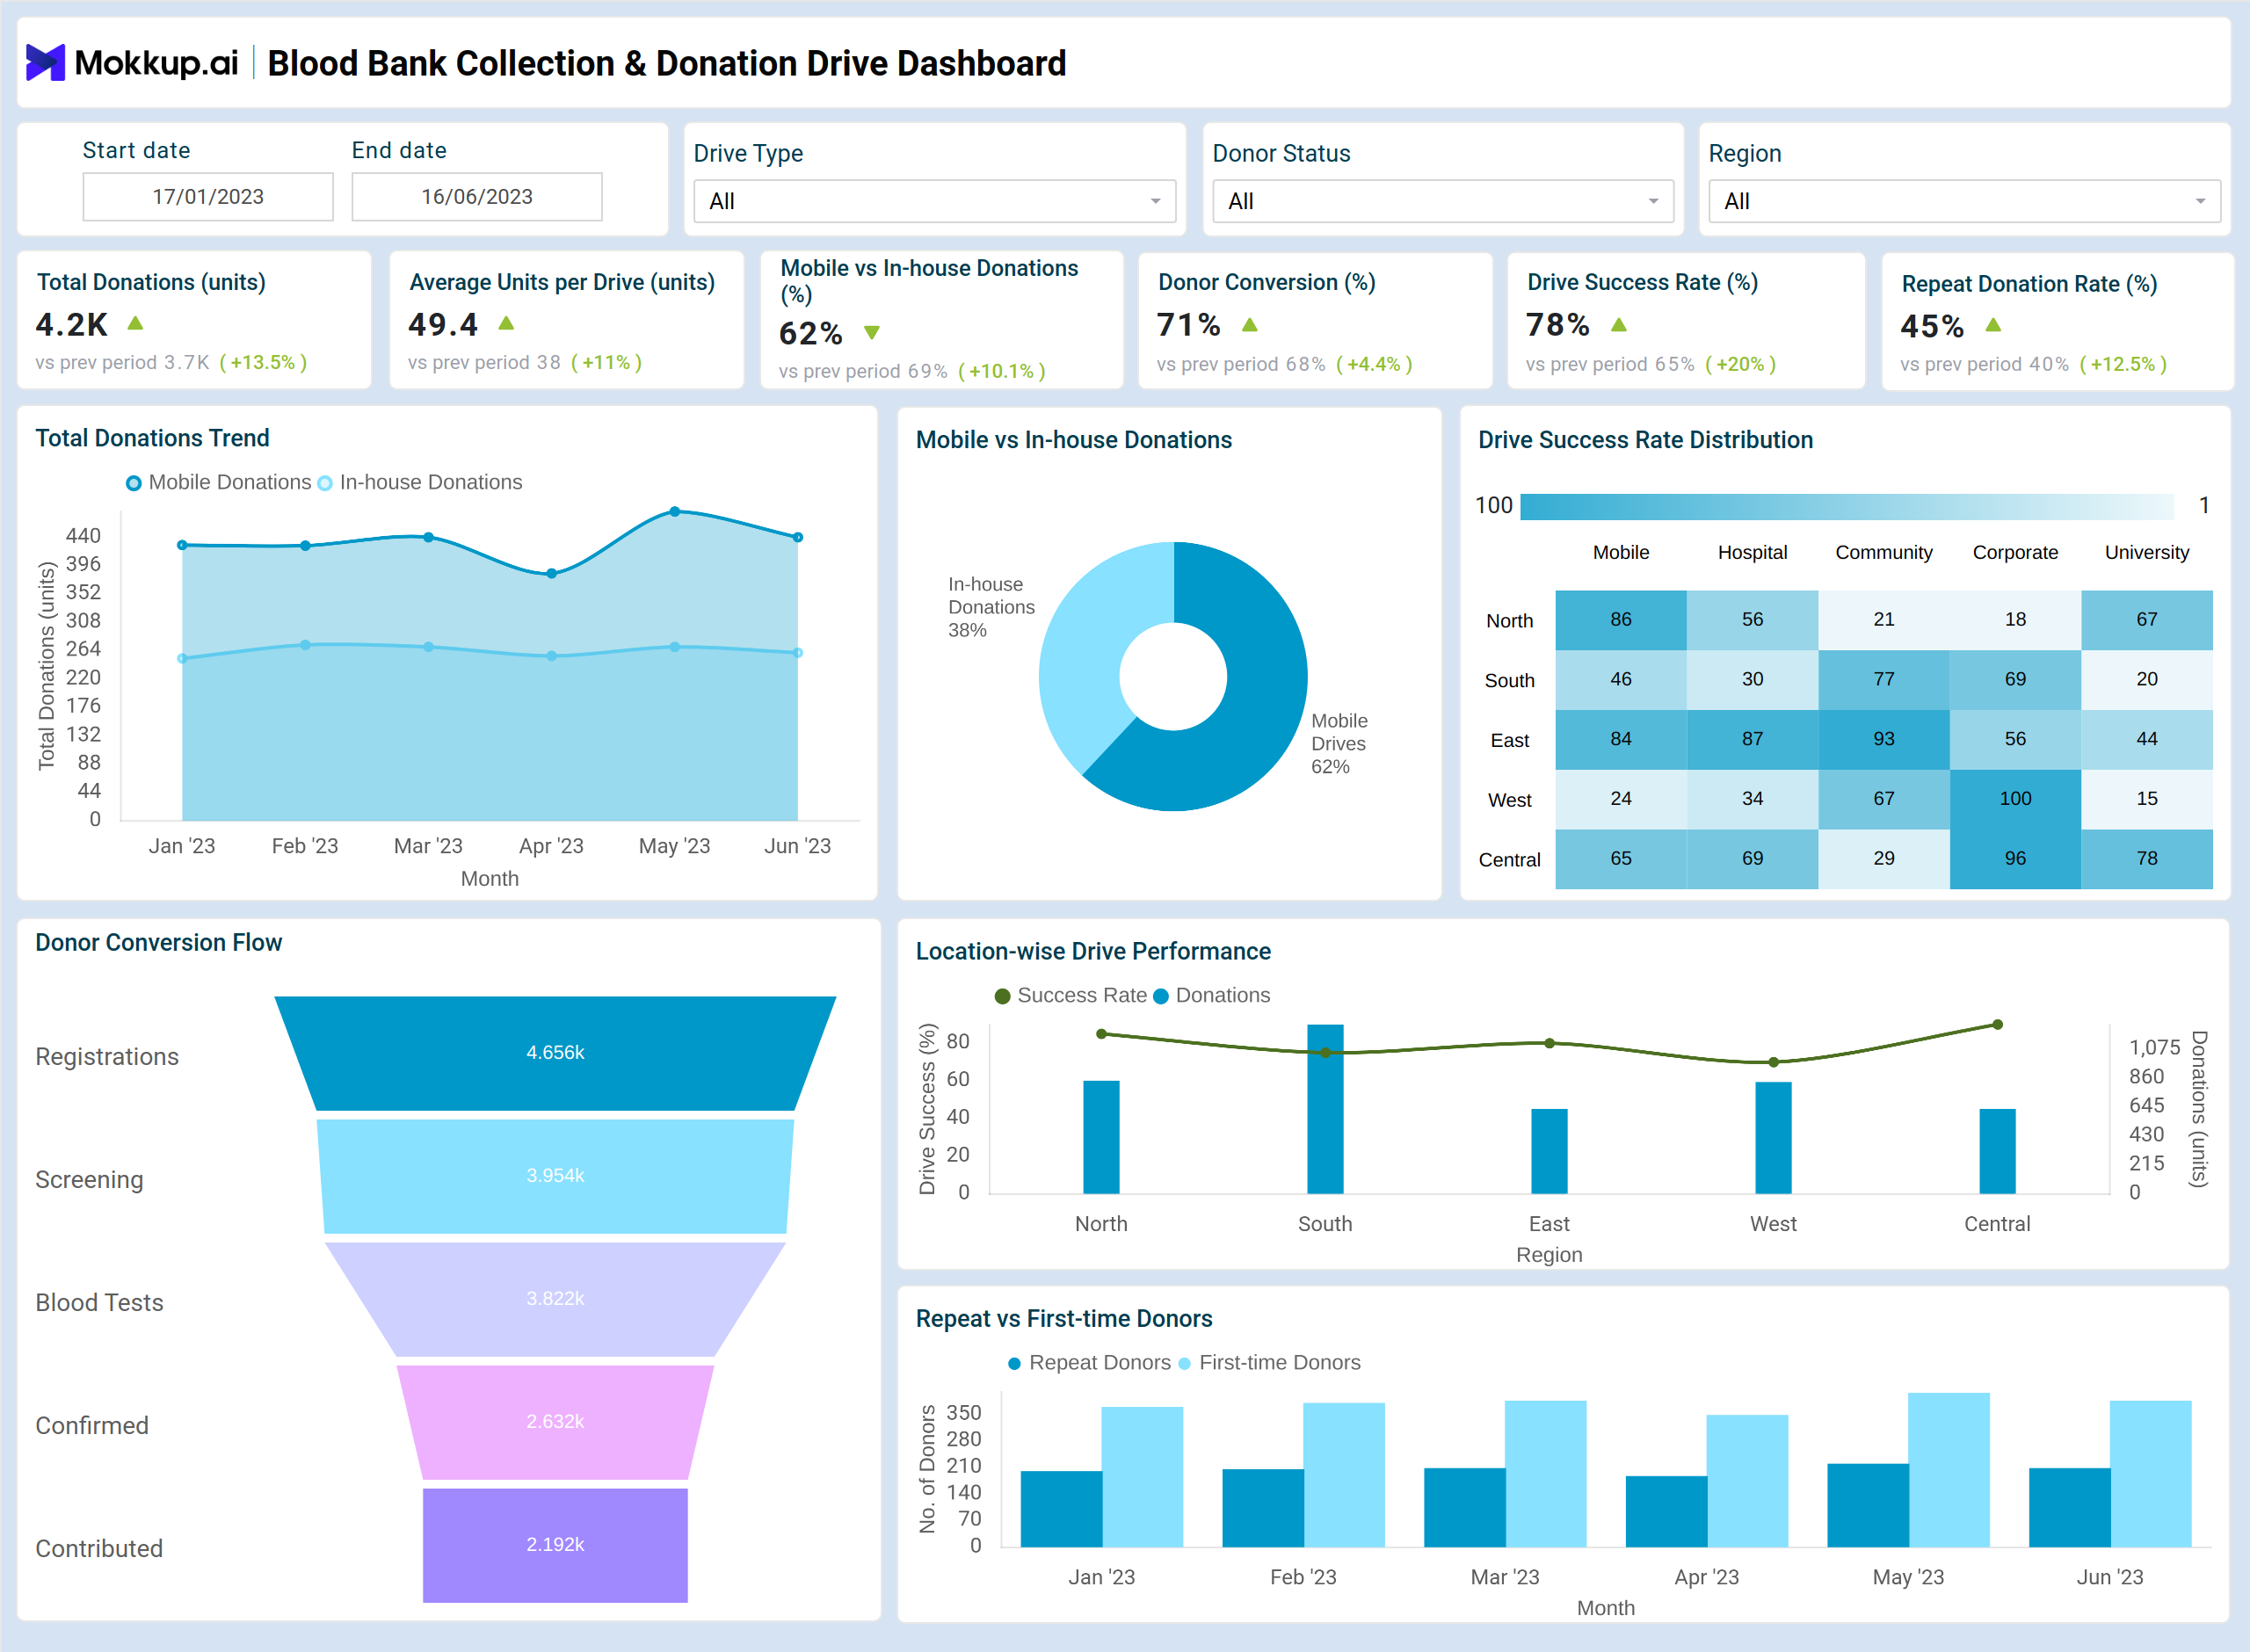
A Blood Bank Collection & Donation Drive Dashboard is a centralized platform designed for blood banks to monitor and optimize their operational health. It consolidates key metrics such as total blood bank donations, mobile vs in-house collection proportions, donor conversion rates, repeat donation behavior, and drive success rates, providing actionable insights for executives. This real-time blood collection tracking dashboard enables organizations to track performance, improve blood donor participation, and enhance overall collection outcomes across multiple drives and locations.
How To Create Blood Bank Collection & Donation Drive Dashboards?
You don’t need to build your report from scratch—just start with a ready-to-use Blood bank collection & donation drive dashboard template from Mokkup. Plug in your own data and export it however you like. Here’s how to do it:
1. Create or Log in to Your Mokkup Account
Start by signing up on Mokkup.ai using your email. Already have an account? Just log in, and you’re good to go.
2. Choose and Customize Your Dashboard Template
Find the Blood Bank Collection & Donation Drive Dashboard template in the Templates section. Use the drag-and-drop editor to adjust KPIs, edit filters, or add elements based on your data.
3. Export to Your BI Tool
Once your dashboard is ready, use the BI Tool Export feature to send it directly to Power BI or Tableau for further analysis and enhancements. You can also download the dashboard as a PDF, PNG, or JPEG, embed it on a platform, or invite your team to collaborate.
Note: This is a Pro template. To use and customize this dashboard wireframe, you’ll need a Pro subscription on Mokkup. Upgrade anytime to unlock full access.
Blood Bank Collection & Donation Drive Dashboard Example
Create your personalized Blood Bank Collection & Donation Drive Dashboard by bringing all your key operational and donor metrics into one view. This Blood bank operations monitoring system provides a structured layout to help visualize and organize blood bank activities, including donation trends, mobile vs in-house collection proportions, first-time vs repeat donors, donor conversion flows, and location-wise drive performance. With flexible elements and filters, you can tailor the dashboard to focus on specific drives, regions, or donor segments. Once configured, the dashboard can be integrated with BI tools like Power BI or Tableau for deeper analysis and reporting, enabling blood bank executives to track performance, optimize drive operations tracking, and improve donor engagement effectively.
How to Analyze Data in Blood Bank Collection & Donation Drive Dashboards?
To make the most of your Blood bank collection and donation drive dashboard, follow the below actions:
- Monitor donation trends to identify high-performing months and peak drive periods.
- Compare mobile vs in-house donations to optimize resource allocation.
- Track first-time vs repeat donors to evaluate donor acquisition and retention strategies.
- Use conversion funnels to pinpoint stages where donors drop off and improve turnout.
- Analyze location-wise drive performance to focus on regions with lower collections or success rates.
- Filter by drive type, region, or campaign to uncover insights specific to each outreach effort.
With this approach, this dashboard can also be used as a Blood donation drive analytics dashboard for comprehensive insights and decision-making.
Benefits of Blood Bank Collection & Donation Drive Dashboard
Implementing a Blood bank collection and donation drive template helps healthcare facilities with the following:
- Centralized Monitoring: All drive metrics in one place for easier decision-making.
- Operational Efficiency: Identify drives that exceed or fall short of targets.
- Donor Insights: Gain actionable insights with donor conversion and retention analytics to understand engagement patterns and conversion rates.
- Resource Allocation: Optimize mobile and in-house drive planning.
- Data-driven Strategy: Prioritize regions and campaigns based on performance.
- Executive-ready Reporting: High-contrast visuals and KPI summaries for leadership review.
KPIs to Track in the Blood Bank Collection & Donation Drive Dashboards
- Total Donations (Daily/Monthly): Measure the overall collection volume.
- Average Units Collected per Drive: Evaluate operational efficiency.
- Mobile vs In-house Donations %: Track donation sources.
- Donor Conversion %: Monitor the percentage of registered donors who actually donated.
- Drive Success % (Target vs Actual): Assess goal achievement for each drive.
- Repeat Donation Rate: Measure donor loyalty and engagement over time.
Frequently Asked Questions
1. How do I interpret donor conversion data?
Donor conversion measures the percentage of registered donors who successfully donate. Lower conversion rates indicate drop-offs during registration, screening, or drive attendance.
2. Can this dashboard track mobile vs in-house drive performance separately?
Yes, visualizations like donut charts and filtered bar charts can compare mobile and in-house donations side by side.
3. Who can use the Blood Bank Collection & Donation Drive Dashboard?
This dashboard is designed for blood bank managers, hospital administrators, and nonprofit coordinators looking to monitor donation drives, track donor engagement, and optimize collection operations efficiently.