What is a Blood Bank Awareness & Marketing Dashboard?
A Blood Bank Awareness & Marketing Dashboard template is a visual reporting tool that tracks and analyzes campaigns and donor acquisition activities. It provides insights into campaign reach, engagement, new donor registrations, donation conversion rates, actual donations, and campaign ROI.
This dashboard wireframe is used by marketing teams, campaign managers, and blood bank coordinators. It helps identify high-performing campaigns, optimize engagement, monitor donor acquisition, and ensure that marketing efforts translate into actual blood donations, all critical for maintaining a reliable donor base. Essentially, it serves as a Donor Acquisition Dashboard and Blood donation campaign analytics tool that combines both online and offline campaign data.
How to Create a Blood Bank Awareness & Marketing Dashboard
You don’t need to build your dashboard from scratch—just start with a ready-to-use Blood Bank Awareness & Marketing Dashboard template from Mokkup. Add your campaign and donor data, then export it however you like. Here’s how to do it:
1. Create or Log in to Your Mokkup Account
Start by signing up on Mokkup.ai using your email. Already have an account? Just log in, and you’re good to go.=
2. Choose and Customize Your Dashboard Template
Find the Blood Bank Awareness & Marketing Dashboard in the Templates section. Use the drag-and-drop editor to adjust KPIs, edit filters, or add visuals based on your campaign and donor data. You can track both online and offline campaigns easily, making it a comprehensive Social & Offline Donor Tracking tool.
3. Export to Your BI Tool
Once your dashboard wireframe is ready, use the BI Tool Export feature to send it directly to Power BI, Tableau, or any other preferred platform for further analysis and enhancements. You can also download the dashboard as a PDF, PNG, or JPEG, embed it on your platform, or invite your team to collaborate.
Note: This is a Pro template. To use and customize this dashboard wireframe, you’ll need a Pro subscription on Mokkup. Upgrade anytime to unlock full access.
Blood Bank Awareness & Marketing Dashboard Example
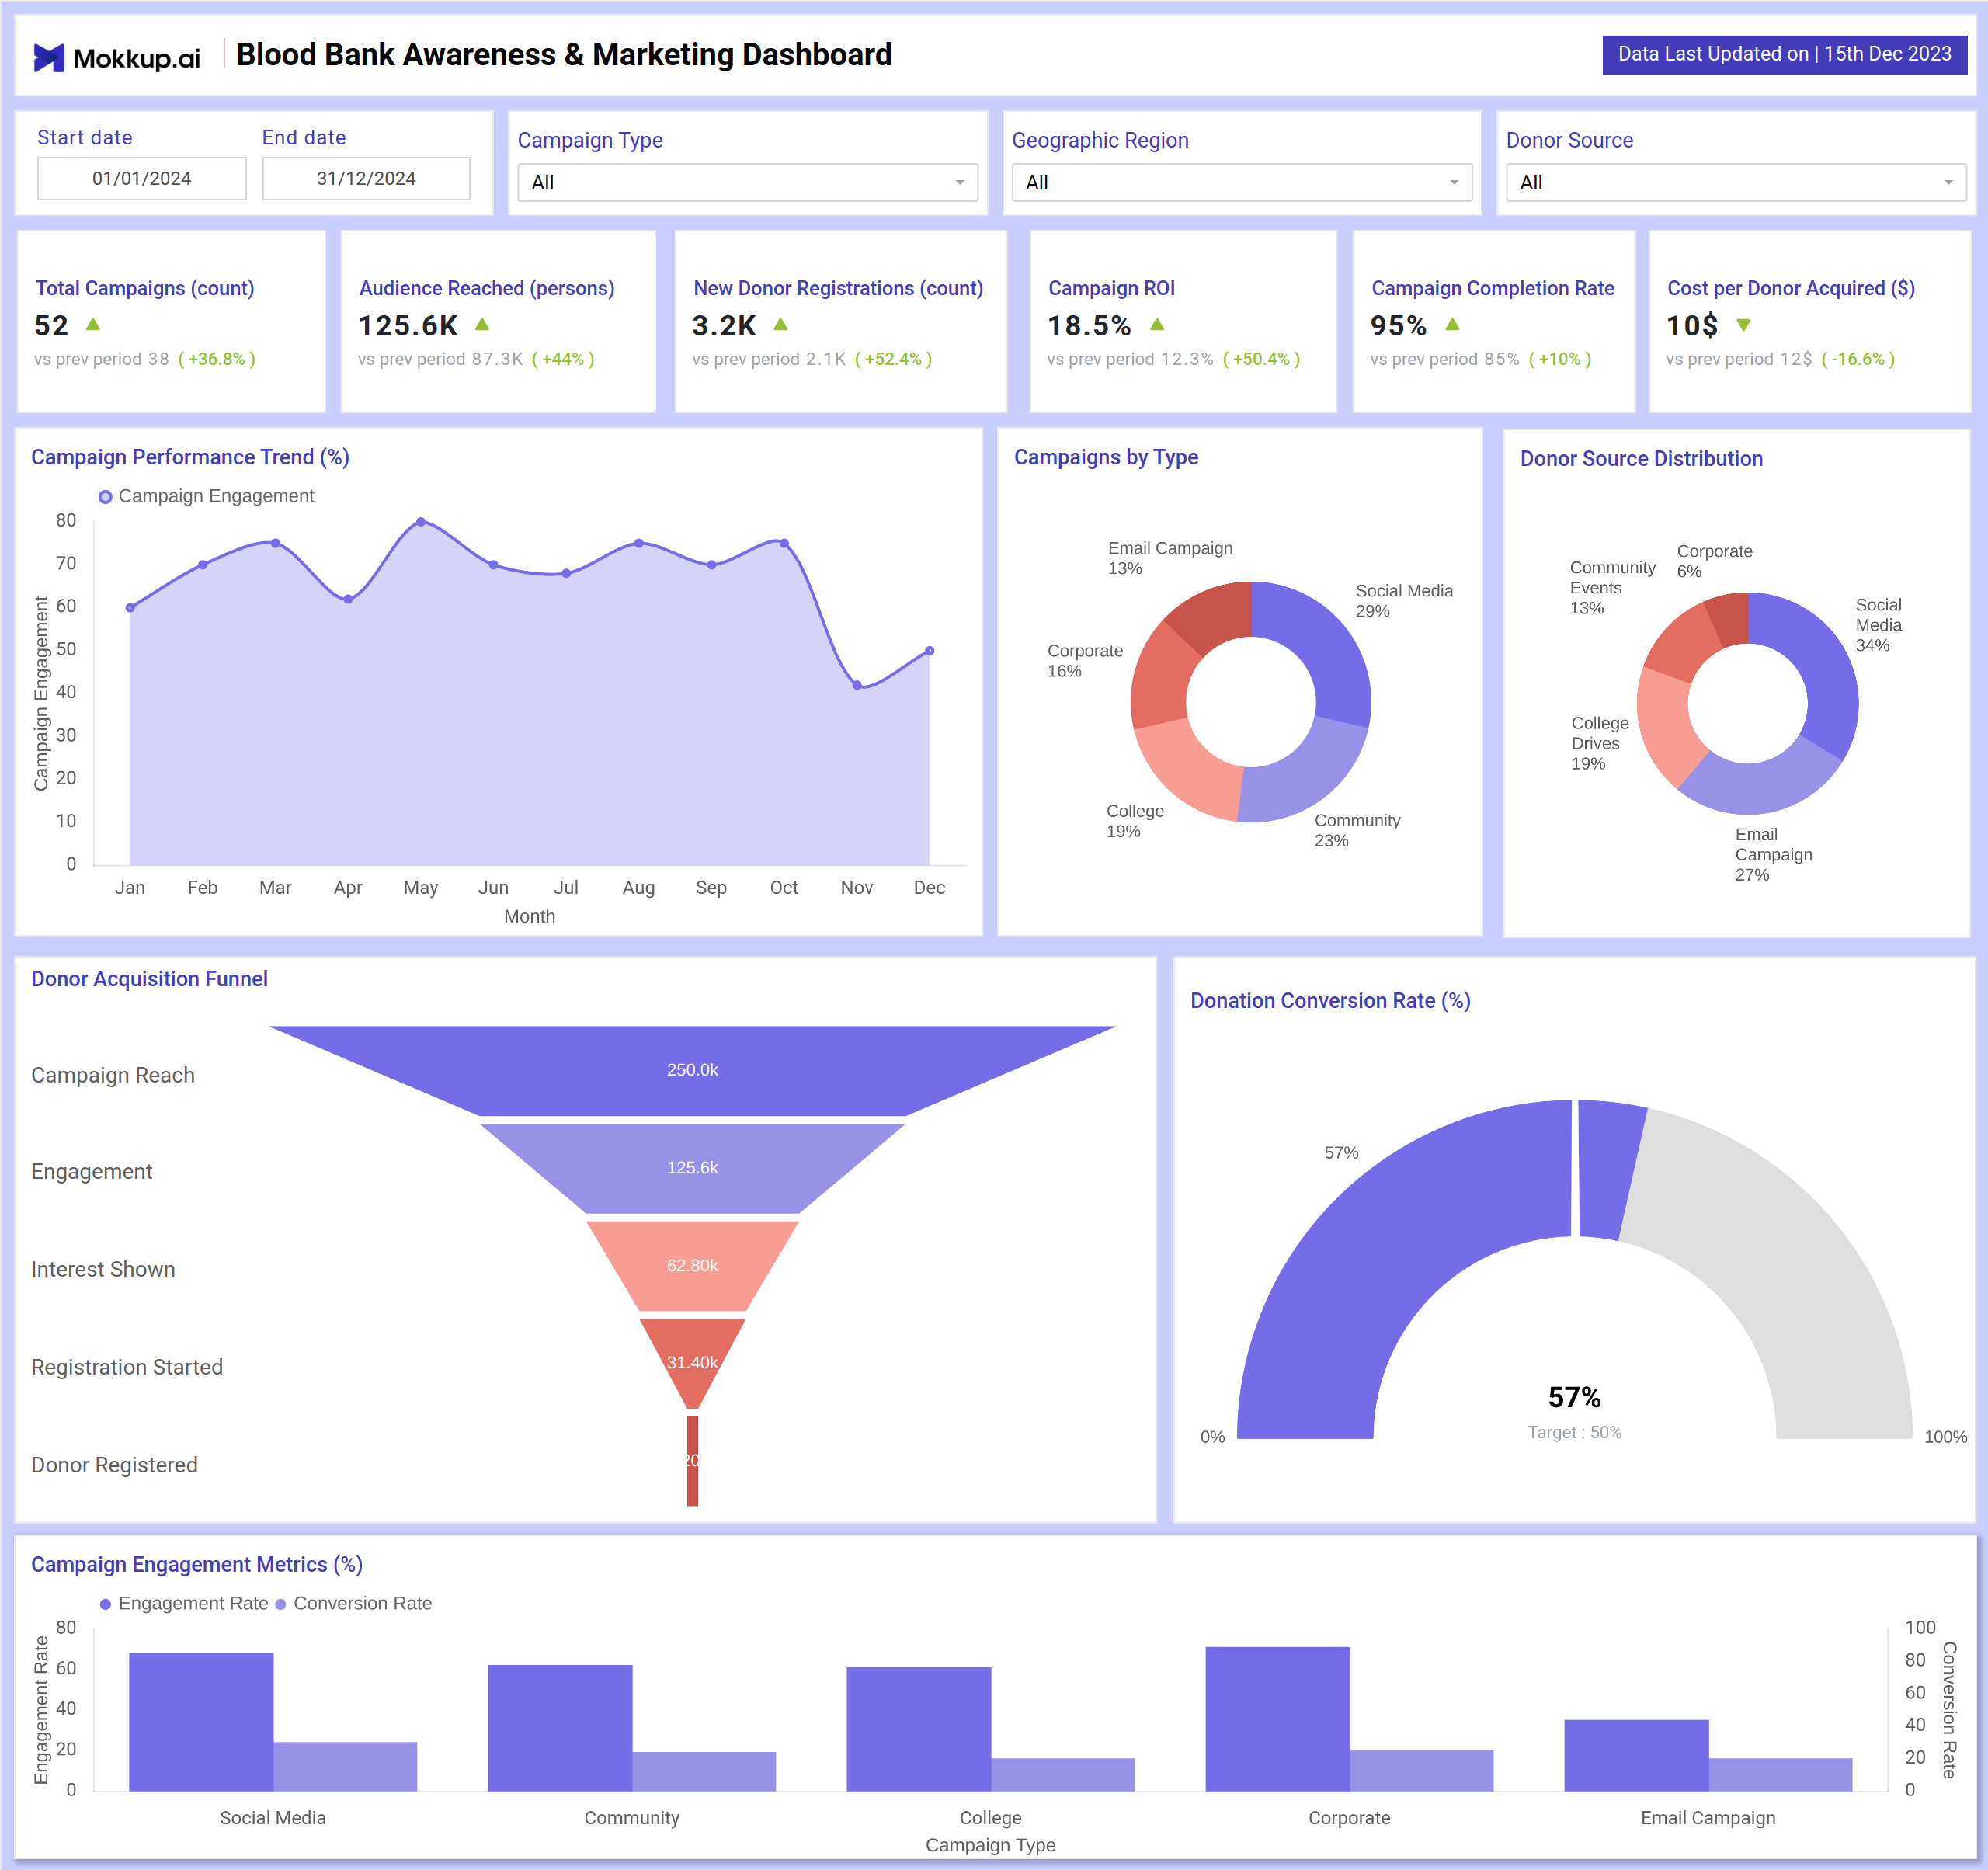
The dashboard wireframe clearly shows the marketing funnel from campaign planning to actual donations. The top row KPI cards include total campaigns, audience reached, engagement rate, new donor registrations, and donation conversion rate. These are essential metrics for Blood Donor Registration Reporting. The dashboard also includes a month-wise comparison of engagement, registrations, and donations. Gauging charts or bar charts highlight the most effective campaigns, allowing your dashboard to function as a campaign ROI tracking tool.
This template helps marketing teamsspot trends, compare channels, and optimize campaigns to maximize donor acquisition and engagement, serving as a robust Awareness Campaign Analytics platform.
Benefits of Blood Bank Awareness & Marketing Dashboards
Blood Bank Awareness & Marketing Dashboards offer clarity and streamline marketing efforts. Here are the key benefits:
- Improved Campaign Planning: Track execution and completion rates in real time.
- Better Audience Engagement: Identify which campaigns and channels drive the highest interaction.
- Increased Donor Registrations: Monitor and optimize registration conversion rates.
- Efficient Marketing Spend: Track cost per donor and ROI for each campaign.
- Clear Campaign Insights: Quickly see which campaigns and channels are performing best.
- Data-Driven Decisions: Adjust strategy for timing, messaging, and channel effectiveness.
These dashboards transform complex marketing and donor data into actionable insights for marketing teams and blood bank coordinators. By using them, organizations can reach more people, acquire new donors, and drive actual blood donations efficiently.
KPIs to Track in Blood Bank Awareness & Marketing Dashboard
Tracking the right KPIs helps marketing teams improve campaign performance, engagement, and donor acquisition. Key metrics include:
- Total Campaigns Conducted: Number of campaigns executed in a selected period.
- Campaign Completion Rate (%): % of planned campaigns successfully executed.
- Total Audience Reached: Total people exposed to campaigns.
- Engagement Rate (%): % of audience interacting with campaigns (likes, shares, clicks, event attendance).
- New Donor Registrations: People who signed up to donate after the campaigns.
- Donation Conversion Rate (%): % of registered donors who actually donated.
- Actual Donations from Campaigns: Number of donations collected.
- Cost per Donor Acquired: Average marketing spend per donor.
- Campaign ROI (%): Return on investment for campaigns.
- Month-over-Month Growth (%): Trend of donors, engagement, and registrations compared to previous months.
- Top Performing Campaigns: Campaigns with the highest engagement or registrations.
- Channel Performance: Insights into the most effective platforms and donor sources.
How to Analyze Data in Blood Bank Awareness & Marketing Dashboards
Analyzing the dashboard helps identify what’s working and what needs improvement:
- Monitor campaign execution and completion rate to ensure planning efficiency.
- Track engagement rate vs. audience reached to understand which campaigns resonate most.
- Analyze new donor registrations and conversion rates to optimize the funnel from interest to actual donation.
- Review campaign ROI and cost per donor to allocate budgets effectively.
- Compare channels and donor sources to focus efforts on the most productive platforms.
Charts like line graphs, bar charts, donut charts, and gauge charts make it easy to spot trends, highlight bottlenecks, and measure campaign effectiveness at a glance.
Frequently Asked Questions
1. What is a Blood Bank Awareness & Marketing Dashboard?
A visual tool to monitor campaigns, engagement, donor registrations, donations, and ROI for blood donation programs.
2. Who uses this dashboard?
Marketing teams, campaign managers, and blood bank coordinators can use this dashboard.
3. What are the most important metrics to track?
Total campaigns, audience reached, engagement rate, new donor registrations, donation conversion rate, cost per donor, and campaign ROI are some important metrics to track in a Blood bank awareness dashboard.