The On-Site Operations Tracker dashboard template provides a comprehensive view of operations, helping businesses track service performance, workforce productivity, and key operational metrics.
Service Performance Overview
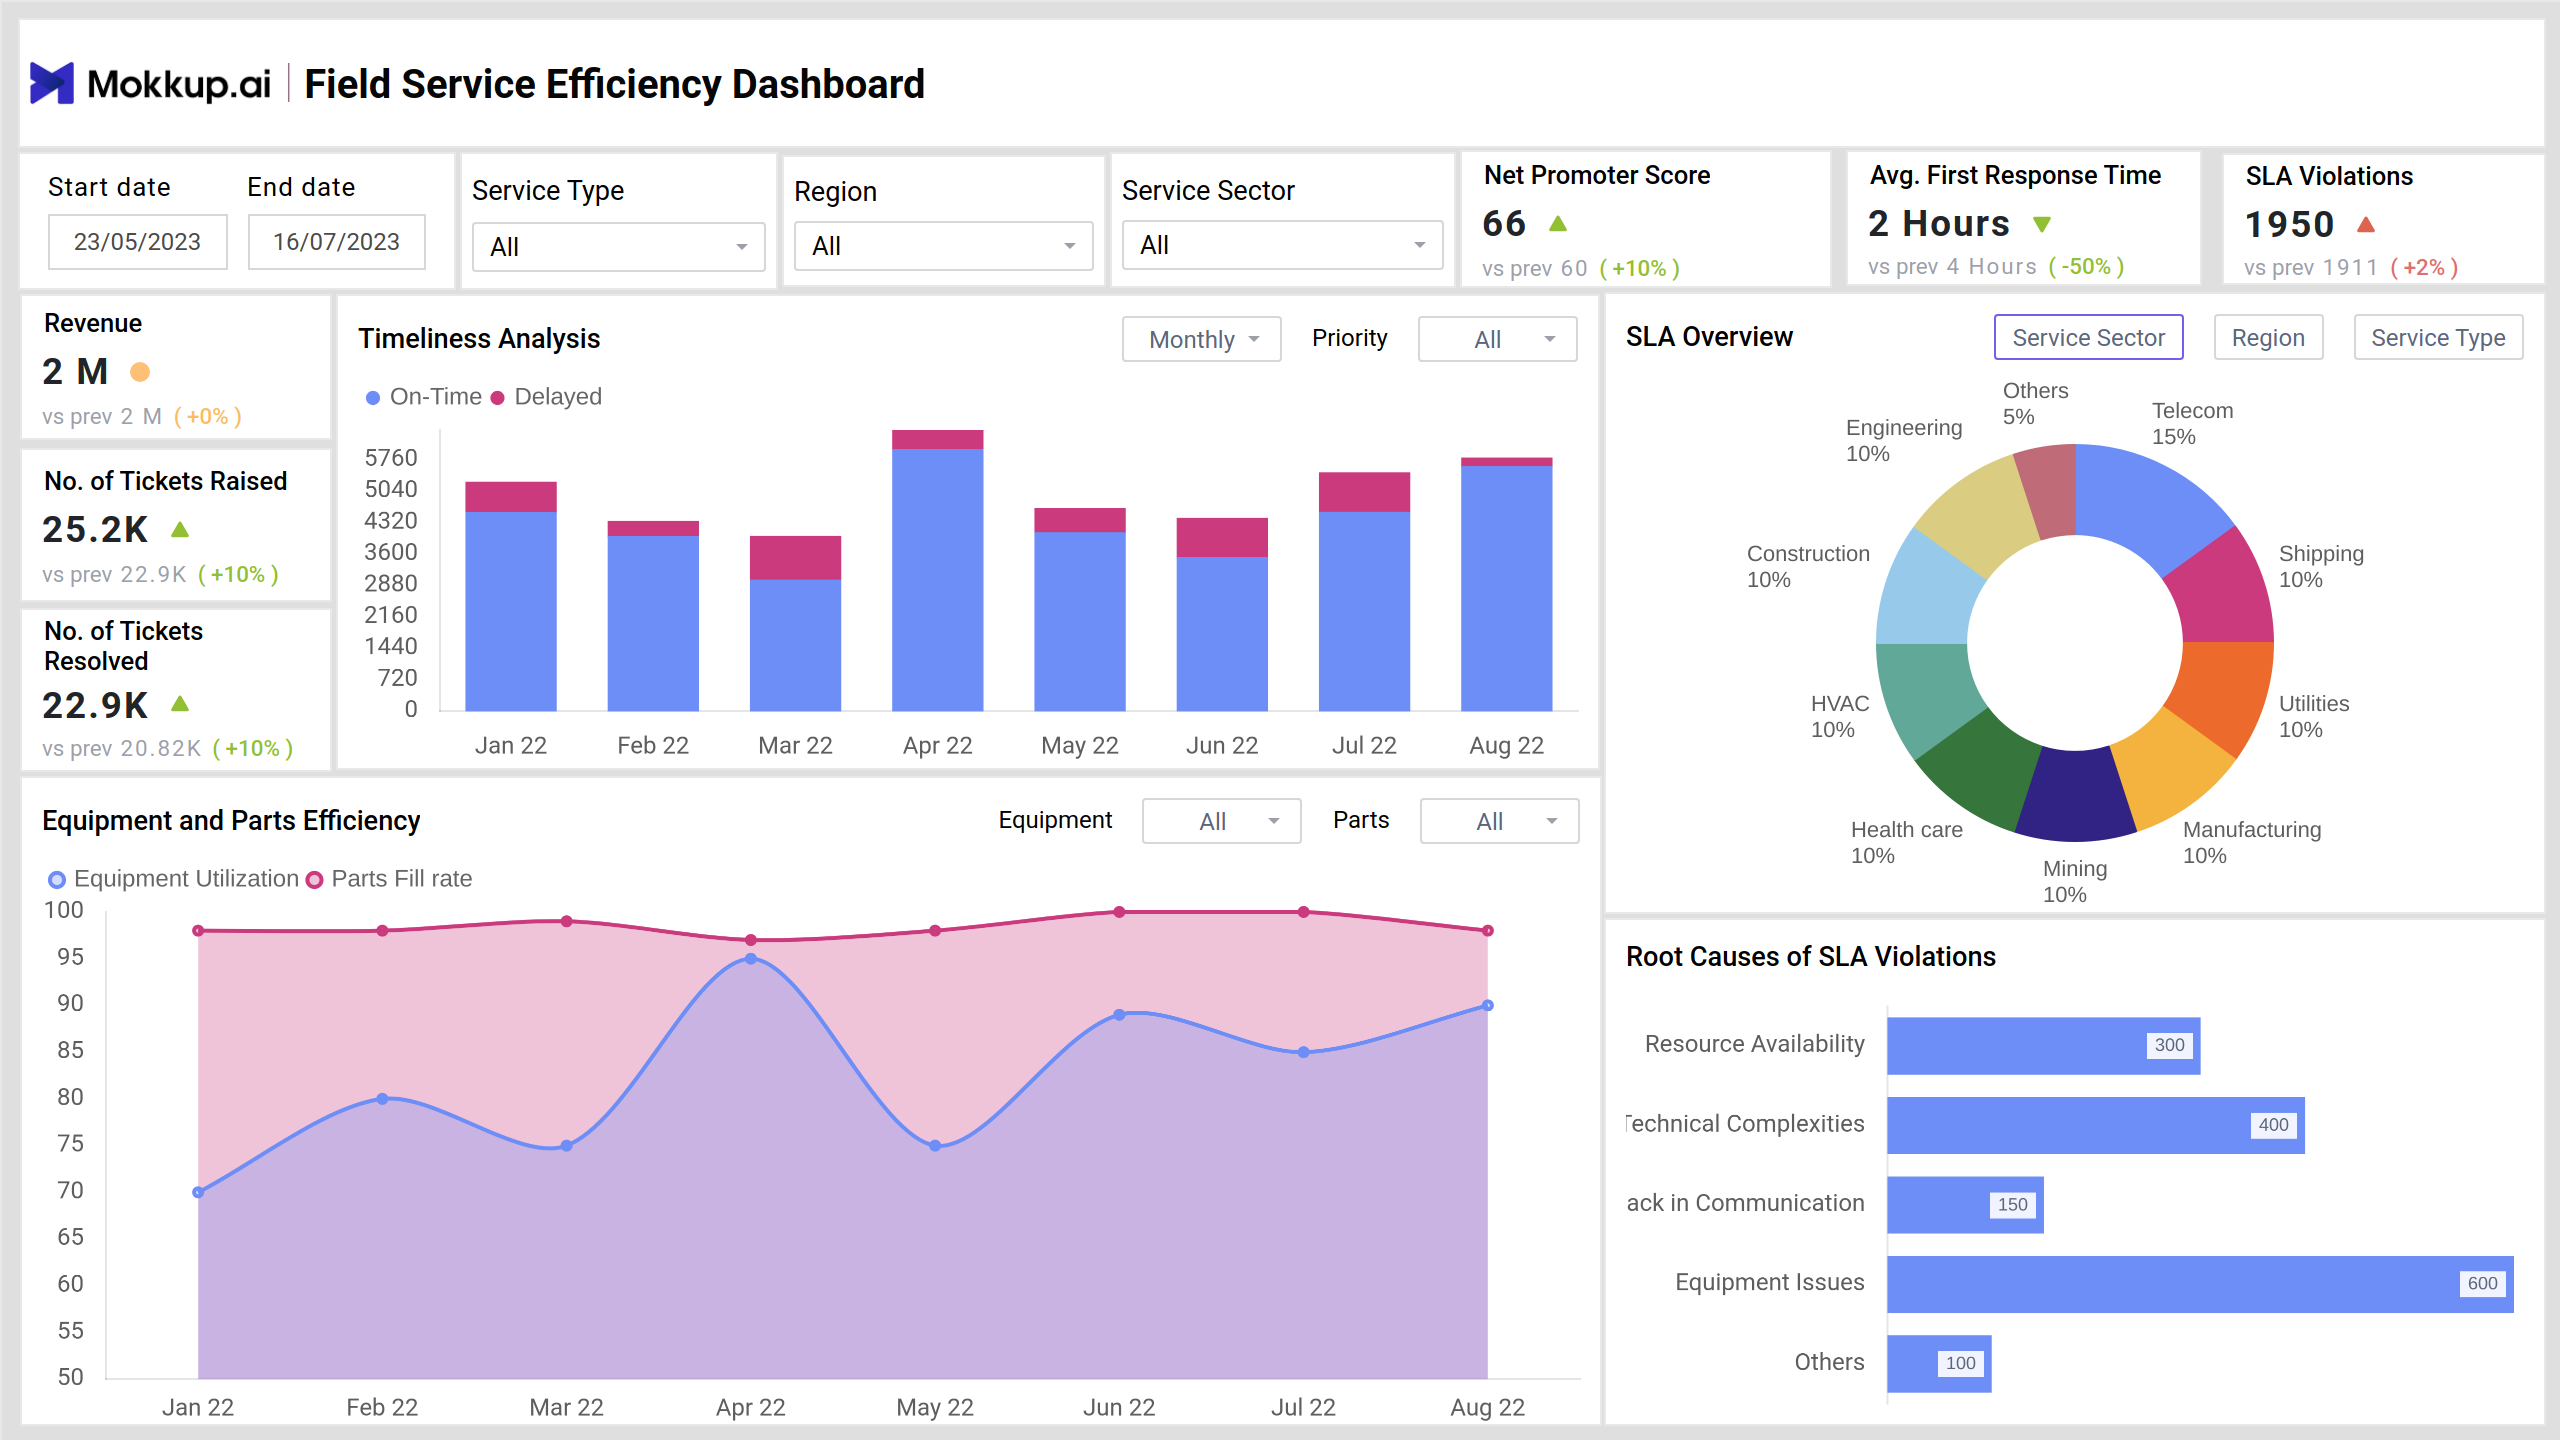
This screen provides a detailed view of operational performance, highlighting key metrics related to workload, efficiency, and responsiveness. It includes trends over time, performance breakdowns by category, and factors influencing overall effectiveness. The visual elements help analyze service quality, identify bottlenecks, and make informed decisions for improving outcomes.
Key Terms to Know
- Revenue: This KPI gives a snapshot of overall earnings, helping businesses monitor financial performance over time.
- No. of Tickets Raised & Resolved: These metrics provide insights into service demand and efficiency in resolving customer issues.
- Net Promoter Score (NPS): A crucial indicator of customer satisfaction, NPS helps evaluate service quality and overall client experience.
- Average First Response Time: This KPI measures the speed of initial response to service requests, ensuring customer expectations are met.
- SLA Violations: Tracks service level agreement breaches, helping teams identify operational inefficiencies.
- Timeliness Analysis: Displays on-time vs. delayed service execution, ensuring adherence to deadlines.
- Equipment and Parts Efficiency: Monitors equipment utilization and parts availability, optimizing resource management.
- SLA Overview Pie: Categorizes service performance across different sectors, highlighting areas that need attention.
- Root Causes of SLA Violations Chart: Identifies common issues impacting SLA adherence, supporting targeted improvements.
Workforce Productivity & Operational Efficiency
This screen presents an overview of workforce efficiency, focusing on task completion, employee distribution, and key performance trends. It provides insights into workload patterns, engagement levels, and mobility, helping to assess productivity. The visual data highlights areas that may require improvements in resource allocation, time management, and workforce training.
Key Terms to Know
- Remote Diagnostics Success Rate: Measures the effectiveness of remote troubleshooting, reducing the need for on-site visits.
- Work Effectiveness Analysis: Displays the correlation between work orders and Mean Time to Repair (MTTR), ensuring service efficiency.
- Employees by Age Group: Provides insights into workforce demographics, assisting in resource planning and recruitment strategies.
- Field Coverage: Compares site visits and distance traveled, ensuring optimal workforce allocation.
- Absenteeism Rate: Tracks employee attendance patterns, helping manage workforce availability.
- Field Worker Productivity: Breaks down active, idle, and travel time, optimizing workforce efficiency.
- Field Technician Training & Certification: Highlights the status of training and certifications, ensuring workforce competency.
Dashboard Template Insights
Here are the key insights the dashboard wireframe provides:
- Tracks key operational metrics, helping teams assess efficiency and identify areas for improvement.
- Provides insights into workforce distribution, absenteeism, and productivity levels.
- Displays visit frequency and travel data to optimize field operations.
- Highlights workforce skill levels, ensuring compliance and readiness for tasks.
Conclusion
This On-Site Operations Tracker Dashboard wireframe is a powerful tool that transforms raw data into actionable insights. By tracking service operations, workforce productivity, and key performance metrics, businesses can drive efficiency, reduce downtime, and enhance customer satisfaction.