
What is a Blood Donor Management Dashboard?
A Blood Donor Management Dashboard is a healthcare analytics tool that helps organizations monitor donor registrations, retention strategy, engagement, and recruitment campaigns. By combining donor demographics, donation frequency, and outreach performance into a single view, it ensures blood banks and healthcare facilities can streamline donor management, improve retention, and expand outreach.
The blood donor management dashboard template also provides real-time insights into donor engagement levels, repeat donation rates, and campaign conversion efficiency. As a real-time donor tracking dashboard, it helps healthcare providers optimize donor availability while ensuring a continuous blood supply.
How To Create a Blood Donor Management Dashboard
You don’t need to build your report from scratch—just start with a ready-to-use Blood donor management dashboard dashboard template from Mokkup. Add in your data and export it however you like. Here’s how to do it:
1. Create or Log in to Your Mokkup Account
Start by signing up on Mokkup.ai using your email. If you already have an account, just log in, and you’ll be good to go.
2. Choose and Customize Your Dashboard Template
Find the Blood Donor Management Dashboard template in the Templates section. Use the drag-and-drop editor to adjust KPIs, edit filters, or add elements based on your data.
3. Export to Your BI Tool
Once your dashboard wireframe is ready, use the BI Tool Export feature to send it directly to Power BI or Tableau for further analysis and enhancements. You can also download the dashboard as a PDF, PNG, or JPEG, embed it on a platform, or invite your team to collaborate.
Note: This is a Pro template. You’ll need a Pro subscription on Mokkup to use and customize this dashboard wireframe. Upgrade anytime to unlock full access.
Blood Donor Management Dashboard Example
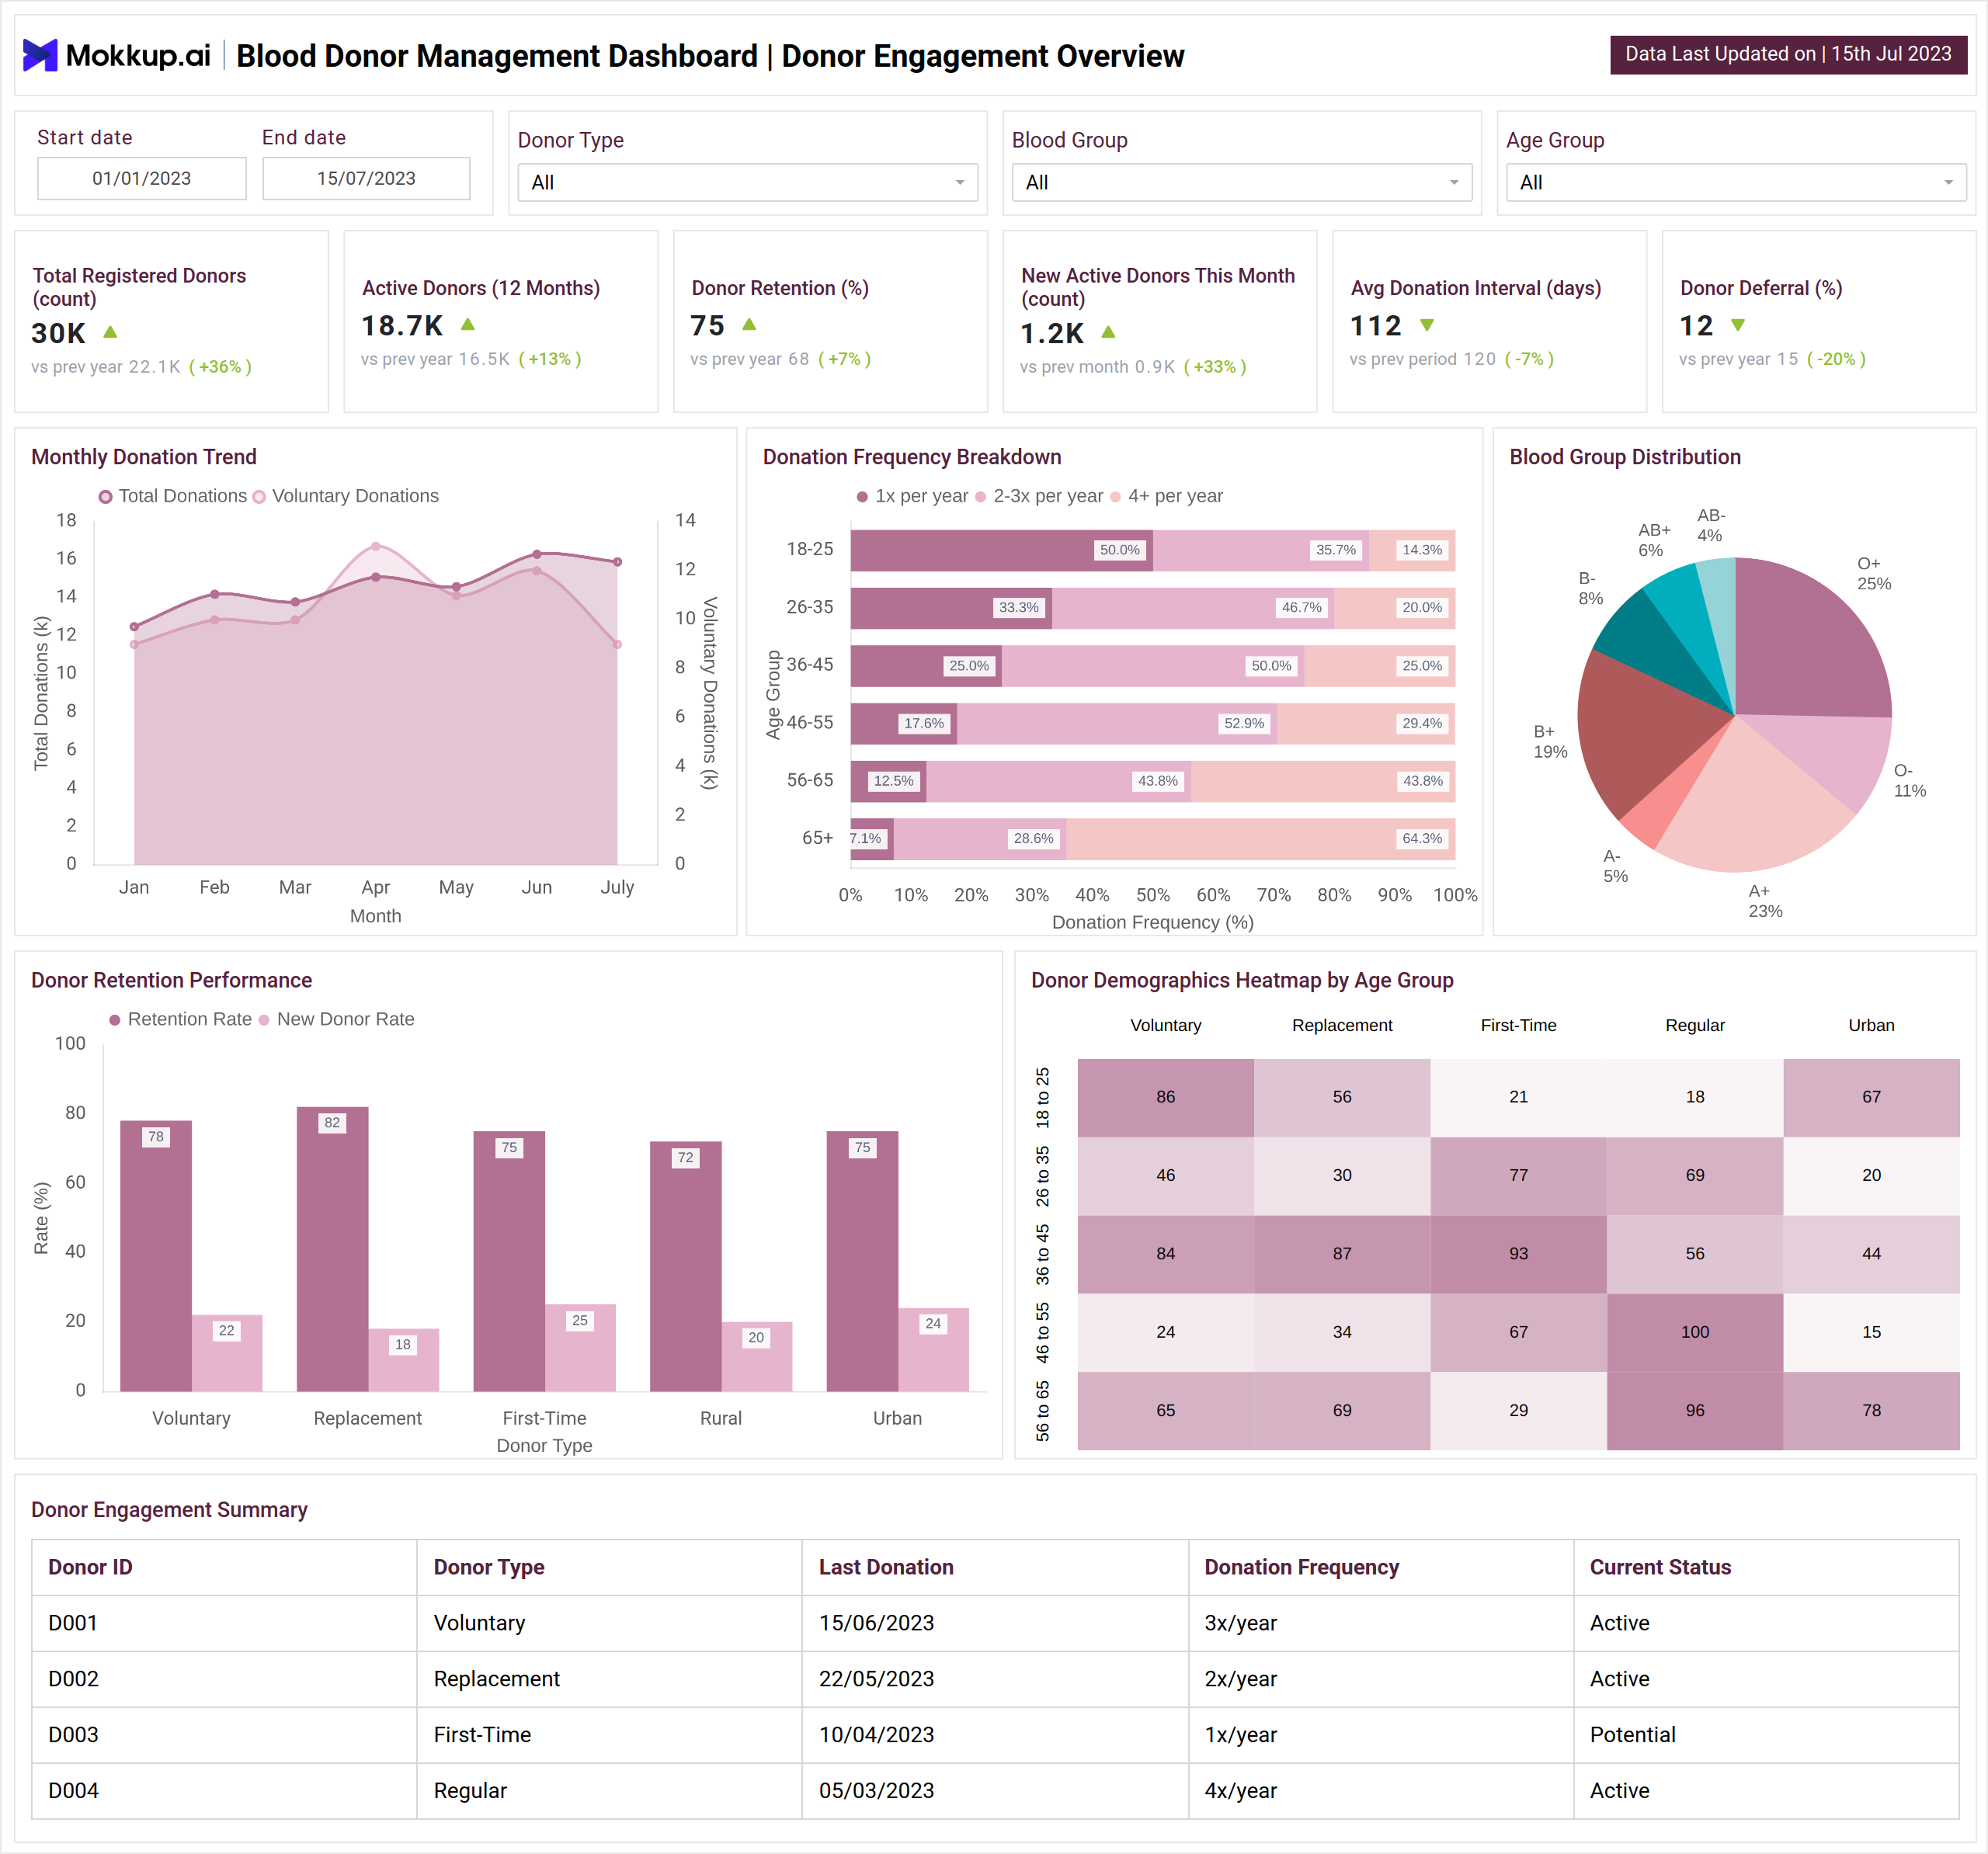
Build a donor engagement dashboard that centralizes retention and activity insights. KPIs track total and active donors, retention rate, donation interval, deferrals, and blood group mix. Visuals include a retention chart, donation frequency breakdown, and a demographics heatmap covering voluntary, replacement, and first-time donors.
The donor recruitment and outreach dashboard focuses on acquisition and campaign results. It highlights new donors, referral rate, conversion rate, and repeat donations. A recruitment funnel maps the journey from outreach to repeat engagement, while trend graphs show growth over time.
Together, these views function as a staff utilization performance dashboard, helping teams improve donor participation, streamline outreach, and strengthen long-term retention.
How to Analyze Data in Blood Donor Management Dashboards
- Track Retention Rates: Identify whether first-time donors return and which groups have the highest loyalty.
- Monitor Donor Demographics: Use heatmaps to analyze age, region, and donor type for better targeting.
- Evaluate Recruitment Channels: Compare campaigns like social media or community events for donor acquisition success.
- Optimize Engagement Funnel: Assess drop-offs in the recruitment pipeline to improve outreach strategies.
- Measure Repeat Donation Rates: Track how effectively campaigns convert one-time donors into regular contributors.
Benefits of Blood Donor Management Dashboards
- Improved Donor Retention: Aligns engagement efforts with donor behavior patterns.
- Effective Outreach Campaigns: Provides data-driven insights into recruitment performance.
- Better Blood Supply Planning: Helps predict donation frequency and availability.
- Targeted Donor Engagement: Identifies which demographics respond best to outreach.
- Increased Repeat Donations: Strengthens donor loyalty with consistent follow-up.
KPIs to Track in Blood Donor Management Dashboards
- Donor Retention Rate (%) – Measures the percentage of donors who return for repeat donations.
- New Donors Acquired (count) – Tracks the success of recruitment campaigns.
- Campaign Conversion Rate (%) – Evaluates how well outreach efforts convert interest into actual donations.
- Repeat Donation Rate (%) – Indicates the effectiveness of engagement strategies.
- Active Donors (12 Months) – Provides visibility into consistent donor participation.
Frequently Asked Questions
1. Why do blood banks need a Blood Donor Management Dashboard?
It helps track donor retention, acquisition, and campaign performance, ensuring an adequate blood supply.
2. Can this dashboard integrate with donor CRM systems?
Yes, the blood donor management dashboard template can integrate with CRM or healthcare donor databases for seamless operations.
3. What kind of data does a Blood Donor Management Dashboard track?
It typically includes donor demographics, registration and retention trends, donation frequency, outreach campaign performance, referral rates, and recruitment funnel metrics to help manage engagement and blood supply planning.