
What is a Digital Marketing Analysis Dashboard?
A Digital Marketing Analysis Dashboard is a centralized reporting solution that helps organizations monitor campaign effectiveness, content engagement, and overall digital strategy performance. Teams can visualize real-time KPIs in one place instead of relying on scattered spreadsheets and manual reports.
This dashboard is designed for marketing managers, communication teams, and business leaders who want to track email delivery health, engagement metrics, and content adoption across departments or client segments. Consolidating external campaign data and internal content usage provides a holistic view of digital marketing performance and ROI.
How to Create a Digital Marketing Analysis Dashboard
You don’t need to build your report from scratch; just start with a ready-to-use Digital Marketing Analysis dashboard template from Mokkup. Add in your data and export it however you like. Here’s how to do it:
1. Create or Log in to Your Mokkup Account
Start by signing up on Mokkup.ai using your email. If you already have an account, just log in, and you’ll be good to go.
2. Choose and Customize Your Dashboard Template
Find the digital marketing dashboard template in the Templates section. Use the drag-and-drop editor to adjust KPIs, edit filters, or add elements based on your data.
3. Export to Your BI Tool
Once your dashboard wireframe is ready, use the BI Tool Export feature to send it directly to Power BI or Tableau for further analysis and enhancements. You can also download the dashboard as a PDF, PNG, or JPEG, embed it on a platform, or invite your team to collaborate.
Note: This is a Pro template. You’ll need a Pro subscription on Mokkup to use and customize this dashboard wireframe. Upgrade anytime to unlock full access.
Digital Marketing Analysis Dashboard Example
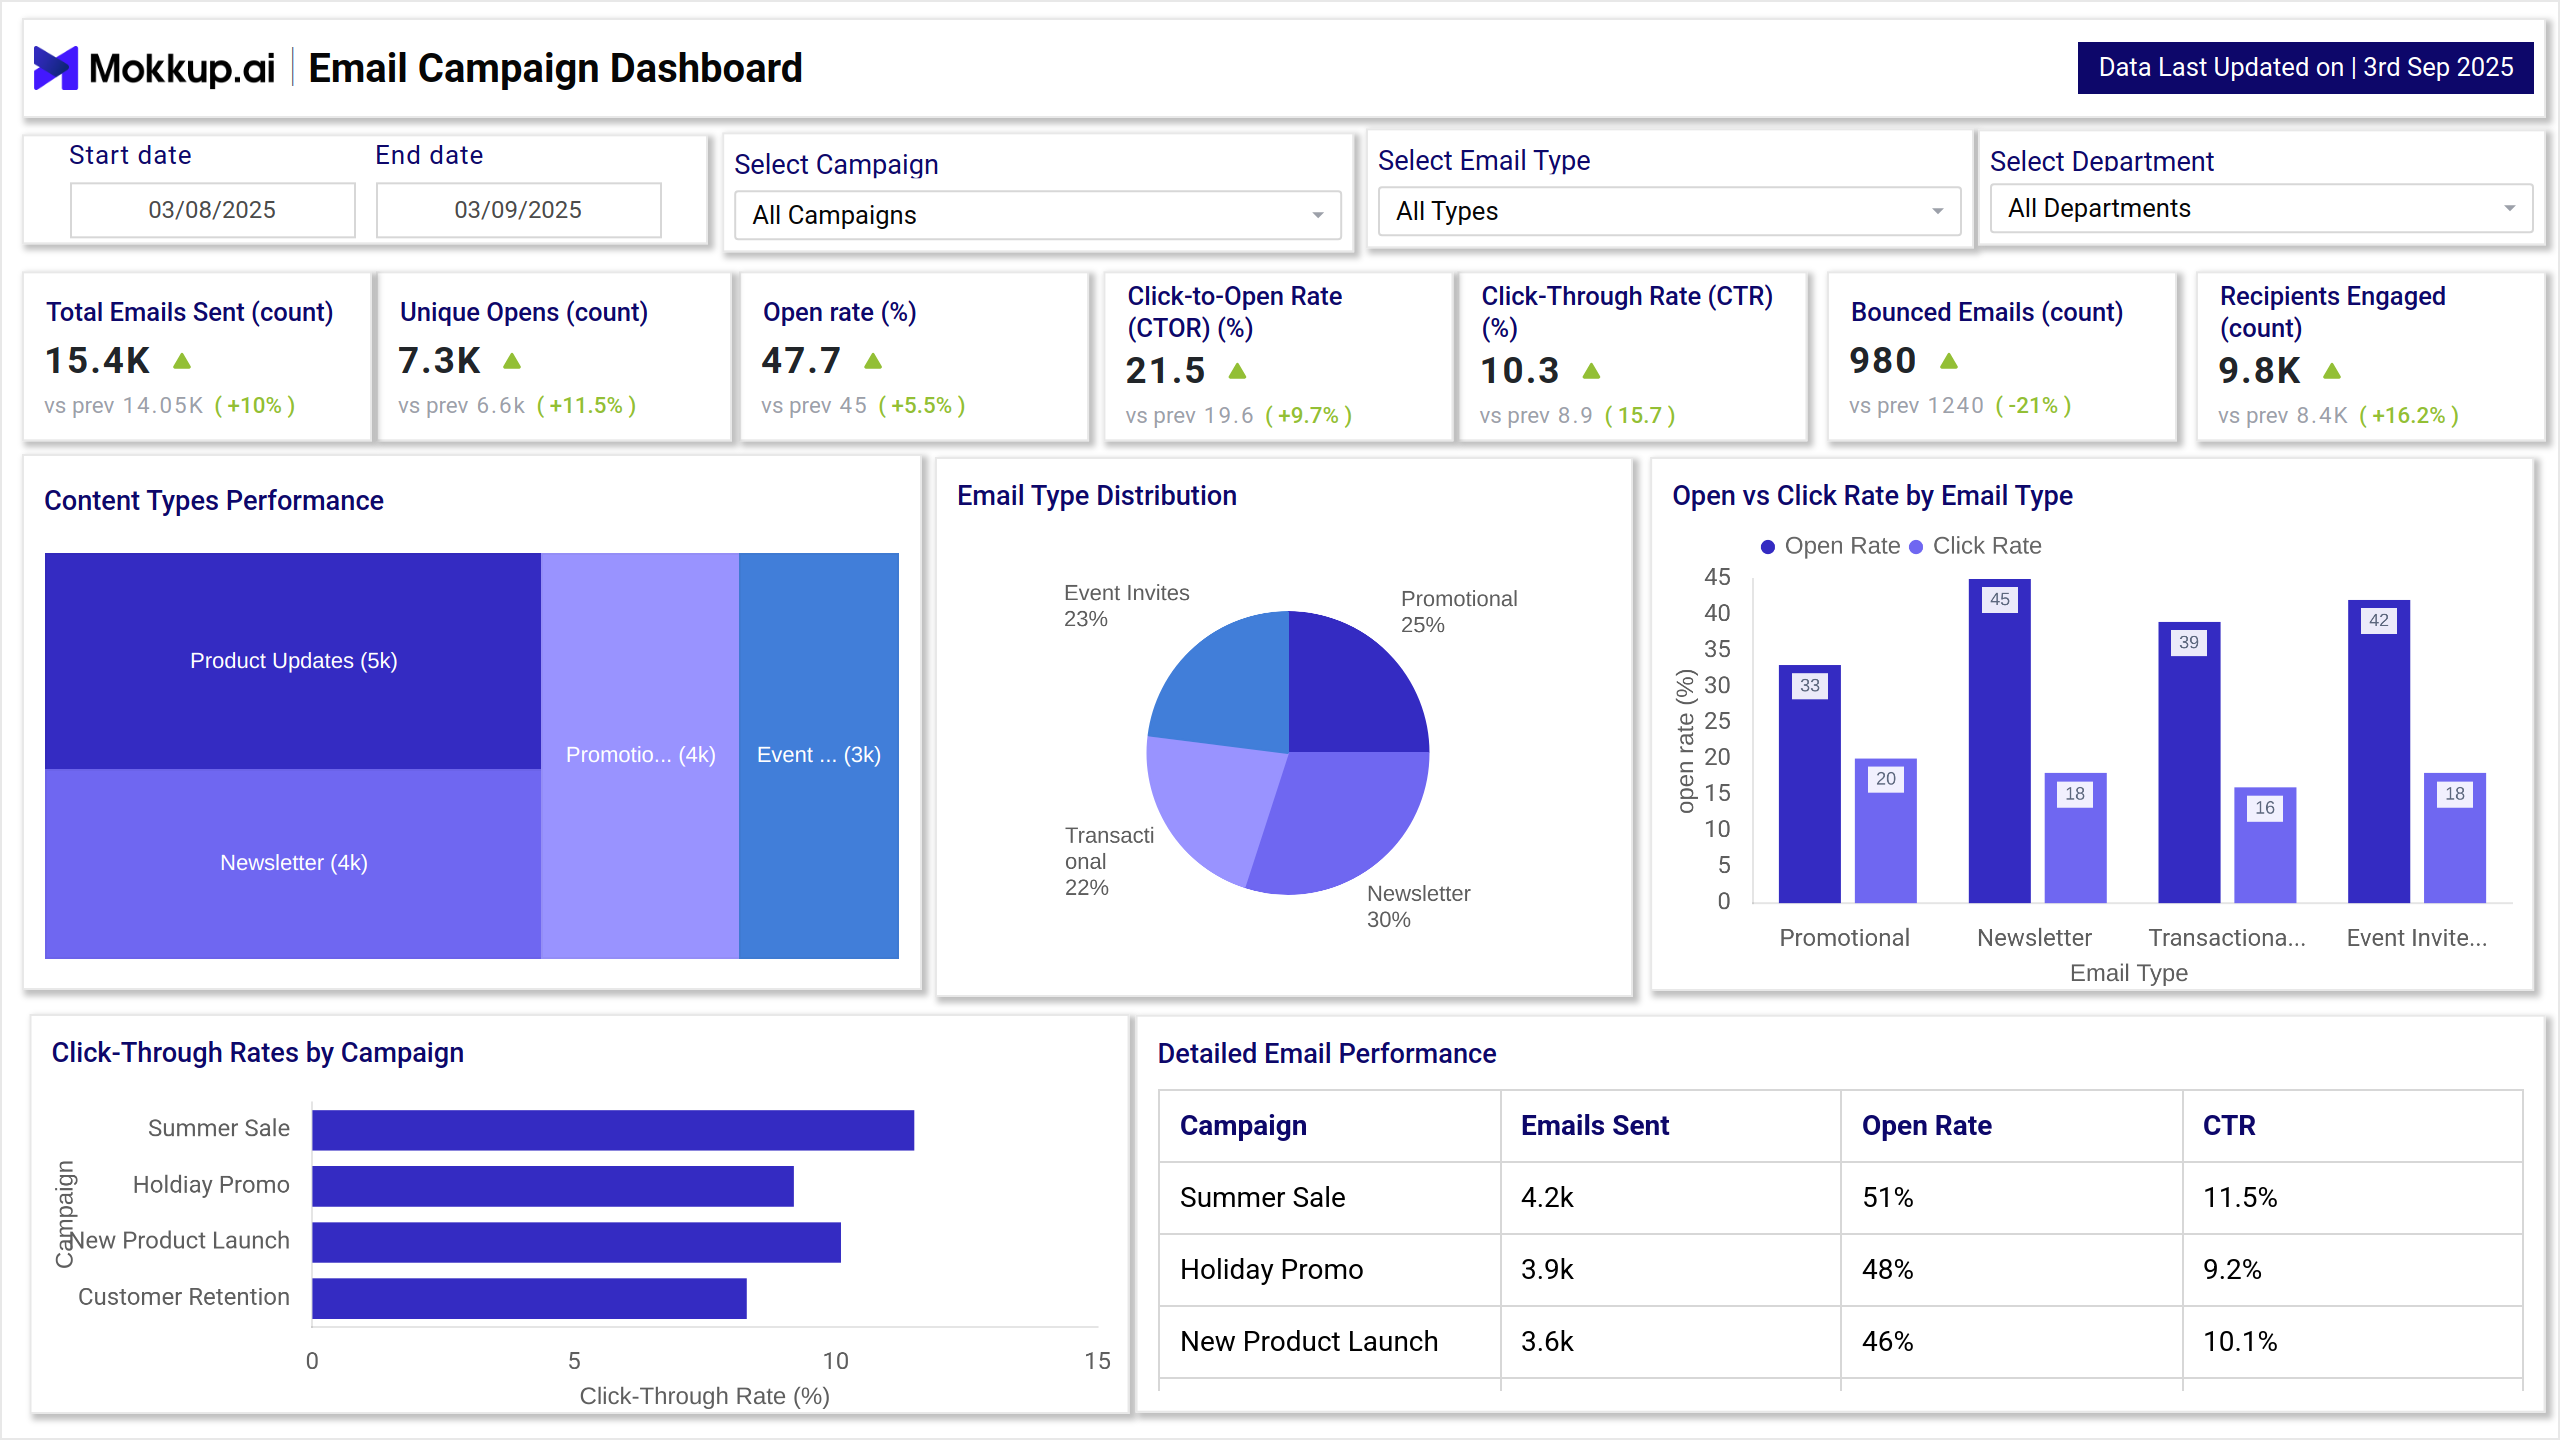
This real-time digital marketing performance dashboard integrates two complementary views:
- Email Campaign Performance: Tracks delivery, open rates, CTR, CTOR, bounce rates, and conversions.
- Content Engagement & Adoption: Measures how internal content is consumed, shared, and adopted across user groups.
Users can filter results by campaign type, audience segment, region, or time period, enabling them to compare performance across multiple dimensions. The layout of the dashboard typically features trend charts to show how open rates or content views evolve over time, comparative bar charts to evaluate CTR or adoption rates, heatmaps to analyze activity by day or hour, and treemap or pie charts to display the distribution of email types or content categories. Detailed tables provide granular insights into campaign-level or document-level performance. This dual structure ensures that organizations capture both outbound engagement and internal adoption in one unified dashboard.
This combination ensures that both outbound engagement (emails) and internal adoption (content usage) are captured in one dashboard.
How to Analyze Data in Digital Marketing Dashboards
Analyzing data in a digital marketing dashboard requires moving from raw numbers to strategic interpretation. Teams should begin by monitoring engagement trends such as open rate or content views over time, which help identify whether recent changes in subject lines, publishing schedules, or targeting strategies have had a positive effect. Comparing results across campaigns or departments highlights which strategies resonate most with audiences.
The dashboard also helps diagnose problems: a high bounce rate may point to poor email list quality or technical delivery issues, while low adoption in a particular department could suggest the need for training or customized content. Reviewing CTOR and CTR enables teams to refine calls-to-action and improve message relevance.
Marketers can uncover targeted insights that guide better decision-making by applying filters such as campaign type, geography, or audience segment. This approach enables continuous improvement across email campaigns, internal communications, and email marketing strategies.
Benefits of Digital Marketing Analysis Dashboards
Here are some benefits of using the best digital marketing analysis dashboard:
- Centralized monitoring – Brings campaign and engagement metrics into one place for easy access.
- Time-saving – Eliminates the need to track performance across multiple tools or spreadsheets.
- Faster decision-making – Provides executives with clear summaries to adjust strategies quickly.
- Optimized ROI – Identifies campaigns and content types that drive the highest conversions while flagging areas for improvement.
- Improved targeting – Highlights audience segments that respond best to specific campaigns.
- Stronger collaboration – Offers shared visibility across departments, enabling better teamwork.
- Real-time monitoring – Tracks delivery health and adoption levels instantly to address bounce issues or declining engagement.
- Actionable insights – Transforms fragmented data into strategies that maximize marketing effectiveness.
KPIs to Track in Digital Marketing Analysis Dashboards
The most impactful digital marketing metrics include:
- Open Rate (%) – Shows the percentage of recipients who opened an email, helping measure the effectiveness of subject lines and audience targeting.
- Click-Through Rate (CTR %) – Tracks how many recipients clicked on links in the email, reflecting how engaging and relevant the content is.
- Bounce Rate – Measures the percentage of undelivered emails, indicating list quality, delivery health, or technical issues.
- Total Content Views – Counts how often content is accessed, highlighting the visibility and reach of documents, articles, or shared resources.
- Adoption Percentage – Shows how widely content is used or shared across teams, reflecting overall adoption and impact of communication efforts.
By combining campaign KPIs with adoption metrics, organizations get a 360-degree view of their digital marketing ecosystem.
Frequently Asked Questions
1. Who should use a Digital Marketing Analysis Dashboard?
Marketing managers, communication specialists, and business leaders can all benefit. The dashboard supports campaign optimization, audience targeting, and internal adoption monitoring.
2. How often is the data updated?
Depending on integration, dashboards can update daily, weekly, or in real time, enabling quick interventions.
3. Can the dashboard be customized to our KPIs?
Yes, templates are fully customizable. Teams can add, remove, or modify KPIs and export to BI tools for advanced analysis.