E-commerce sales teams manage a vast amount of data daily, including revenue, orders, customer behavior, and marketing performance. Without a way to bring all this information together, it is difficult to determine what is working and where adjustments are required.
Dashboards help by displaying key numbers in one place, allowing teams to understand their performance and make informed decisions quickly. According to PwC, 73% of customers say their buying decisions are influenced by their experience, and dashboards help teams act on insights that improve that experience.
In this blog, we will look at the top five dashboards every e-commerce sales team should use. These dashboards will help you track sales, understand customer behavior, optimize your marketing, and monitor product performance. With the right dashboards, your team can focus less on manual reports and more on growing revenue and delighting customers.
Table Of Contents
- What Are E-commerce Dashboards?
- Why Dashboards Matter for E-commerce Sales Teams
- Top 5 E-commerce Dashboard Templates for the Sales Team
- How to Choose the Right Dashboard for Your Team
What Are E-commerce Dashboards?
E-commerce dashboards are visual reports that display key sales and performance metrics in a single location. They gather information from multiple sources, including your online store, marketplaces, marketing platforms, and payment systems. Instead of reviewing many reports, teams can view key indicators via charts, tables, and KPIs.
These dashboards enable sales teams to monitor revenue, orders, customer behavior, and product performance at a glance. E-commerce dashboards help accelerate decision-making and improve control over day-to-day sales operations by transforming raw data into actionable insights.
Why Dashboards Matter for E-commerce Sales Teams
As e-commerce businesses grow, sales teams are required to track more data and make faster, more informed decisions. Sales performance, marketing results, customer behavior, and financial metrics often reside in different systems, making it challenging to view the entire picture. Dashboards solve this by bringing key data together and presenting it in a clear, real-time view.
For example, if daily sales on your website drop but remain steady on marketplaces, a dashboard can immediately highlight this discrepancy. The team can then investigate whether the issue is related to traffic, pricing, or checkout problems and take action quickly.
This type of visibility reduces manual reporting, facilitates faster decision-making, and enables sales teams to focus on enhancing revenue and customer experience.
How Dashboards Support E-commerce Sales Teams
By consolidating critical metrics in one place, dashboards enable e-commerce sales teams to act more quickly and make informed decisions with confidence.
1. Clear, Data-Led Decisions:
Dashboards provide sales leaders with fast access to the most recent performance data. This enables teams to shift away from delayed reporting and make informed decisions based on what is actually happening within the organization. McKinsey reports that businesses driven by data are 23 times more likely to acquire customers and 19 times more likely to achieve higher profitability.
2. Faster Issue Identification:
Inventory shortages, delayed orders, and increasing return rates can all impact income if not addressed. Dashboards help teams identify these issues early by tracking operational indicators in real-time, enabling them to take faster corrective action.
3. Improved Customer Journeys:
Dashboards identify where customers drop off or discontinue by analyzing how they progress through the funnel. This makes it easier for sales teams to decrease friction, increase conversions, and drive repeat orders.
4. Better Visibility into Marketing Impact:
Dashboards link sales results to marketing efforts, displaying which channels and campaigns generate the most revenue. This knowledge enables teams to optimise spending, focus on high-performing programs, and boost overall return on investment.
5. Stronger Financial Oversight:
Dashboards that analyze revenue, margins, discounts, and client lifetime value enable sales and finance teams to monitor performance more effectively. This allows more effective planning, informed pricing decisions, and long-term growth.
Together, these benefits help e-commerce sales teams stay informed, react more quickly to changes, and focus on actions that drive consistent revenue growth rather than relying on manual reporting.

Top 5 E-commerce Dashboard Templates for the Sales Team
These pre-built Mokkup.ai dashboard templates help e-commerce teams track key metrics without having to build dashboards from scratch. Each template focuses on a specific area of performance.
1. Ecommerce Sales Forecasting Dashboard Template:
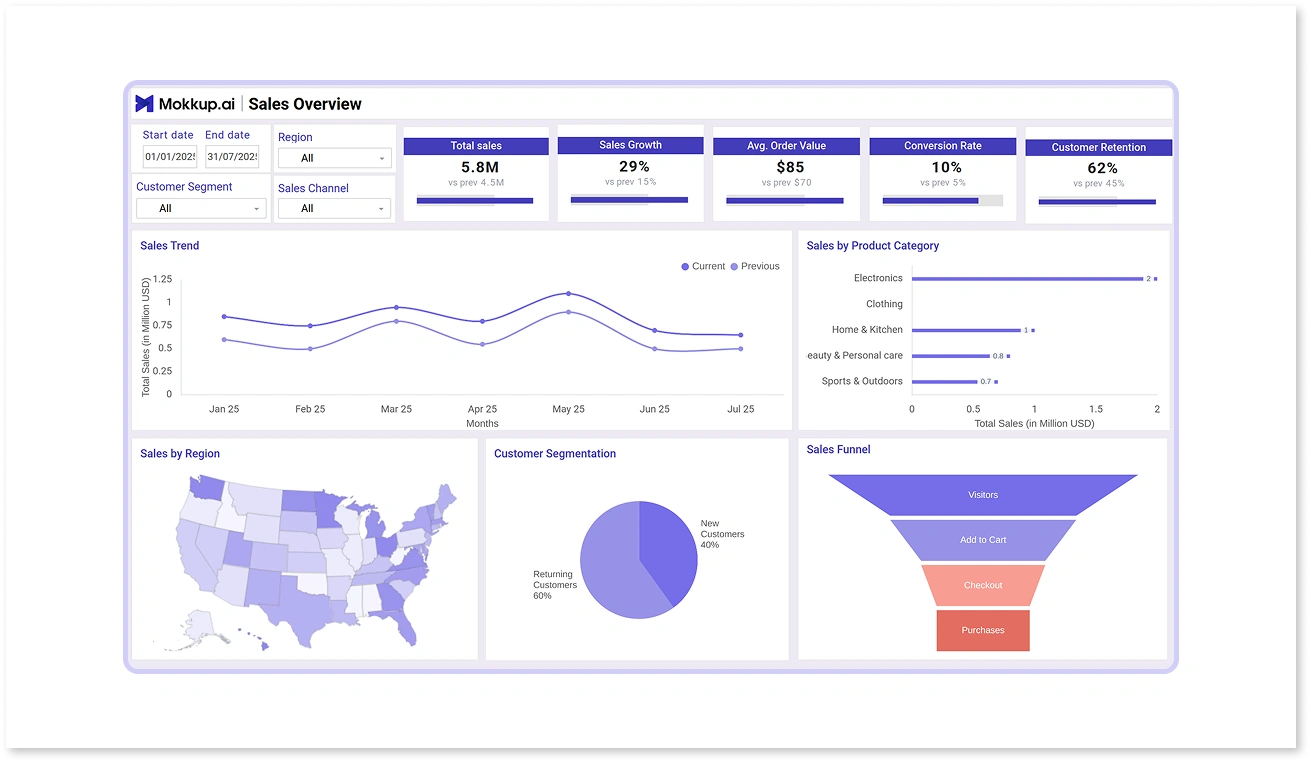
This Ecommerce Sales Forecasting Dashboard Template helps sales teams project future revenue by analysing historical sales trends and patterns. It lets you visualise expected sales performance, compare forecasts with actual results, and plan inventory and marketing efforts more confidently without building your own forecasting model from scratch.
- Purpose: Project future revenue by analyzing historical trends.
- Key Metrics: Projected revenue, growth rates, seasonal trends, past sales.
- Tip: Compare actual results with forecasts on a weekly basis to identify dips early and plan necessary inventory or marketing adjustments.
2. Ecommerce Geographical Analysis Dashboard Template:
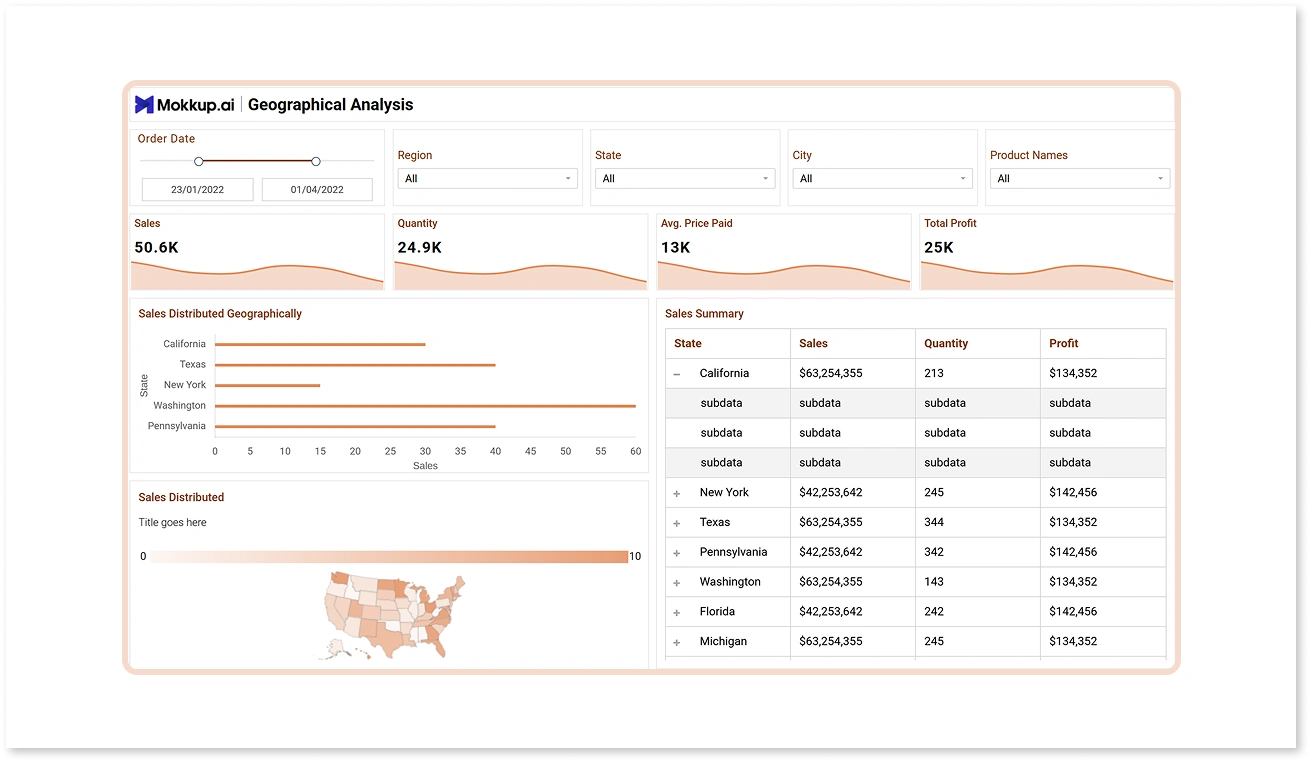
This Ecommerce Geographical Analysis Dashboard Template helps sales teams visualise where their customers are located and how sales differ across regions. It makes it easier to spot high-performing markets, tailor marketing efforts by geography, and plan resources based on regional demand trends.
- Purpose: Visualize sales performance by region to identify high-demand markets.
- Key Metrics: Customer lifetime value, purchase frequency, high-value segments, sales by source.
- Tip: Use this dashboard template to identify high-value customer segments and tailor campaigns for maximum ROI.
3. Ecommerce Multi-Channel Analytics Dashboard Template:
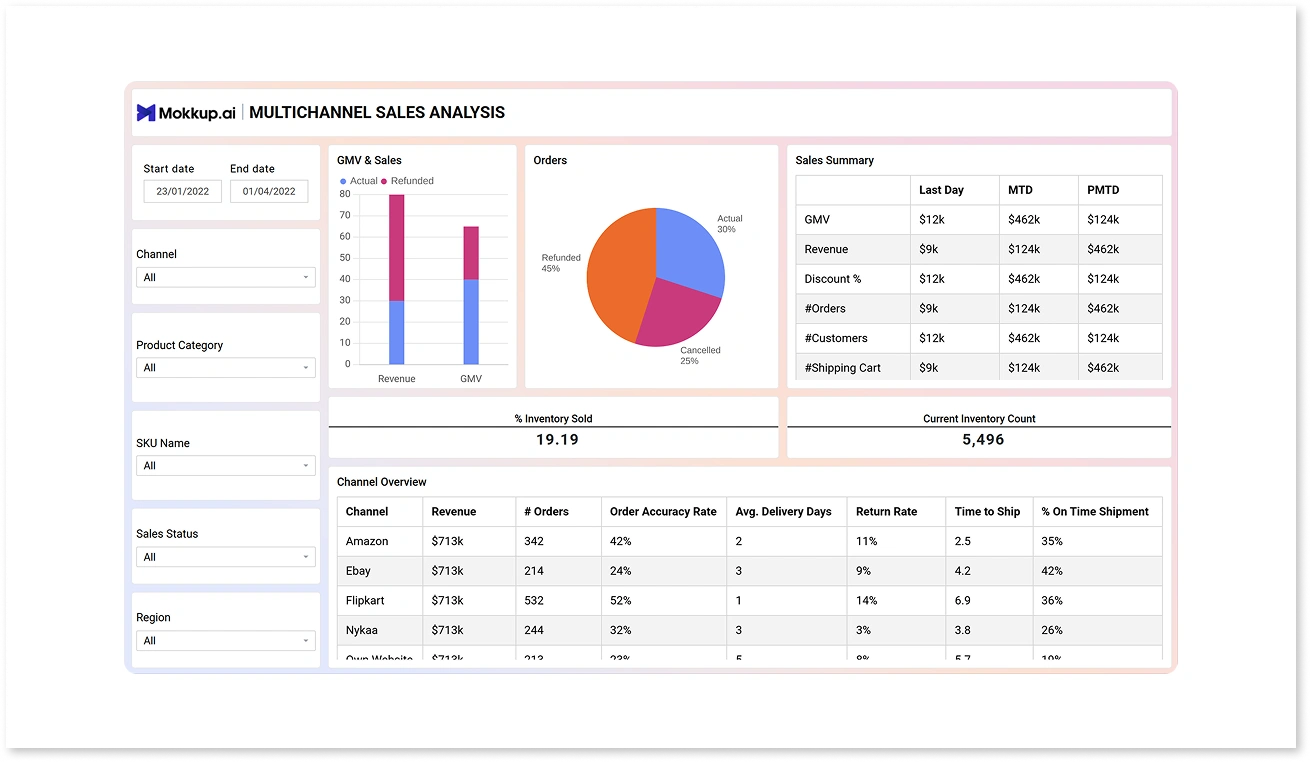
This E-commerce Multi-Channel Analytics Dashboard Template helps sales teams monitor performance across all your sales channels in one place. It enables you to compare revenue, orders, and customer metrics across different platforms, allowing you to identify trends, optimize sales efforts, and make informed decisions more quickly.
- Purpose: Monitor performance across all sales channels in one place.
- Key Metrics: Revenue by channel, number of orders, customer acquisition per platform, conversion rates.
- Tip: Regularly compare channel performance to optimize sales efforts and focus on high-performing platforms.
4. Ecommerce Product Insights Dashboard Template:
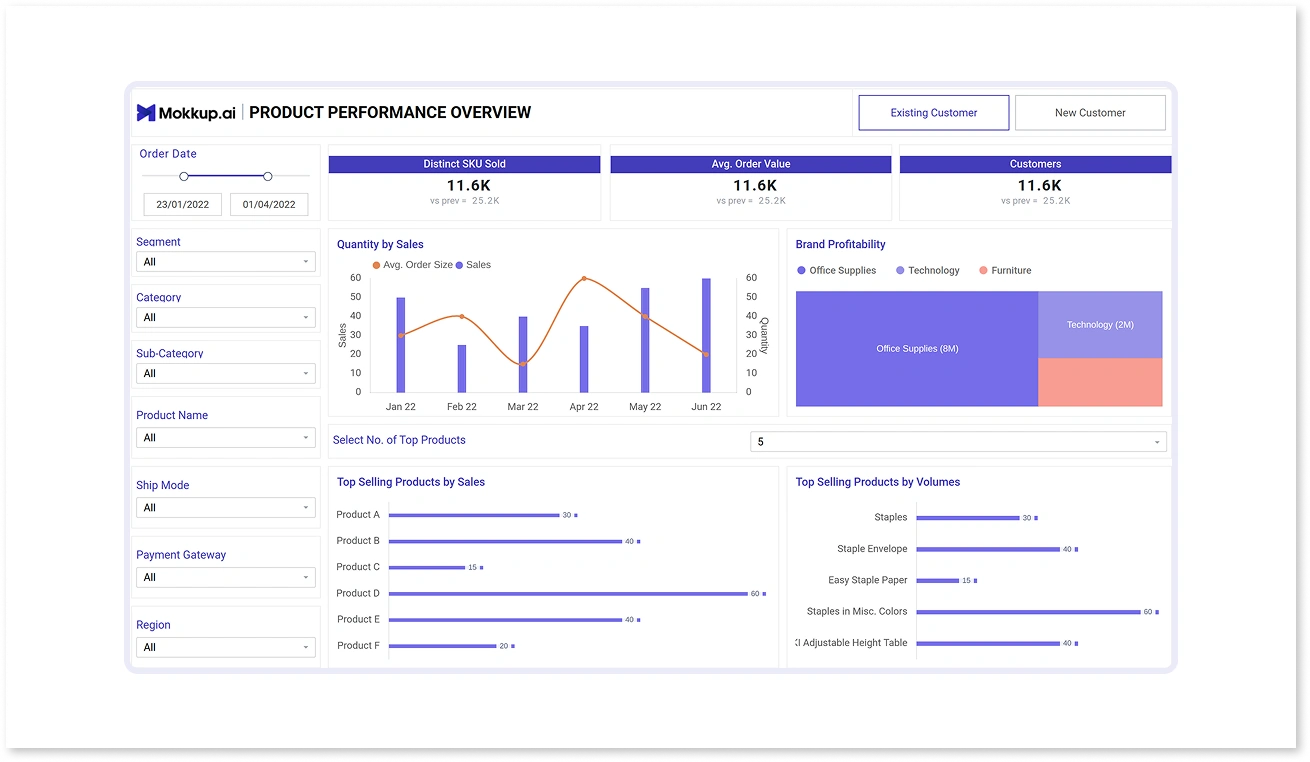
This Ecommerce Product Insights Dashboard Template helps sales teams analyze product performance and customer behavior in one place. It brings together key e-commerce metrics, such as product sales trends, top-selling items, and customer engagement insights, so you can quickly spot opportunities and optimise your sales strategy without designing the dashboard yourself.
- Purpose: Analyze product performance and customer behavior in one view.
- Key Metrics: Top-selling items, product sales trends, inventory levels, customer engagement metrics.
- Tip: Identify high-performing and underperforming products to refine sales strategies and optimize inventory management.
5. Ecommerce Customer Spend Dashboard Template:
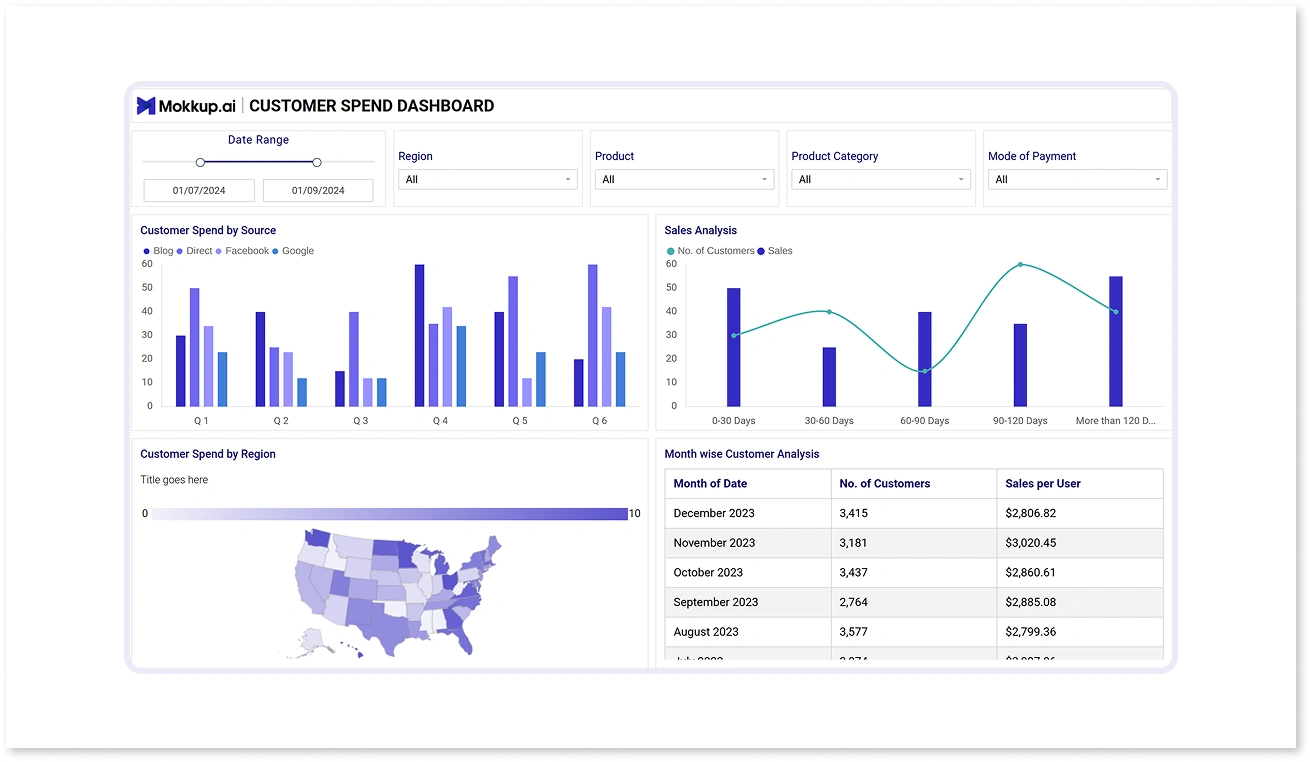
This Ecommerce Customer Spend Dashboard Template helps e-commerce sales teams analyse how customers spend across channels, regions, products, and time periods. It provides a clear view of customer spending patterns, sales by source, and regional performance, making it easier to identify high-value segments and track changes in customer behaviour.
- Purpose: Understand customer spending habits across channels and time periods.
- Key Metrics: Customer lifetime value, purchase frequency, high-value segments, sales by source.
- Tip: Use this dashboard template to identify high-value customer segments and tailor campaigns for maximum ROI.
While the top five e-commerce dashboard templates provide a solid starting point, the next step is to ensure you select the dashboards that best fit your team’s specific needs. Not every template will be equally useful for every business, so it’s important to match dashboards to your goals, roles, and data sources.
Doing so ensures your team can make faster, smarter decisions and focus on strategies that drive growth rather than spending time digging through reports.
How to Choose the Right Dashboard for Your Team
Not every dashboard works for every e-commerce sales team. Choosing the right one depends on your business goals, team size, sales channels, and the metrics that matter most. Here’s how to select the best dashboards:
- Identify Your Key Metrics: Determine what your team needs to track, such as sales revenue, customer behavior, product performance, or marketing ROI. Dashboards should focus on metrics that directly impact decision-making and inform strategic planning.
- Match Dashboards to Roles: Sales managers, marketing teams, and finance teams may need different views. For example, product managers might focus on product insights, while finance teams monitor revenue and margins.
- Consider Data Sources: Ensure the dashboard can integrate data from your online store, marketplaces, CRM, and marketing platforms to provide a comprehensive view of your business. Unified data ensures accurate, real-time insights.
- Prioritize Usability: Dashboards should be easy to read and interpret. Visualizations, clear KPIs, and real-time updates help teams act quickly without confusion.
- Scalability and Customization: As your business grows, choose dashboards that enable you to add new metrics, channels, or regions without requiring a complete overhaul.
By carefully choosing dashboards tailored to your team’s needs, you can streamline reporting, reduce manual effort, and focus on strategies that drive growth.
Conclusion
E-commerce dashboards are valuable tools that enable sales teams to make faster, smarter, and more informed decisions. Dashboards save time by gathering key metrics in one place, reducing the need for manual reporting, and providing real-time insights into sales performance, customer behavior, marketing impact, and product trends.
Using the right templates enables teams to get started quickly without having to design dashboards from scratch, allowing them to focus on actions that drive growth and improve the customer experience.
Frequently Asked Questions
An e-commerce dashboard is a visual report that brings together key sales, customer, and marketing metrics in one place. It helps teams track performance and make faster, data-driven decisions.
Dashboard templates save time by providing a ready-made structure with essential metrics that are already preconfigured. They enable teams to start tracking performance quickly without having to design dashboards from scratch.
Common metrics include revenue, number of orders, conversion rates, customer lifetime value, product performance, and sales by channel or region. The exact metrics should align with your business goals.
Choose dashboards based on your goals, team roles, and data sources. Focus on usability, relevant KPIs, and the ability to scale as your business grows.
Prompt it. Wireframe it with Mokkup.ai.
